5134
3D Fiber Aligned Strain Rate: Application to Unilateral Limb Suspension Induced Atrophy1Physics, San Diego State University, San Diego, CA, United States, 2Physics, UC San Diego, La Jolla, CA, United States, 3Radiology, UC San Diego, San Diego, CA, United States
Synopsis
2D and 3D strain rate imaging has been recently introduced to study local tissue deformations. The strain rate tensors are represented in the principal basis while further relevant physiological information can be obtained by extracting 3D strain rate tensors in the muscle fiber basis; the latter is determined by diffusion tensor imaging. Here, we present the methodological developments to extract 3D fiber aligned strain rate images and application to study atrophy induced by Unilateral limb suspension. FASR indices were much smaller than those extracted in the principle basis and further studies are required to understand FASR changes with suspension.
Purpose
To extract voxel based fiber aligned strain rate tensor combining multi-slice dynamic velocity encoded phase contrast images and diffusion tensor data acquired in geometrically matched slices. 3D strain rate tensor can be extracted in the principle axis basis from multi-slice velocity encoded phase contrast images. In order to represent the tensors in the muscle fiber basis, the muscle fiber direction is required at the voxel level. This is determined from diffusion tensor imaging of anatomical matched slices. This study explores ULLS induced changes in 3D strain rate tensor in the medial gastrocnemius (MG) from multi-slice velocity encoded phase contrast (VE-PC) images acquired under isometric contraction in the principle basis and in the muscle fiber basis.Methods
Seven subjects were recruited after IRB approval and scanned on a 1.5T GE scanner before and after four-week period of muscle atrophy induced on the non-dominant leg using the ULLS model1. Imaging protocol included a set of gated VE-PC images obtained during isometric contraction at 35% MVC (TE: 7.7ms, TR: 16.4ms, NEX: 2, FA: 20°, 7 contiguous slices, thickness 5mm / skip 0, sagittal-oblique orientation, FOV: 30×22.5cm (partial-phase FOV: 0.75), matrix: 256×192, 4 views/segment, 22 phases, 3D velocity encoding, venc: 10cm/s. 72 repetitions, cycle length 2.9sec). Further, diffusion weighted images of the lower leg in relaxed state corresponding to first frame of VE-PC images and matching geometry were acquired. 3D Strain rate tensor was calculated from the velocity images of sequential slices by taking 3D spatial gradient and then symmetrized. Principle basis and eigenvalues were obtained (SRfiber, SRin-plane, SRthrough-plane). Components of the strain rate tensor in the diffusion basis (labeled f – muscle fiber, s – and t – secondary/tertiary diffusion eigenvector direction respectively) were obtained by rotating SR tensor according to the equation (1) where R is the matrix of the diffusion eigenvectors in the voxel.
$$ \mathbf{SR}_\textrm{DTI}= R \cdot \mathbf{SR} \cdot R^\textrm{T} $$
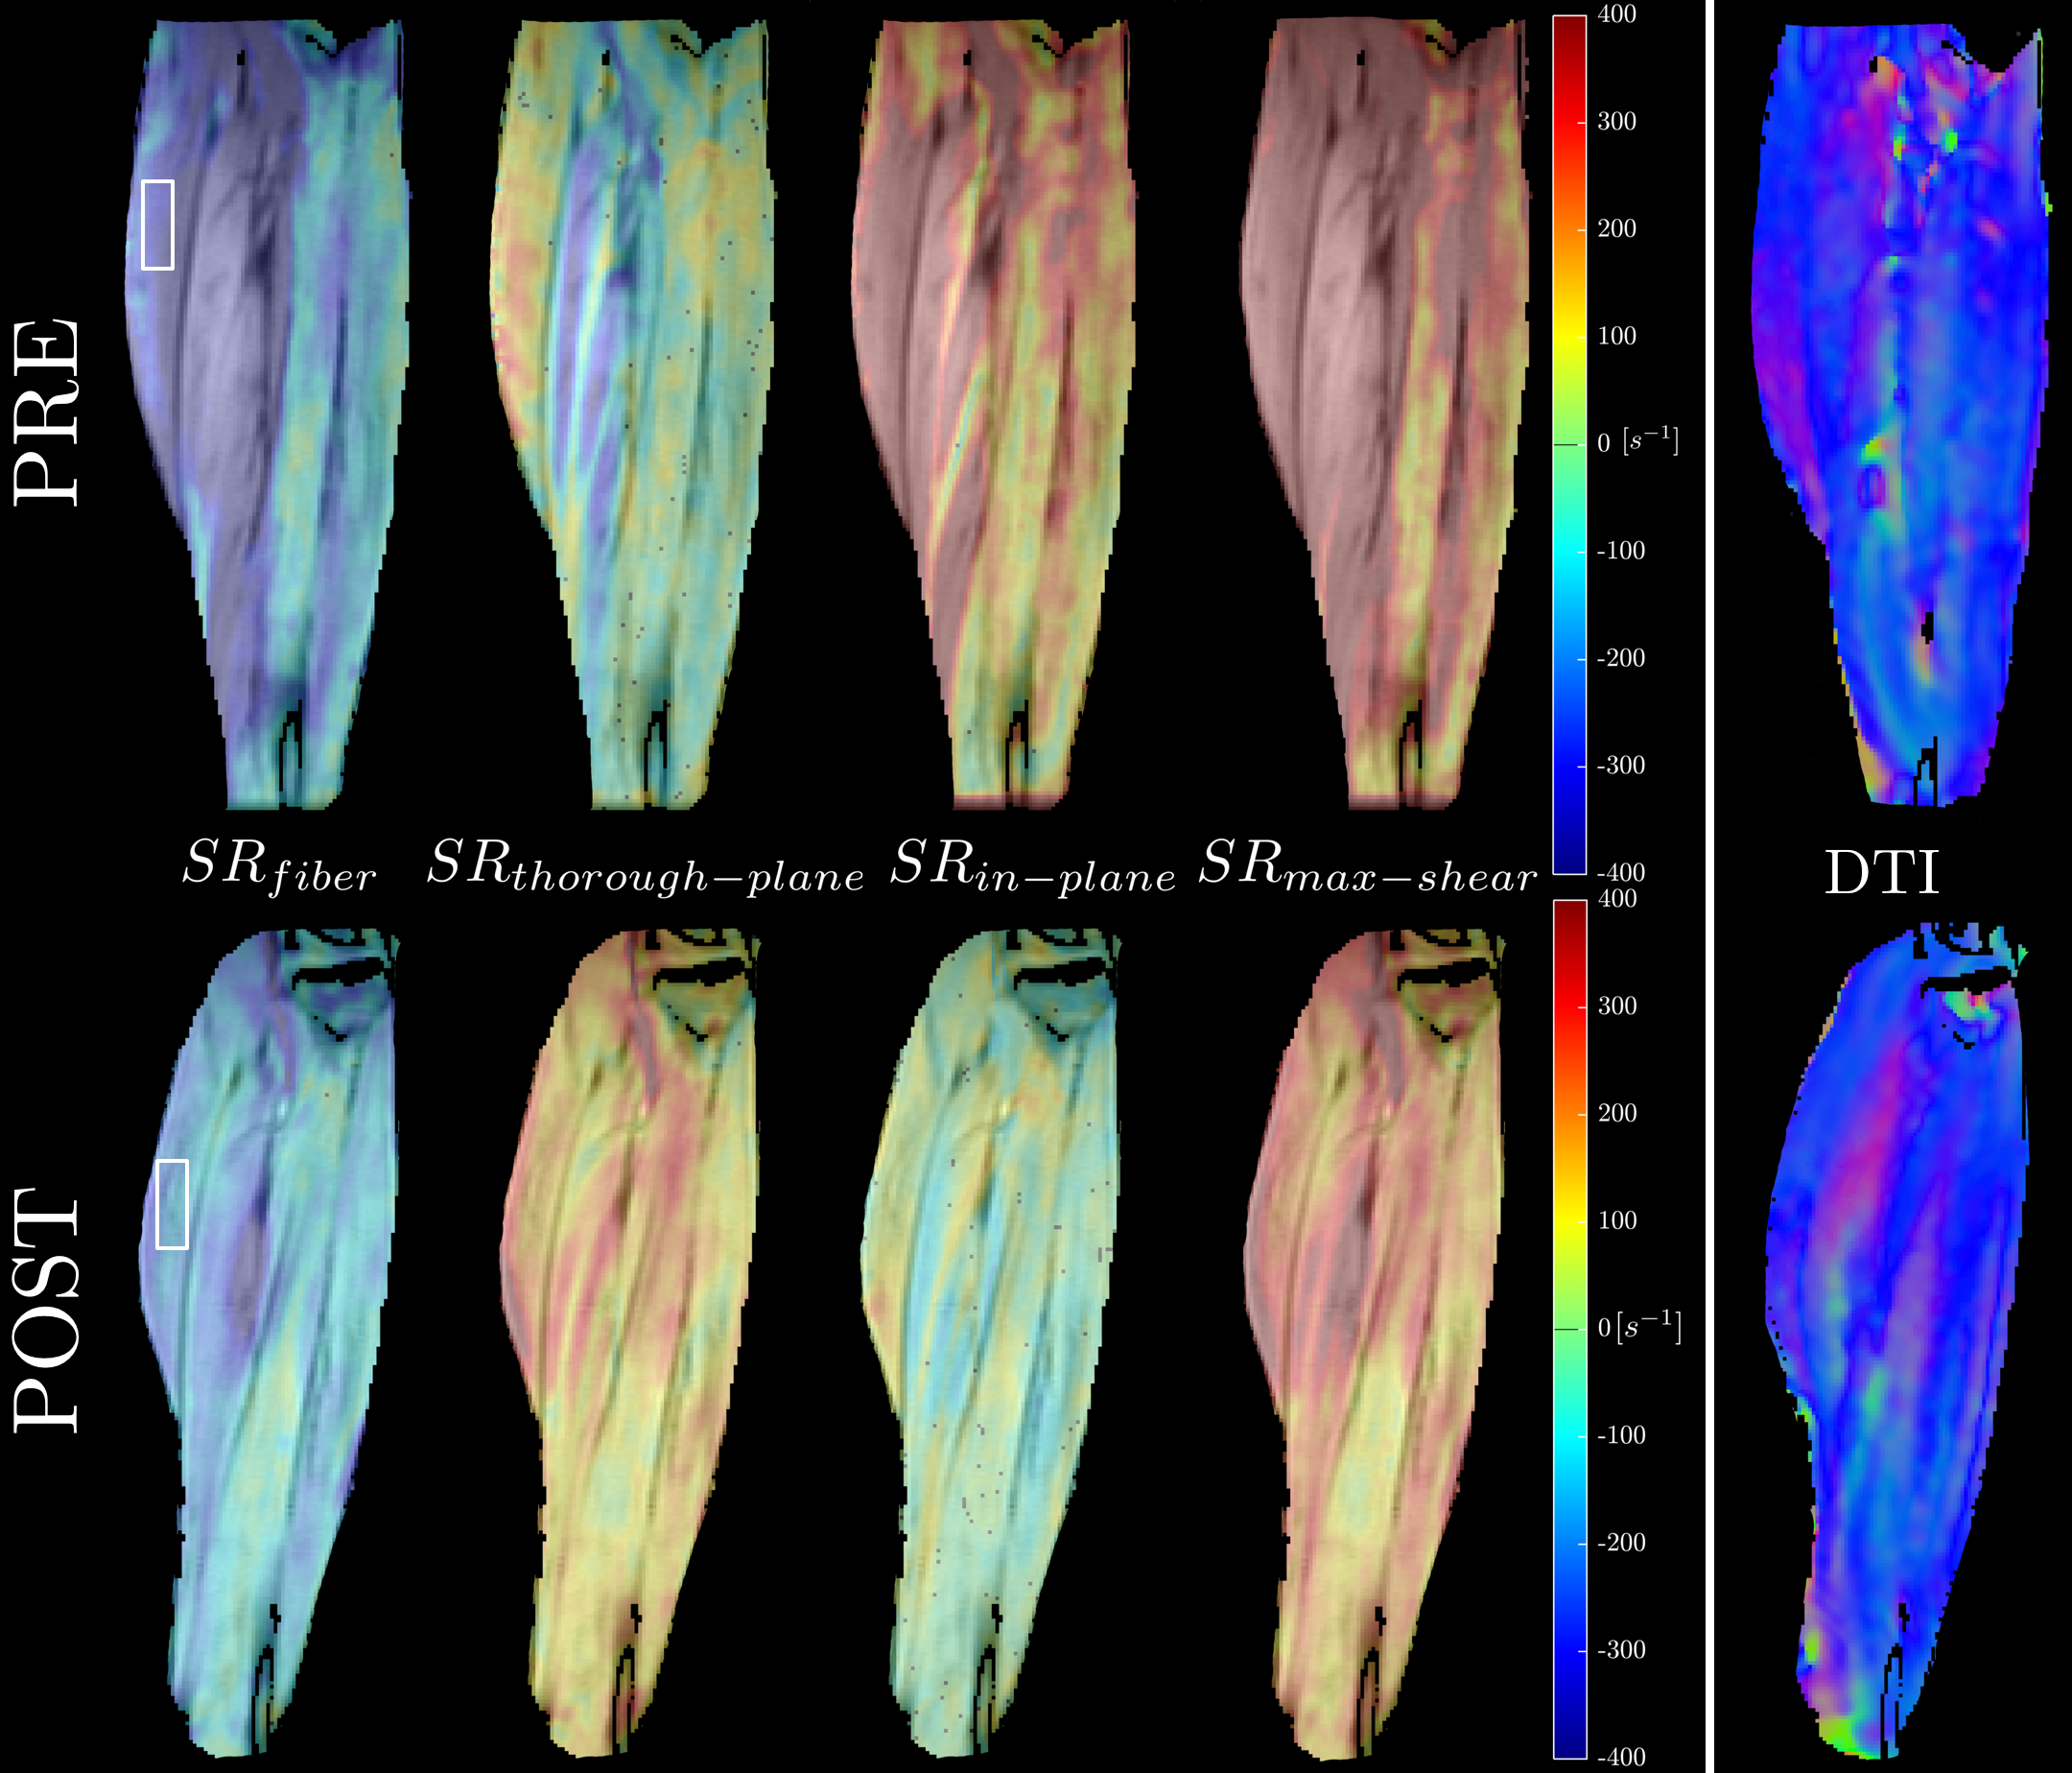
In addition, the maximum shear strain (SRshear-strain) was obtained calculating the deviatrix of the diagonalized SR tensor. Quantitative analysis was performed for 3D region of interest 24×10×3 (28mm×10mm×15mm) placed inside medial gastrocnemius muscle (Fig. 1). Position of each voxel inside ROI was tracked across the contraction-relaxation cycle. Differences in strain rate indices between pre- and post-ULLS groups extracted at the frame corresponding to max SRfiber were accessed using repeated measures two-way ANOVAs.
Results
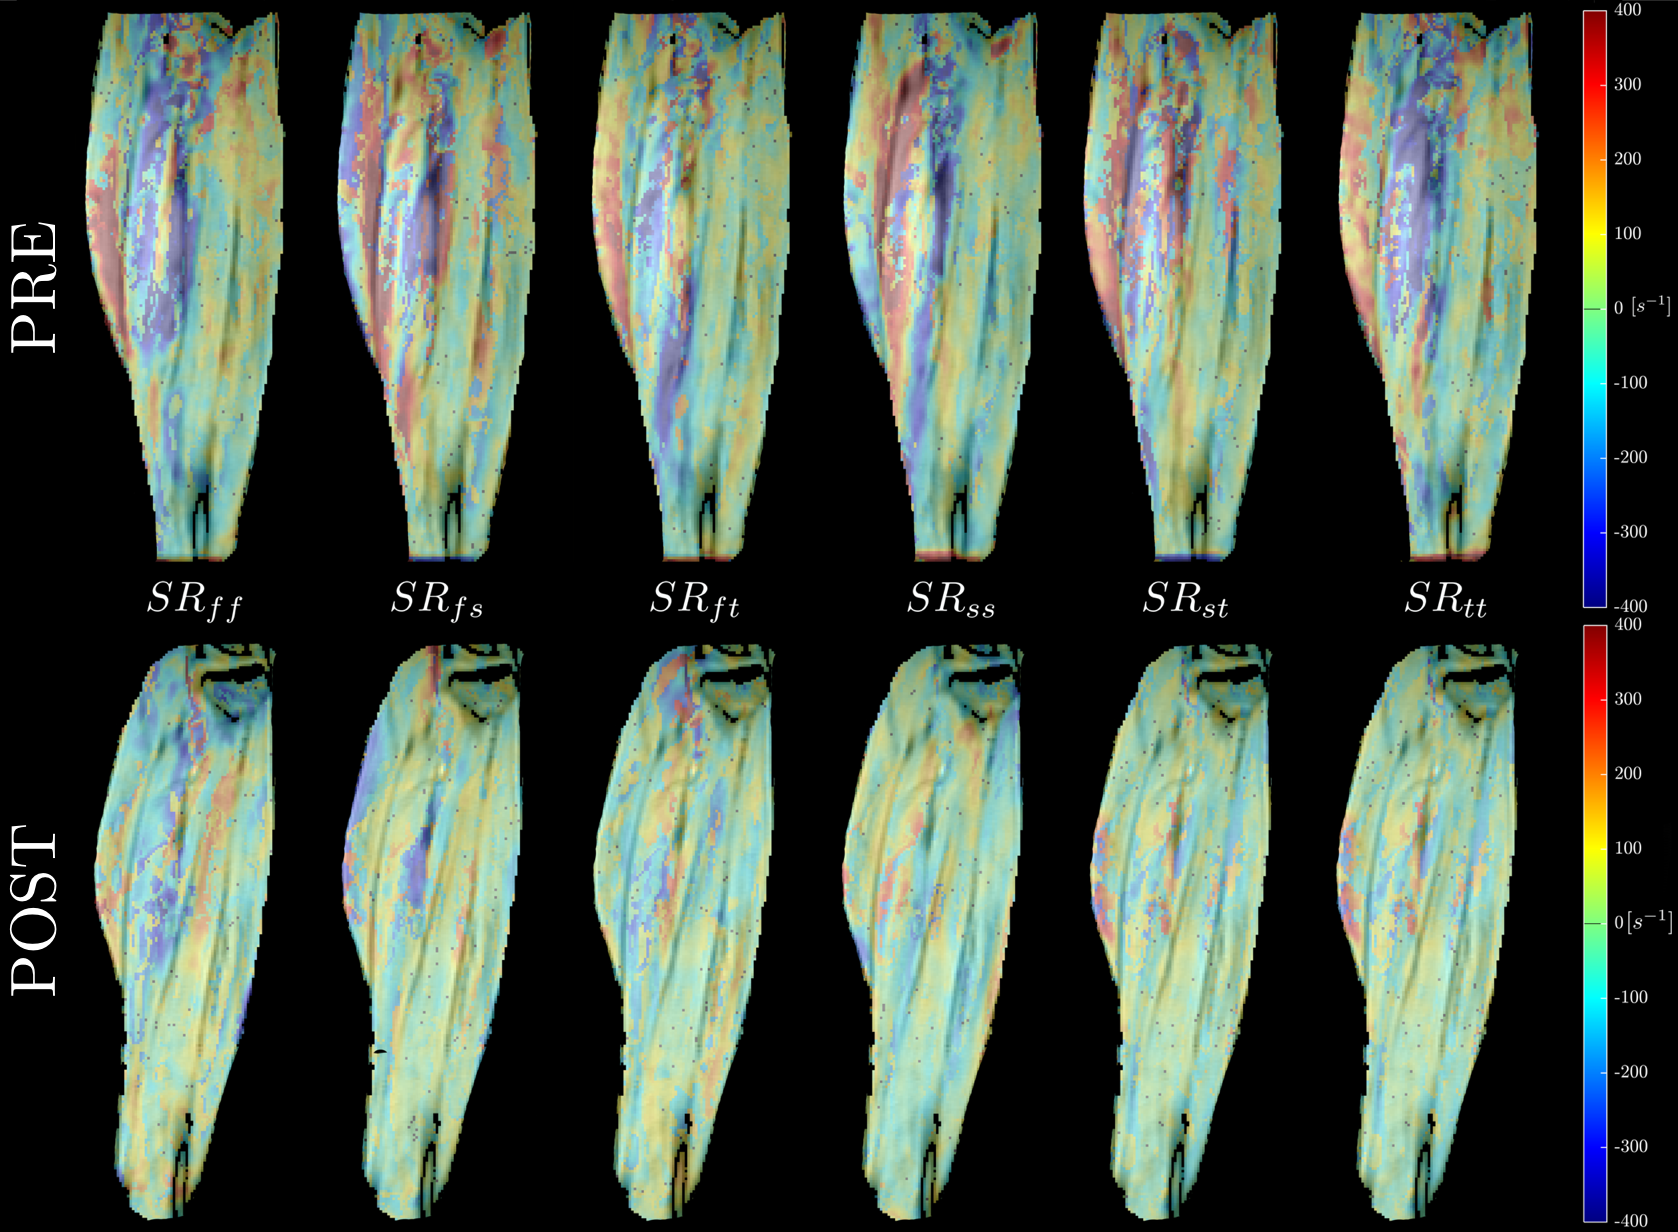
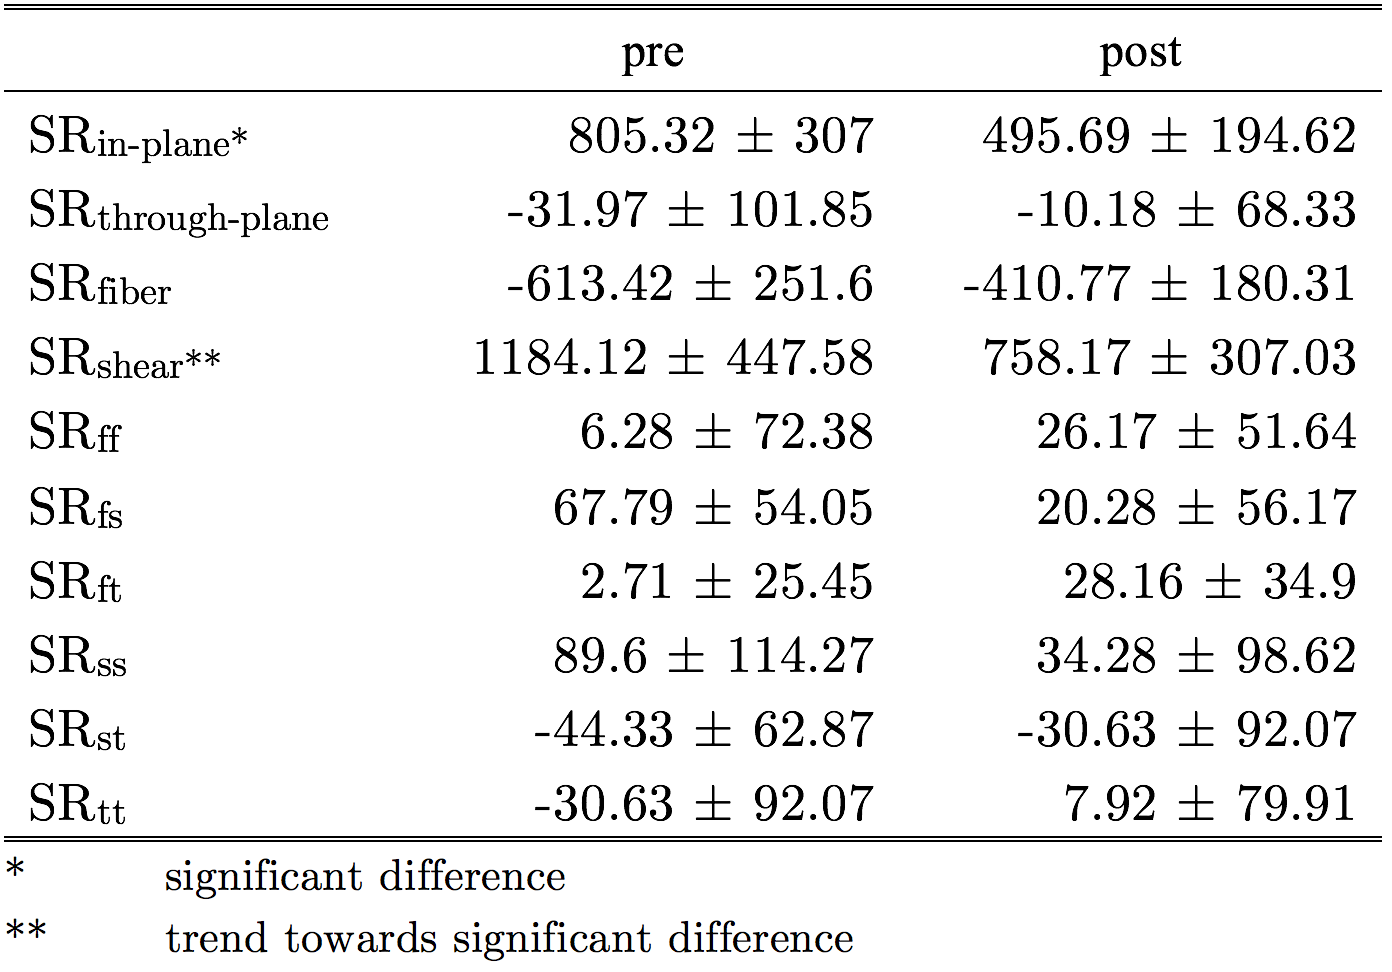
Fig. 1 shows the maps of the SR tensor in the principal basis, and the maximum shear strain rate in one subject pre- and post-suspension; images are shown at the peak of SRfiber. The last frame in Fig. 1 shows the lead eigenvector from DTI, the blue/purple shade indicates that MG fibers run in the cranial-caudal direction primarily. Fig. 2 shows the FASR components (6) for the same subject pre- and post-suspension. It is clear that all the FASR values are much smaller than those in the principal basis. Further, while changes can be seen with suspension in the principal basis frame and in the shear strain, it is difficult to visualize any changes in the FASR components. Table 1lists the results of the statistical analysis on the SR indices extracted from both basis as well as in the maximum shear strain.Discussion
The 3D strain rate indices in the principal basis are reduced post-suspension, significance is reached in SRin-plane only (deformation in the image plane shown in Figs. 1 and 2). The 3D SR mapping also shows that SRthrough-plane (deformation perpendicular to the imaging plane) has very small values, confirming that deformation is highly anisotropic in the fiber cross-section. The maximum shear strain also shows a trend toward significance: a decrease with suspension is noted. The two SR indices (SRin-plane and SRmax-shear) showing significant differences with suspension may be associated with extracellular matrix (ECM) remodeling with atrophy2. A stiffer ECM may limit deformation in-plane3 and reduce the SR and further, also reduce the shear (which is presumed to occur in the endomysium)4. The small values of all the FASR components is not fully understood; further studies are required for a comprehensive explanation. However, it should be noted this study is the first to extract fiber aligned strain rates using the muscle fiber basis from DTI to rotate the SR tensor from principal to muscle fiber basis.Conclusion
3D SR analysis in fiber basis using DTI data in matched anatomical slices is technically feasible. 3D SR in the principal basis showed significant decrease in the in-plane and shear strain components. These indices are associated with ECM status and the decrease with suspension could well reflect ECM remodeling with atrophy.Acknowledgements
This work was supported by the National Institute of Arthritis and Musculoskeletal and Skin Diseases Grant 5RO1-AR-053343-08.References
[1] Goodpaster BH, Park SW, Harris TB, Kritchevsky SB, Nevitt M, Schwartz AV, et al. J Gerontol A Biol Sci Med Sci. 2006;61(10):1059-64.
[2] Malis V, Sinha U, Csapo R, Narici M, Sinha S. Magn Reson Med. 2017;doi: 10.1002/mrm.26759.
[3] Azizi E, Deslauriers AR, Holt NC, Eaton CE. Biomech Model Mechanobiol. 2017, doi: 10.1007/s10237-017-0909-3.
[4] Zhong X, Epstein FH, Spottiswoode BS, Helm PA, Blemker SS. J Biomech. 2008;41(3):532-40.
Figures