5128
Optimization of overlap-resolved CEST for specific mapping of Glutamate and GABA1Champalimaud Centre for the Unknown, Lisbon, Portugal
Synopsis
Glutamate-CEST (GluCEST) has been recently emerging as a powerful new technique for mapping Glutamate in the brain. A recent development termed overlap-resolved CEST (orCEST) has demonstrated that other metabolites may contaminate GluCEST contrast, and proposed how to resolve the wanted signals; here we optimize orCEST contrast to reflect Glutamate and GABA with very high sensitivity and good specificity. orCEST experiments are optimized on metabolite phantoms, and then are applied in-vivo in the rat. The results are promising for neurotransmitter mapping in-vivo.
Introduction
Chemical Exchange Saturation Transfer (CEST) is a powerful technique endowing MRI with specificity. Recently, the GluCEST1 contrast has been gaining interest for its ability to contrast Glutamate – the brain’s primary excitatory neurotransmitter - in-vivo2,3. A recent development termed overlap-resolved CEST4 suggested that other molecules may contaminate GluCEST contrast, and proposed means for enhancing specificity to Glutamate by spectral editing of the CEST asymmetry profiles. Here, we optimize orCEST such that it reports on both Glutamate and GABA with high specificity and sensitivity. The first such preclinical experiments in-vivo are presented.Methods
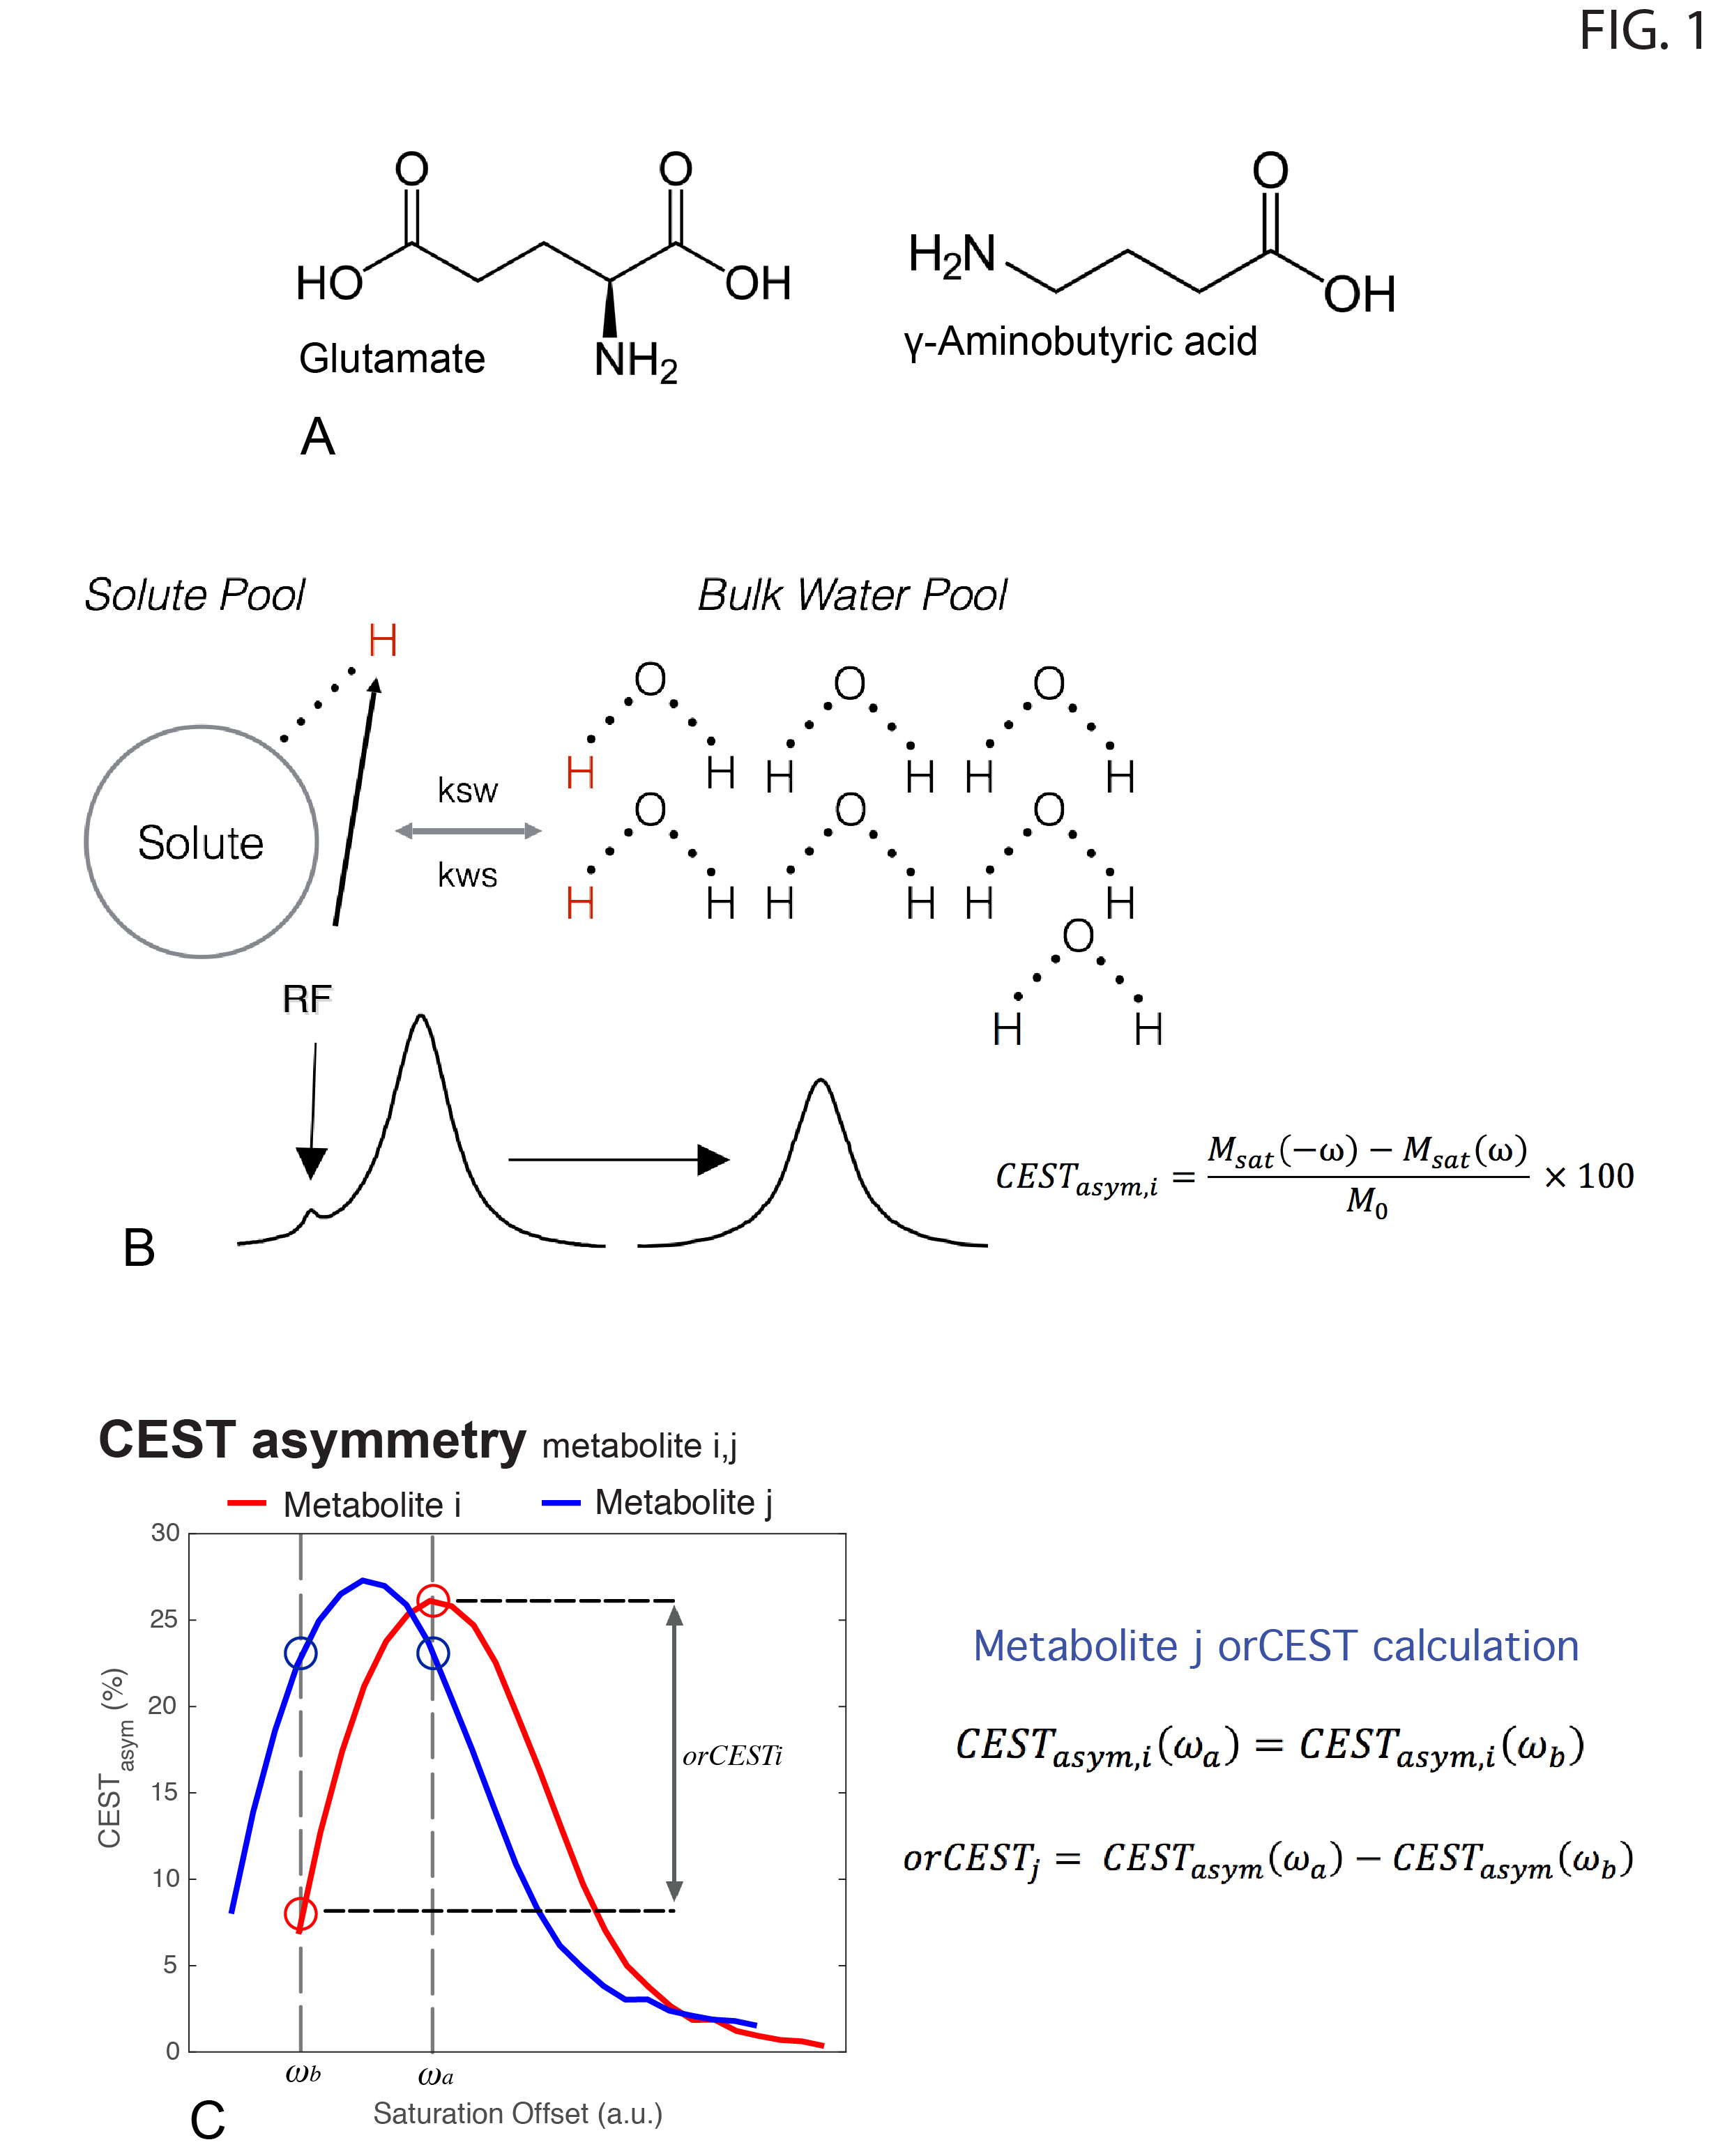
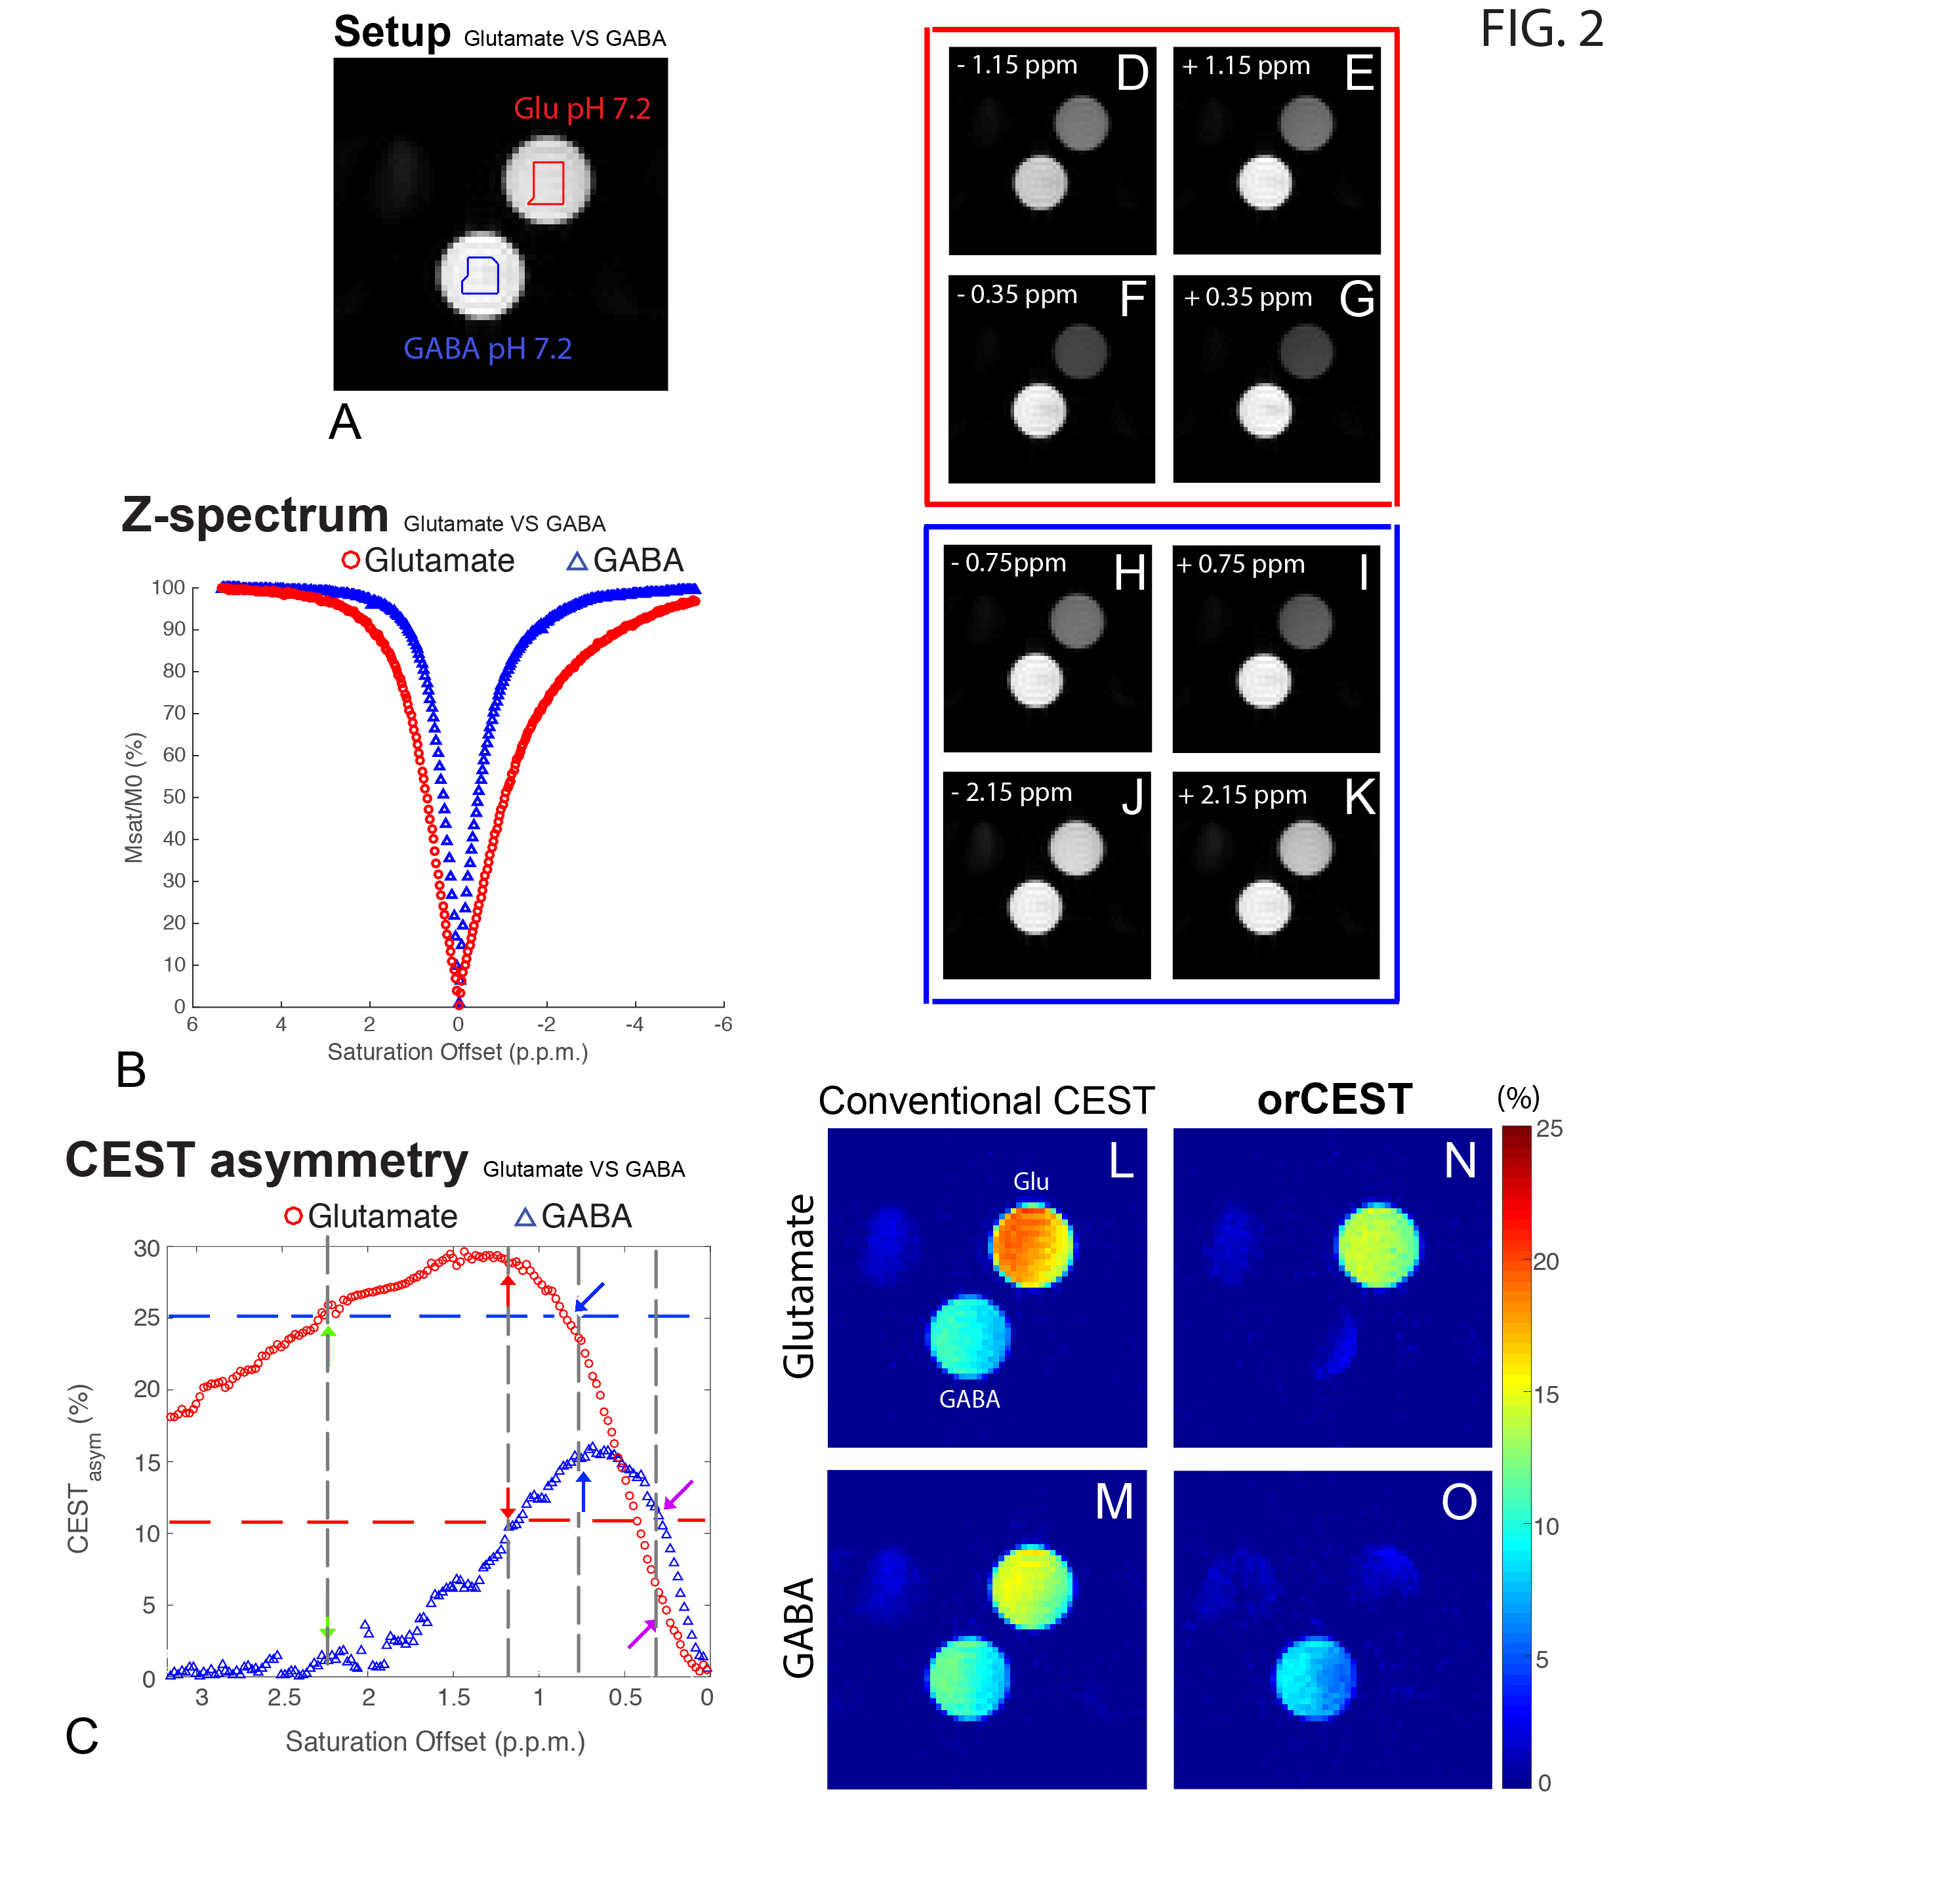
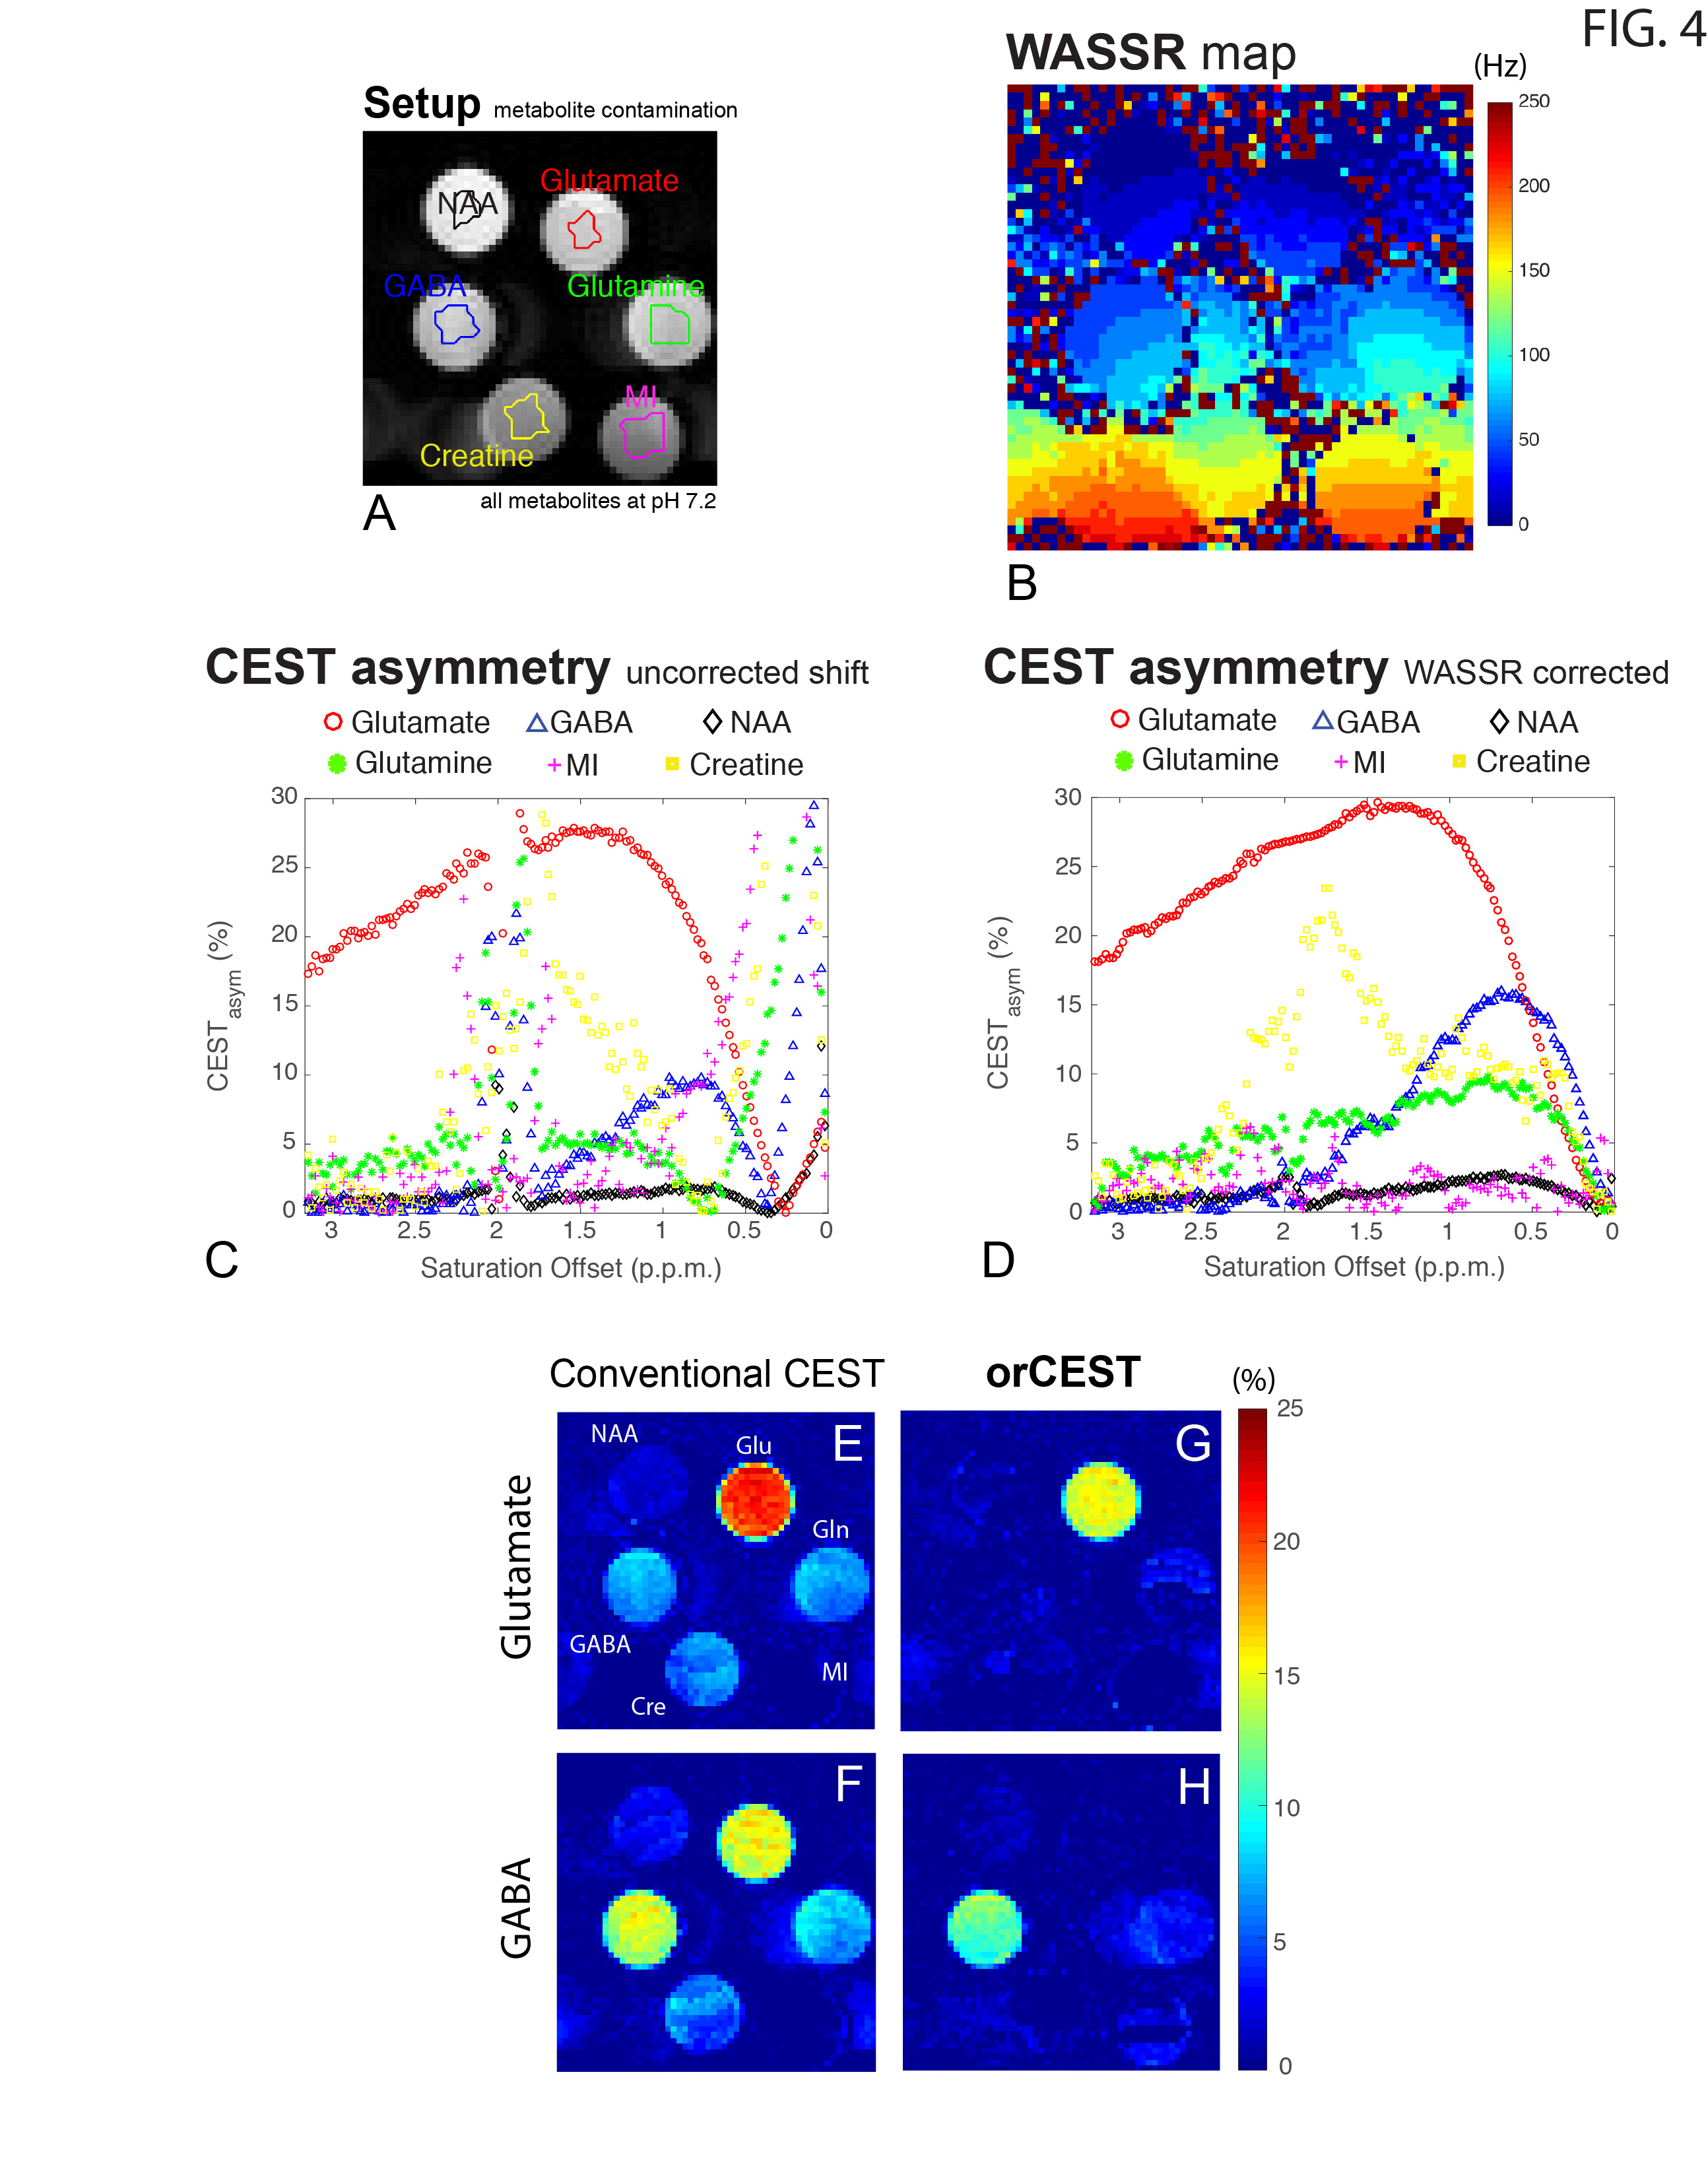
orCEST principles: Figure 1 briefly summarizes how orCEST works: it subtracts two images corresponding to symmetric points in the CESTasym profile to null contributions from an unwanted molecule. In vitro experiments: All experiments performed on a 16.4T Bruker scanner, at 37°C, using a modified HASTE sequence preceded by a CEST module: TR/TE = 15000/15ms, FOV = 9x9 mm, slice thickness = 3 mm, Matrix size = 56x56, number of π-pulses = 33, partial Fourier factor = 1.8, number of averages = 2, with a total scan time per run of 30s. Saturation train: 22 Gaussian pulses, 182ms in duration and 15Hz in width, and applied with 10μT amplitudes and an inter-pulse delay of 5ms. All experiments were acquired in a fully relaxed state (TR > 5T1). GABA/Glutamate orCEST quantification and optimization led to acquiring images at ±1.15 p.p.m./ ±0.35 p.p.m., and ±0.75 p.p.m./ ±2.15 p.p.m., to resolve Glutamate and GABA, respectively. In vivo experiments: Long-Evans male rats (n=3) were anesthetized with isofluorane and placed in a 9.4T Bruker scanner. Half-Fourier Acquisition Single-shot Turbo spin Echo imaging (HASTE): TR/TE = 10000/40ms, FOV =26x35mm, slice thickness = 2mm, Matrix size = 130x175, number of π-pulses = 55, partial Fourier factor = 1.8, number of averages = 2, with a total scan time per run of 20s. All experiments were acquired in a fully relaxed state (TR > 5T1). Saturation consisted of a train of 22 Gaussian pulses, 182ms/15Hz, 10μT, with an interpulse delay of 5ms. All experiments were preapproved by the local animal ethics committee operating under local and EU laws. Data analysis: Acquired data was processed in Matlab, using custom written code. All images were corrected for B1 (double angle ratio method5) and B0 (WASSR6) inhomogeneities.Results
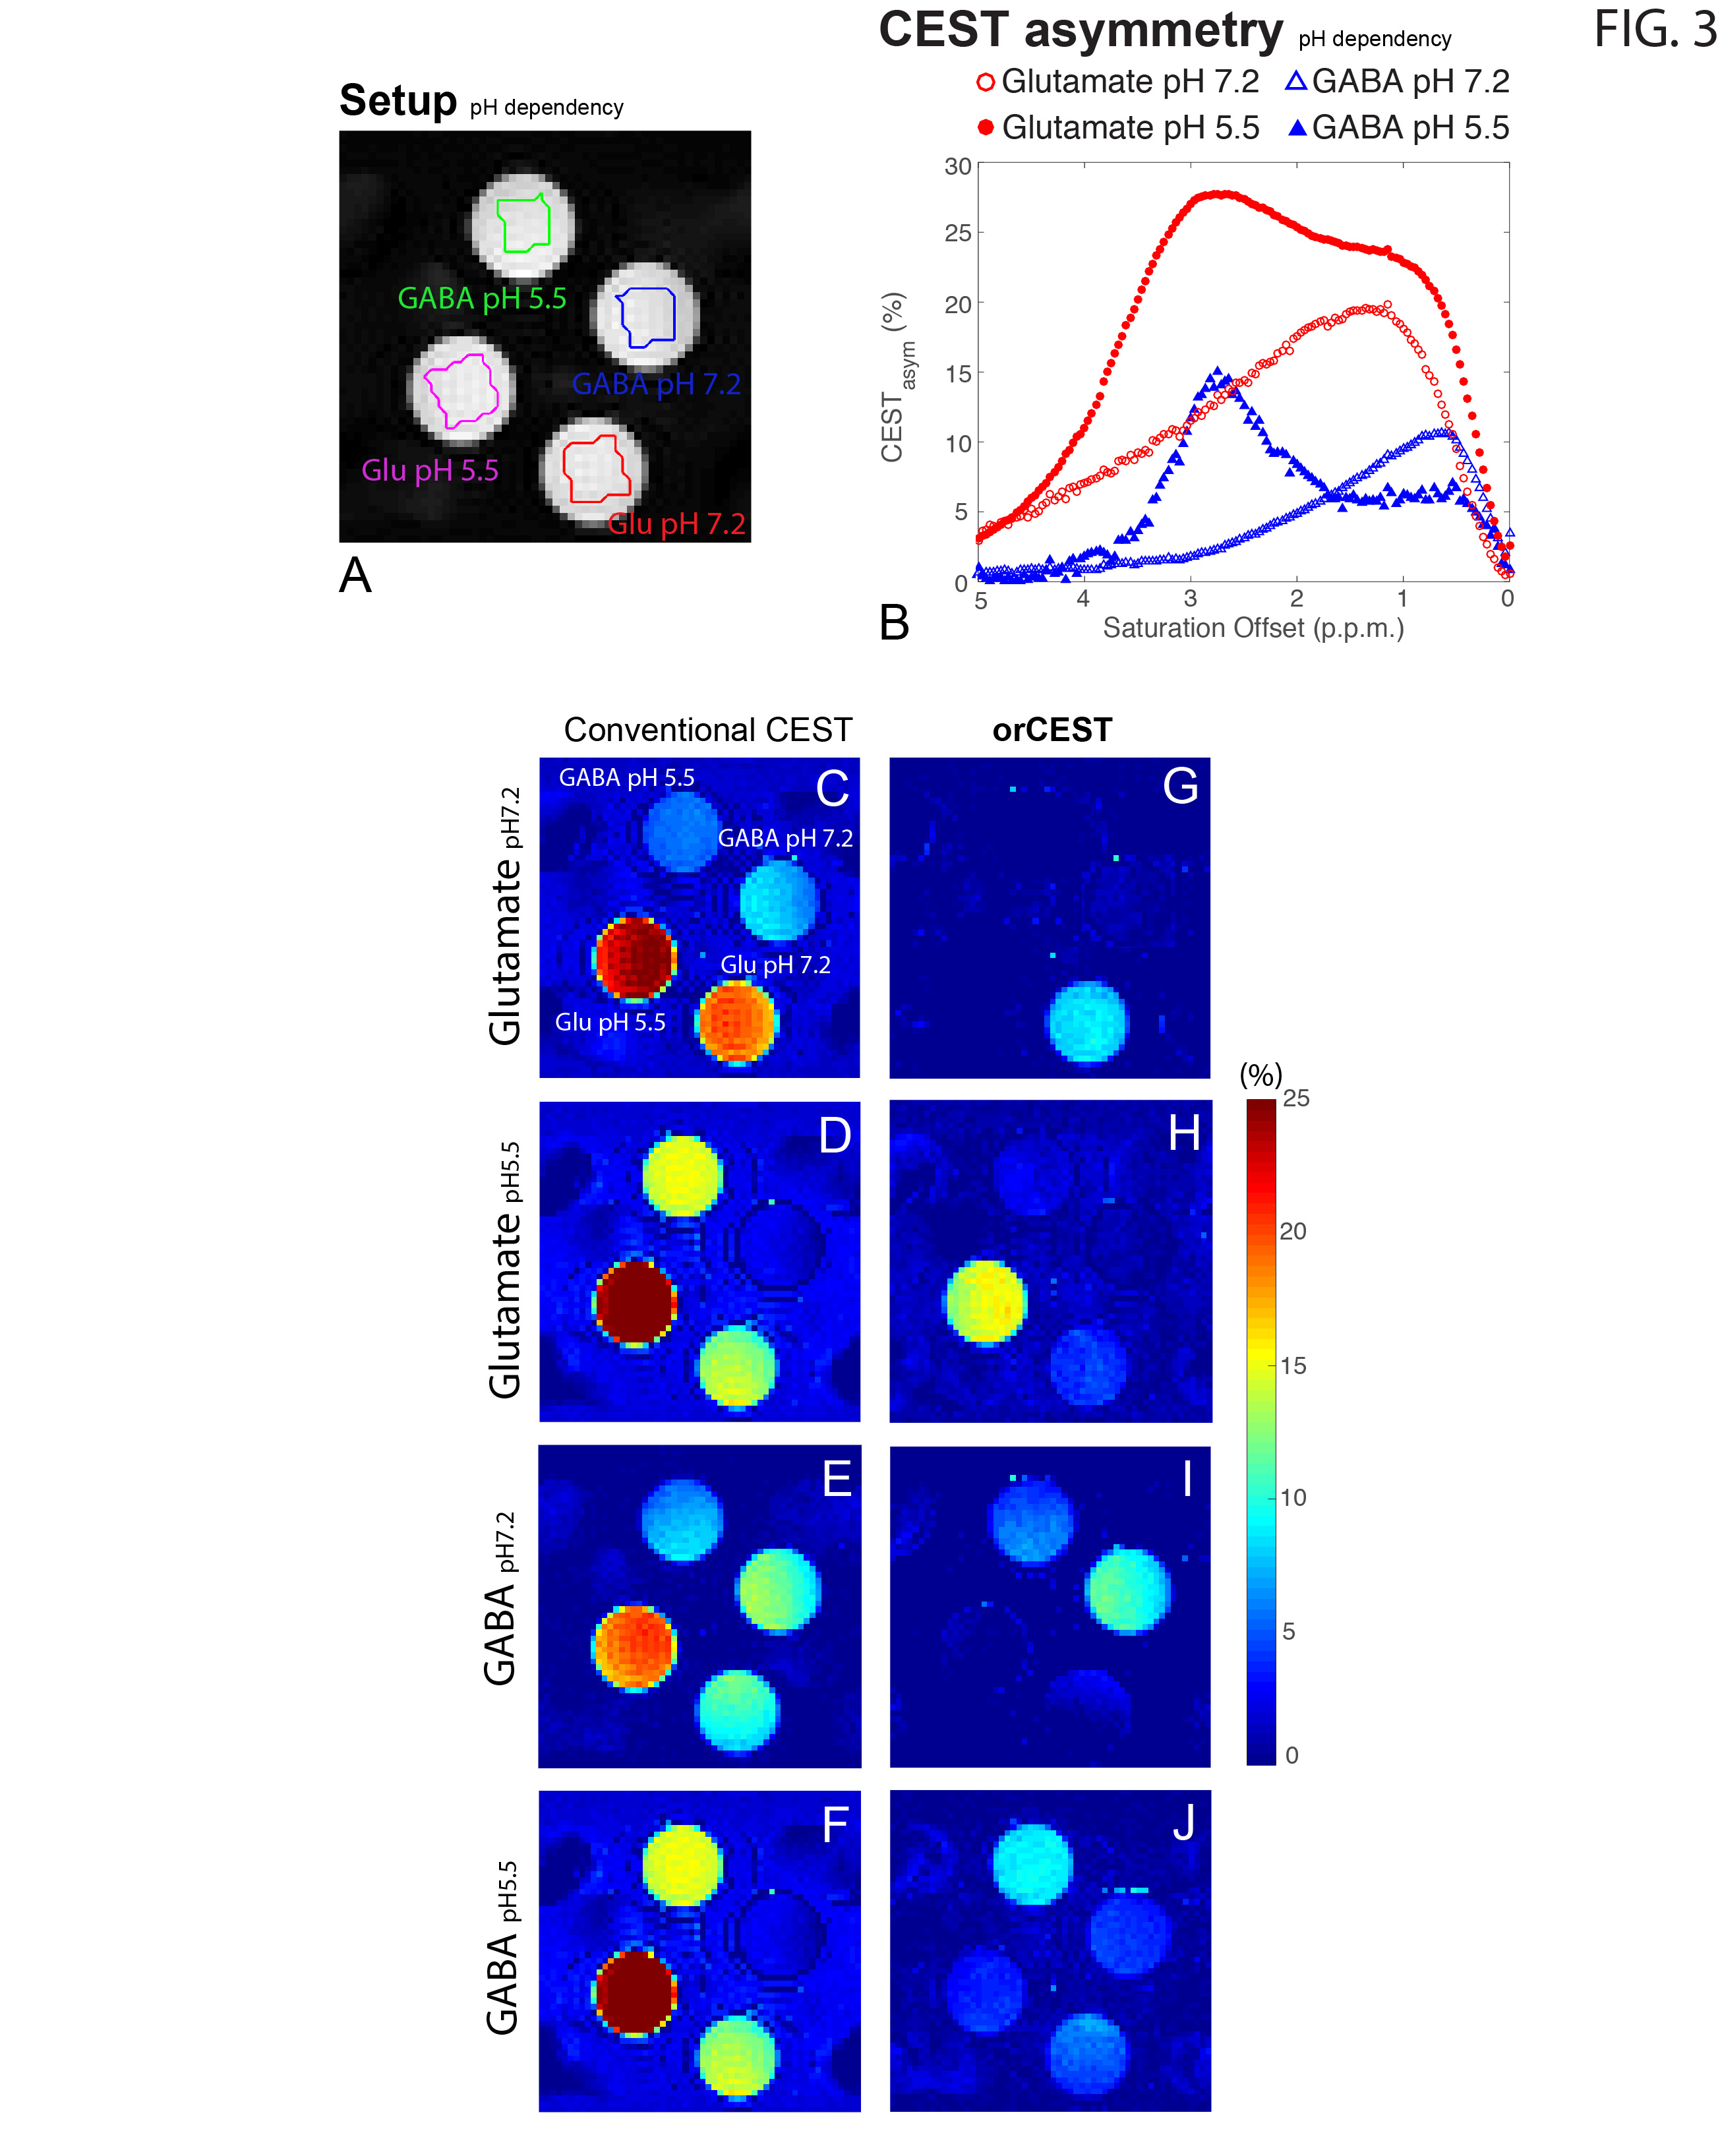
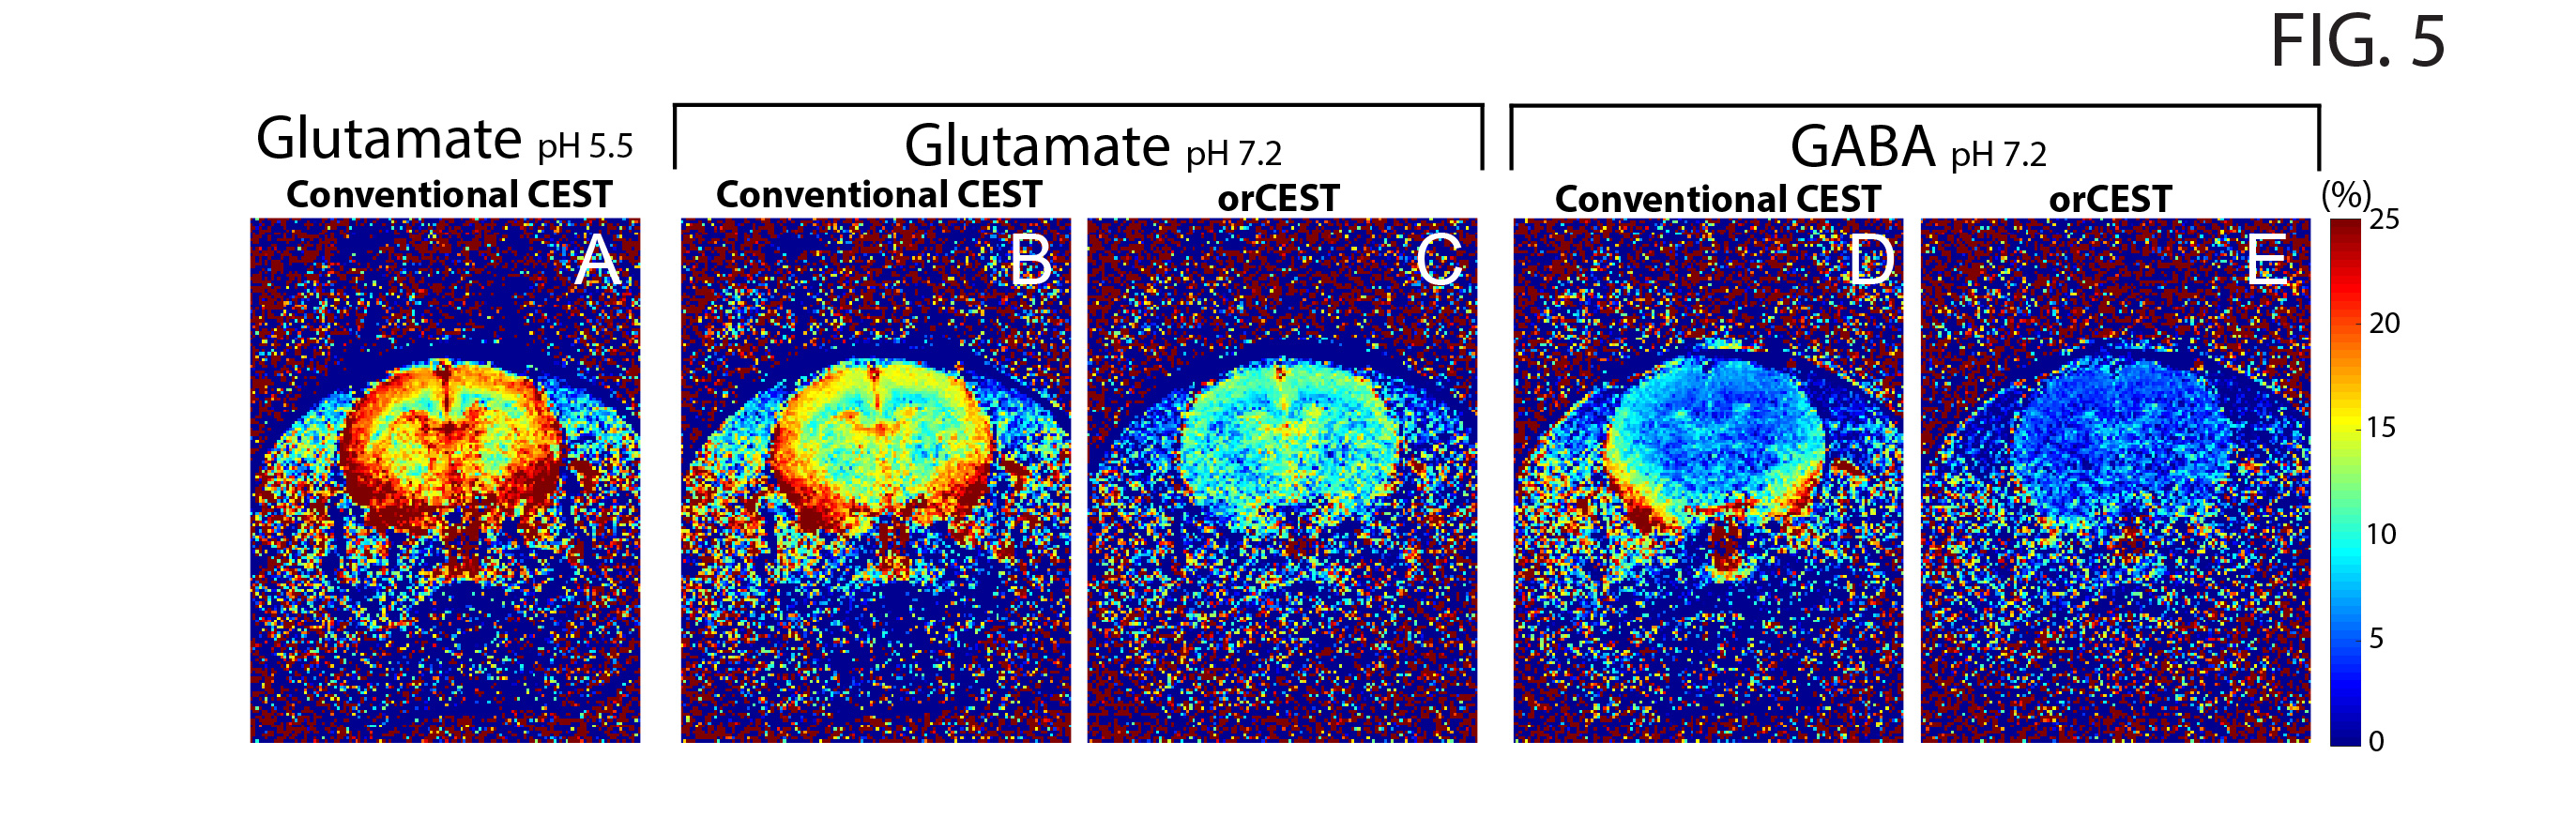
Figure 2 shows the sample setup [Fig 2A], z-spectra [Fig 2B], CESTasym profiles [Fig 2C], quality of image upon saturation [Fig 2D-K] and corresponding maps for Glutamate and GABA [Fig 2L-O]. The orCEST contrast clearly retains specificity while conventional gluCEST (as well as GABACEST) contrasts show significant contributions from the other (unwanted) molecule. Figure 3 shows pH dependence for the different methods. While gluCEST and gabaCEST are contaminated by signals originating from all pH values, Glutamate orCEST can be tailored to be specific to pH. GABA orCEST is not contaminated by Glutamate, but cannot discriminate the different pH values well due to the very similar spectral profiles at both pH values. Figure 4 shows the importance of executing WASSR correction, following which orCEST can be used to map Glutamate and GABA with very high specificity vis-à-vis the brain’s most prominent metabolites. Finally, Figure 5 shows the ensuing contrasts in the in-vivo rat brain. Excellent fidelity of the maps is noted, and high reproducibility was achieved.Discussion
GluCEST seems to be contaminated to a certain extent with other molecules, and perhaps more crucially in the context of brain, with Glutamate’s inhibitory counterpart, GABA. Here, we have optimized the orCEST contrast such that it much more specifically contrasts each metabolite, and furthermore, can even distinguish different pH populations of Glutamate, which can be important both in the context of disease and in the context of synaptic/vesicular Glutamate populations, which reside at different pH. orCEST’s specificity enhancement is not without limitations, and it comes at the price of more demanding acquisitions (at least 4 images per metabolite as compared to 2 for gluCEST) and a slightly reduced sensitivity due to the subtractions; but the specificity enhancement seems to be quite worthwhile nevertheless. Since many diseases may involve imbalances in glutamate and GABA, orCEST is promising for future applications in preclinical and clinical settings.Conclusion
The orCEST approach was optimized towards in-vivo mapping, and was found to be capable of enhancing the specificity of CEST with minimal sensitivity losses.Acknowledgements
This study was supported by funding from the European Research Council (ERC) under the European Union’s Horizon 2020 research and innovation programme (Starting Grant, agreement No. 679058).References
1 Cai K, Haris M, Singh A, Kogan F, Greenberg JH, Hariharan H et al. Magnetic resonance imaging of glutamate. Nat Med 2012; 18: 302–306.
2 Agarwal N, Renshaw PF. Proton MR spectroscopy - Detectable major neurotransmitters of the brain: Biology and possible clinical applications. Am. J. Neuroradiol. 2012; 33: 595–602.
3 Petroff OAC. GABA and glutamate in the human brain. Neuroscientist 2002; 8: 562–573.
4 Severo F, Shemesh N. Overlap-resolved cest (orCEST) MRI: imaging gaba and glutamate at 16.4T. In: International Society for Magnetic Resonance in Medicine. Honolulu, HI, USA, 2017.
5 Cunningham CH, Pauly JM, Nayak KS. Saturated double-angle method for rapid B1+ mapping. Magn Reson Med 2006; 55: 1326–1333.
6 Kim M, Gillen J, Landman BA, Zhou J, Van Zijl PCM. Water saturation shift referencing (WASSR) for chemical exchange saturation transfer (CEST) experiments. Magn Reson Med 2009; 61: 1441–1450.
Figures