5127
In-vivo Z-spectra acquisition with decreased direct saturation using adiabatic spin-lock pulses at 9.4T1Magnetic Resonance Center, Max Planck Institute for Biological Cybernetics, Tuebingen, Germany, 2Department of Biomedical Magnetic Resonance, University of Tübingen, Tuebingen, Germany
Synopsis
Off-resonant spin-lock imaging enables a lot of possibilities for T1ρ and chemical exchange (CE) sensitive applications. For this purpose, a matching amplitude of the tipping and the locking pulse is required, which can be difficult due to the high power requirements of adiabatic pulses. In this work, we present a newly shaped adiabatic half-passage pulse, usable at low power to match the amplitude of the pulses. Off- and on-resonant saturated images acquired at 9.4T are shown. The new pulse shape is able to generate robust images with comparatively low power at ultra-high-field strengths.
Introduction
In previous work it was shown, that hyperbolic secant (HS) adiabatic spin-lock (SL) pulses are a very useful tool to investigate chemical exchange (CE) processes at ultra-high field (UHF), at either on-resonant 1 or off-resonant frequencies 2. Despite these promising results and the fact that SL pulses are in principle robust against B1 inhomogeneity, they have still some disadvantages. First, HS pulses need very high power for robust results, which can be difficult in terms of SAR and hardware limitations, especially at UHF. In addition, efficient labeling of CE effects requires a low amplitude for various metabolites. Second, an amplitude difference between the tipping and locking pulses makes the images prone to B0 artifacts and prohibits off-resonant imaging. Therefore, in this work we aim to design a pulse that shows adiabatic behavior with low power, to match the amplitude of the tipping and locking pulses.Methods
To get more freedom in the pulse design, we introduce a Blackman-windowed HS amplitude modulation in combination with a weighted exponential frequency modulation (HSExp). The pulse shape is thus defined by the bandwidth (BW), maximum amplitude (B1,max), pulse duration (tp), length of the Blackman window (twindow) and the dimensionless scaling factor µ. In order to find the most stable pulse, a Bloch-Simulation was used to simulate Z-spectra at different levels of B0 and B1 inhomogeneity, as well as varying pulse shape parameters. Fixed parameters were B1,max = 5 µT and tp = 8 ms. The optimized shape was then used to acquire images in a glucose phantom and two healthy volunteers at 9.4T (Siemens MAGNETOM) using a 16Tx/31Rx channel head coil 3. SL prepared Imaging consists of a SL saturation pulse followed by a single shot 3D GRE readout 4 (FA=5°, TE=1.96 ms, TR=3.86 ms, Grappa=3, elliptical scanning, resolution 1.5x1.5x2 mm3). Z-spectra were acquired with the HSExp pulse and with a Gaussian saturation pulse for comparison. For the phantom, 96 offsets between ±4.5 ppm were acquired with a locking duration tlock = 35 ms. In-vivo, 92 offsets between ±3 ppm were acquired with tlock=50 ms. Since the actual B1 is reduced through inhomogeneity, B1,max was set to 6.5 µT to achieve a mean B1 of 5 µT in the FOV.Results
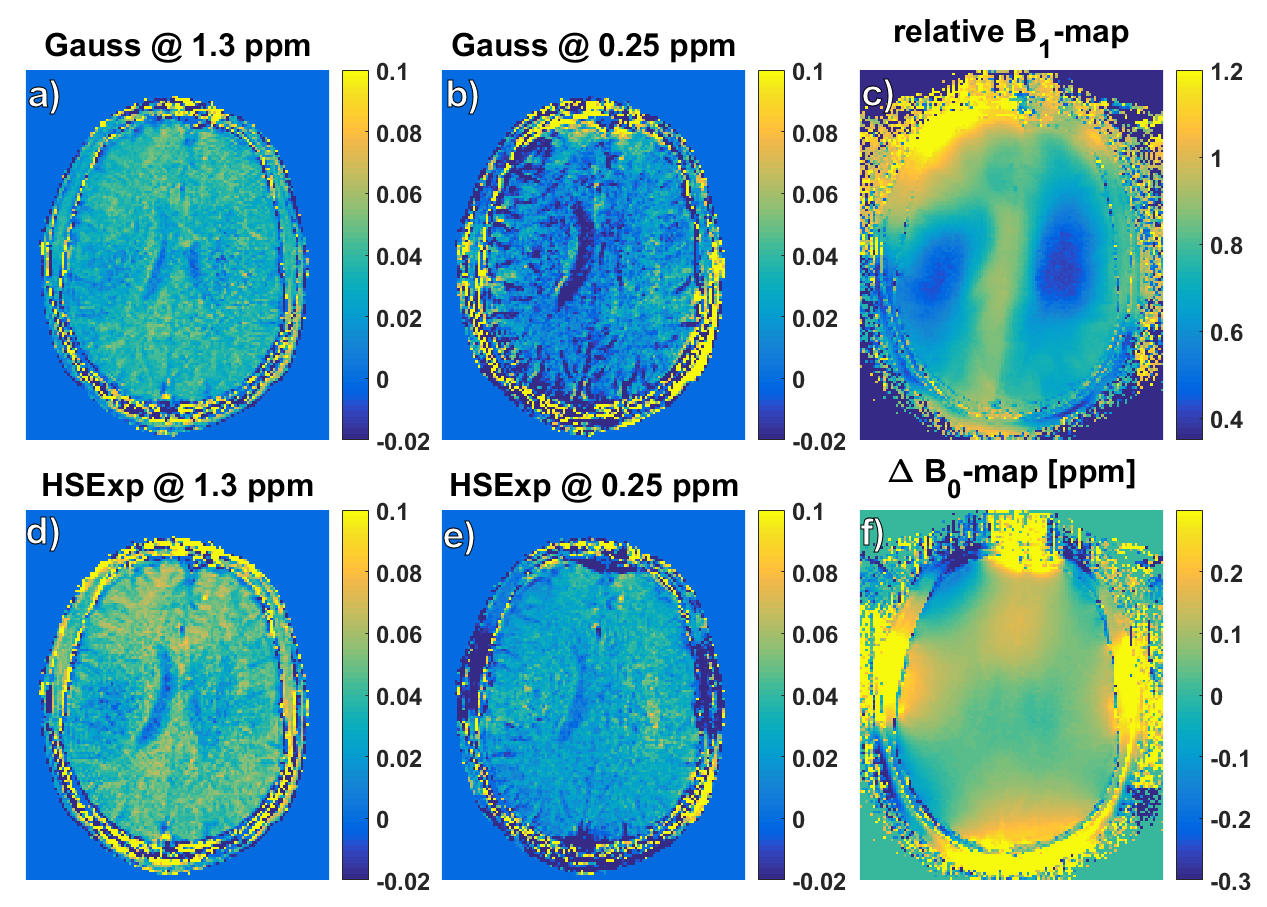
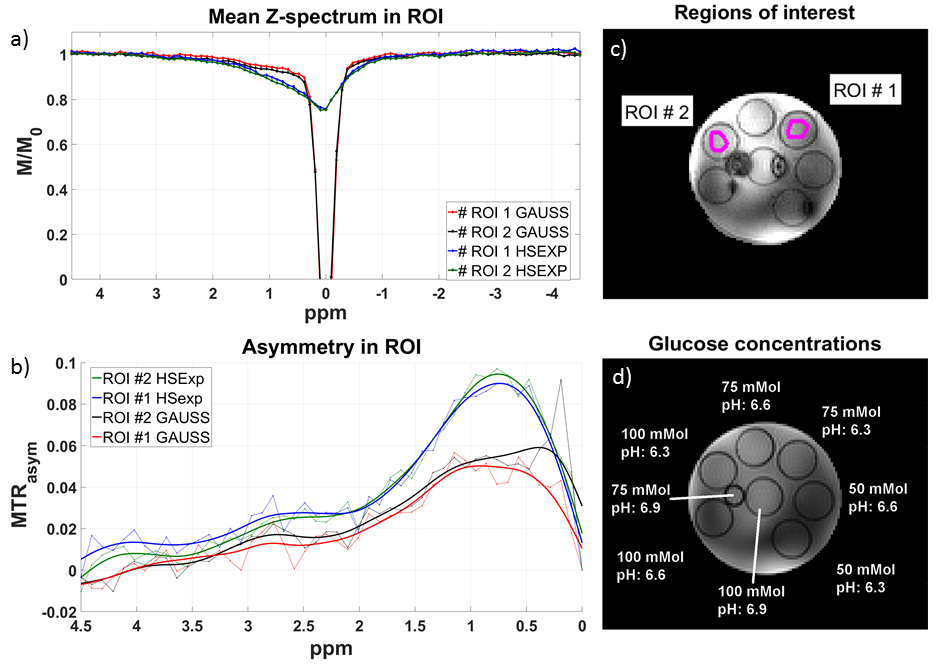
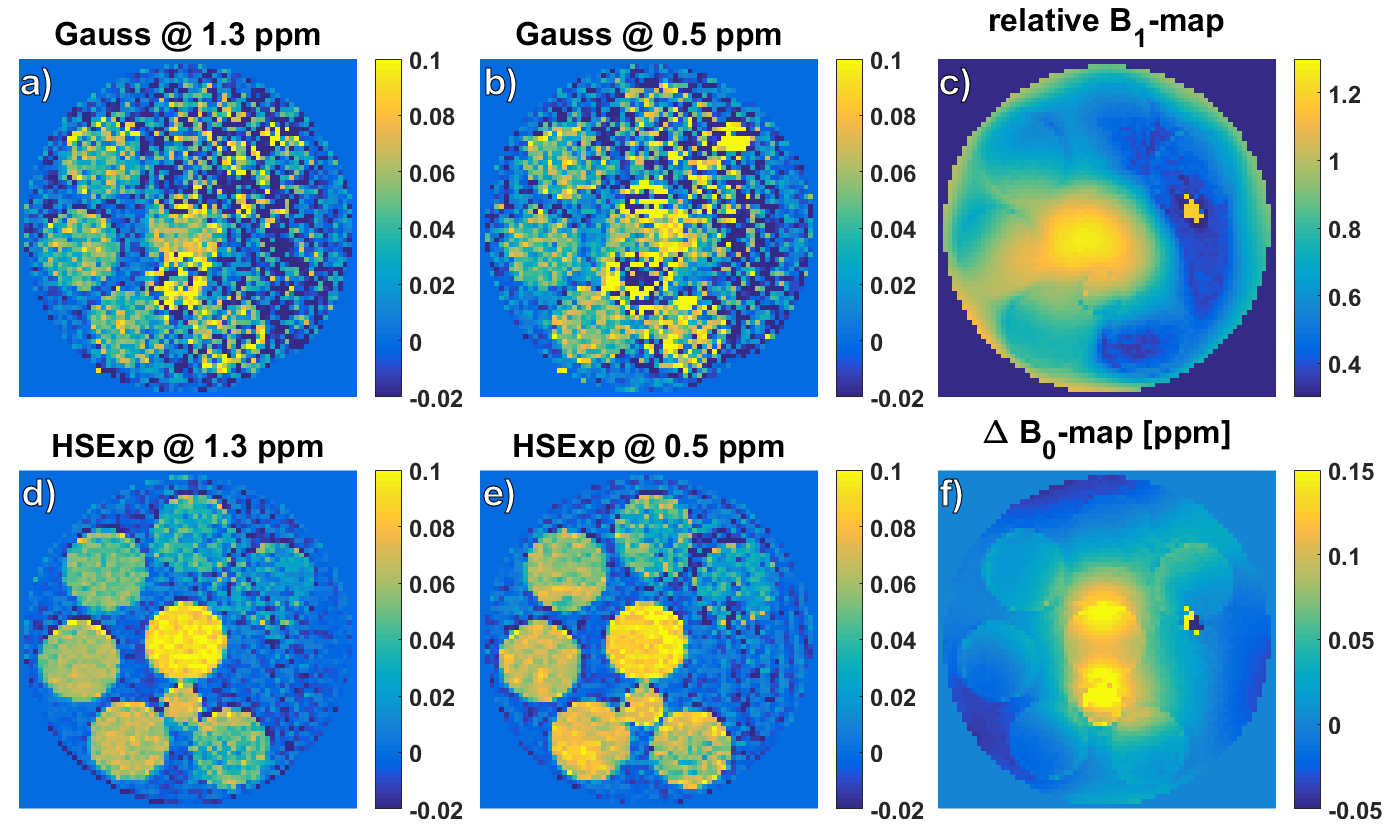
The best pulse found by simulation is defined by the following parameters: BW: 3000 Hz, µ: 45, and twindow: 2.5 ms. The amplitude of the rectangular locking pulse is set to the B1,max of the tipping pulse. The Z-spectra calculated from the HSExp prepared images show a smooth transition from off- to on-resonance without apparent oscillation artifacts (Figure 1). The solution with the higher glucose concentration shows a slightly higher asymmetry with both pulses. In addition, MTRasym images show a stronger contrast (Figure 2) with HSExp than Gauss pulses. However, B1 inhomogeneity can still cause oscillation artifacts at frequency offsets close to the Larmor frequency. The in-vivo Z-spectra show a similar behavior as in the phantom. Again, the transition from off- to on-resonant sample points is smooth with the HSExp pulse. However, they are broader in general since the saturation is sensitive to T2 and MT effects. (Figure 3). Both pulses show clear correlation between the contrast and the B1 amplitude (Figure 4). Images acquired with HSExp show only slight B0 artifacts in regions with very high inhomogeneity.Discussion
An amplitude matched HS pulse for T1ρ measurements has been used in the past 5. Although off-resonant SL imaging was shown in these studies, the applied B1 amplitude was very high. The proposed HSExp prepared images show a robust contrast, for both on- and off-resonant frequencies with a lower B1 amplitude. Thus, in the presence of a very strong B1 inhomogeneity, slight oscillation artifacts appear due to the extreme amplitude decrease. However, B1,max of the pulse could be increased if the ROI lies in such a region, to overcome this problem. Dynamic glucose enhanced imaging (DGE) is another field of application for SL pulses 6. The presented HSExp pulse adds the possibility of off-resonant imaging to DGE applications. A potential clinical benefit of this method must be investigated in the future.Conclusion
By introducing a new pulse shape, we were able to generate a SL prepared contrast with low power and a matching tipping and locking amplitude. Since these pulses can be used for off-and on-resonant SL imaging, there are other possible applications besides the presented Z-spectrum acquisition, e.g. off-resonant T1ρ-mapping or dynamic glucose enhanced imaging. It could be shown that efficient glucose labeling is possible in a phantom. This is currently under investigation in-vivo.Acknowledgements
The financial support of the Max Planck Society, German Research Foundation (DFG, grant ZA 814/2-1, support to M.Z.), and European Union’s Horizon 2020 research and innovation programme (Grant Agreement No. 667510, support to M.Z.) is gratefully acknowledged.References
[1] SCHUENKE, Patrick et al. Adiabatically prepared spin‐lock approach for T1ρ‐based dynamic glucose enhanced MRI at ultrahigh fields. Mag Reson Med 2017; 78 (1): 215-225.
[2] JIN, Tao et al. Advantages of chemical exchange‐sensitive spin‐lock (CESL) over chemical exchange saturation transfer (CEST) for hydroxyl–and amine–water proton exchange studies. NMR in Biomed 2014; 27(11): 1313-1324.
[3] GUNAMONY, Shajan et al. A 16‐channel dual‐row transmit array in combination with a 31‐element receive array for human brain imaging at 9.4 T. Mag Reson Med 2014; 71(2): 870-879.
[4] ZAISS, Moritz et. al. snapCEST – A single-shot 3D CEST sequence for motion corrected CEST MRI. In Proceedings of 25th Annual Meeting of ISMRM 2017, 3768.
[5] GRÖHN, Olli HJ et al. On‐and off‐resonance T1ρ MRI in acute cerebral ischemia of the rat. Mag Reson Med 2003; 49(1): 172-176.
[6] SCHUENKE, Patrick et al. Fast and Quantitative T1ρ-weighted Dynamic Glucose Enhanced MRI. Scientific Reports 2017; 7:42093.
Figures
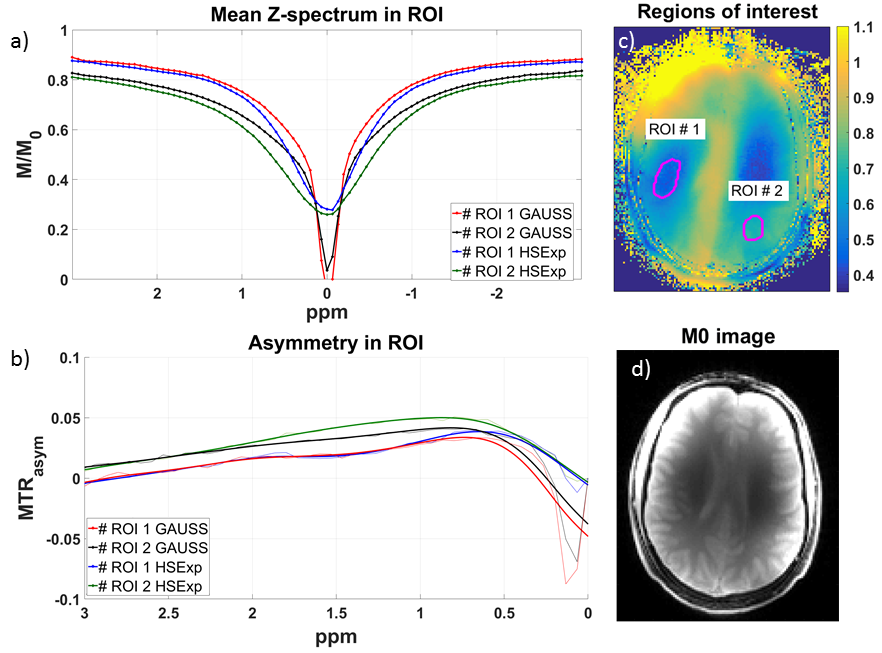
In-vivo Z-Spectra (a) and MTRasym (b) in two ROI (c) and M0 image (d). B1.max for HSExp and B1.cwpe of the Gaussian pulse was 6.5 µT. The HSExp pulse shows a smooth transition towards the resonance frequency. Also, the asymmetry in the ROI close to the Larmor frequency is more stable with HSExp pulse.