5126
Improved quantification of amide proton transfer effect with direct water saturation- and magnetization transfer-correction in a glioma rat model at 3 Tesla1Paul C. Lauterbur Research Center for Biomedical Imaging, Shenzhen Institutes of Advanced Technology, Chinese Academy of Sciences, Shenzhen, China, 2Department of Neurosurgery, Cancer Center, Sun Yat-Sen University, Guangzhou, China, 3Athinoula A. Martinos Center for Biomedical Imaging, Department of Radiology, Massachusetts General Hospital and Harvard Medical School, Charlestown, MA, United States
Synopsis
Quantification of in vivo APT effect with routine asymmetry analysis is problematic due to concomitant contributions. Herein, a steady-state CEST signal solution was utilized to estimate direct water saturation (DWS) to improve Z-spectral quantification in a pulsed-RF CEST imaging. Specifically, APT effect was measured from the DWS and magnetization transfer (MT)-corrected CEST signals in glioma rat brains post-chemoradiotherapy at 3 Tesla. The proposed method revealed significant APT signal difference among regions of control (3.13±0.38%), necrosis (3.95±0.31%) and tumor (4.56±0.34%), consistent with histological observations and superior than routine asymmetry analysis.
Introduction
Amide proton transfer (APT) MRI has been increasingly adopted for glioma imaging [1-3]. However, routine asymmetry analysis (MTRasym) is susceptible to concomitant contributions, including magnetization transfer (MT) and nuclear overhauser effect (NOE), and provides limited tissue characterization [4]. Recently, an analytical solution was developed to describe steady-state continuous wave (CW) chemical exchange saturation transfer (CEST) signal [5]. This study extended this approach to in vivo pulsed-RF APT imaging and evaluated a glioma rat model post-chemoradiotherapy at 3 Tesla.Materials and methods
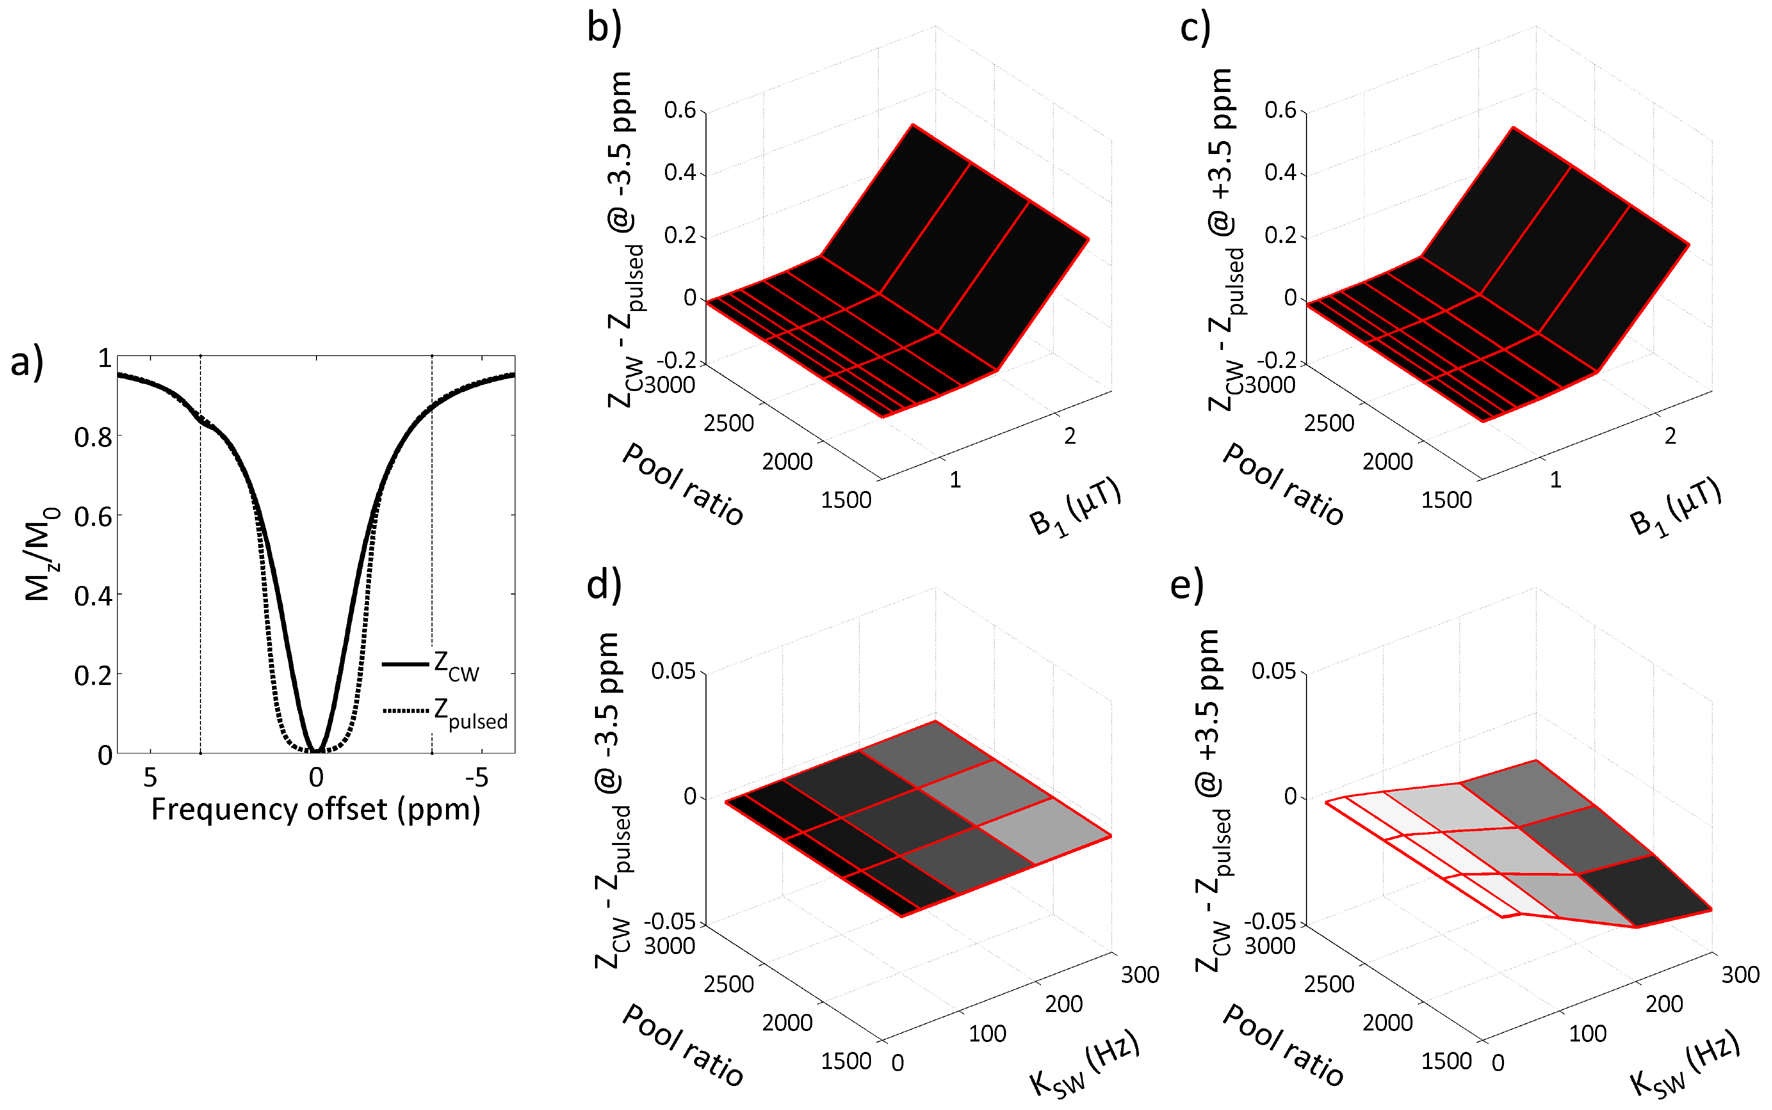
Numerical simulation: Z-spectra of CW- and pulsed-RF CEST imaging were simulated with two-pool Bloch-McConnell equations, assuming the labile solute resonating at 3.5 ppm downfield from water. For pulsed-CEST imaging, repetitive Gaussian inversion pulses was used with Ts of 2.4 s, duty cycle of 50% and durations of 5-25 ms (corresponding to powers of 2.3-0.5 μT) [6]. Common simulation parameters were T1s = 0.77 s, T2s = 33 ms, T1w = 1.2 s and T2w = 80 ms. For each RF power, CW- and pulsed-RF CEST signals at ±3.5 ppm were compared for varied water-solute pool ratios (1500-3000:1) and exchange rates from solute to water (KSW=25-300 Hz), respectively.
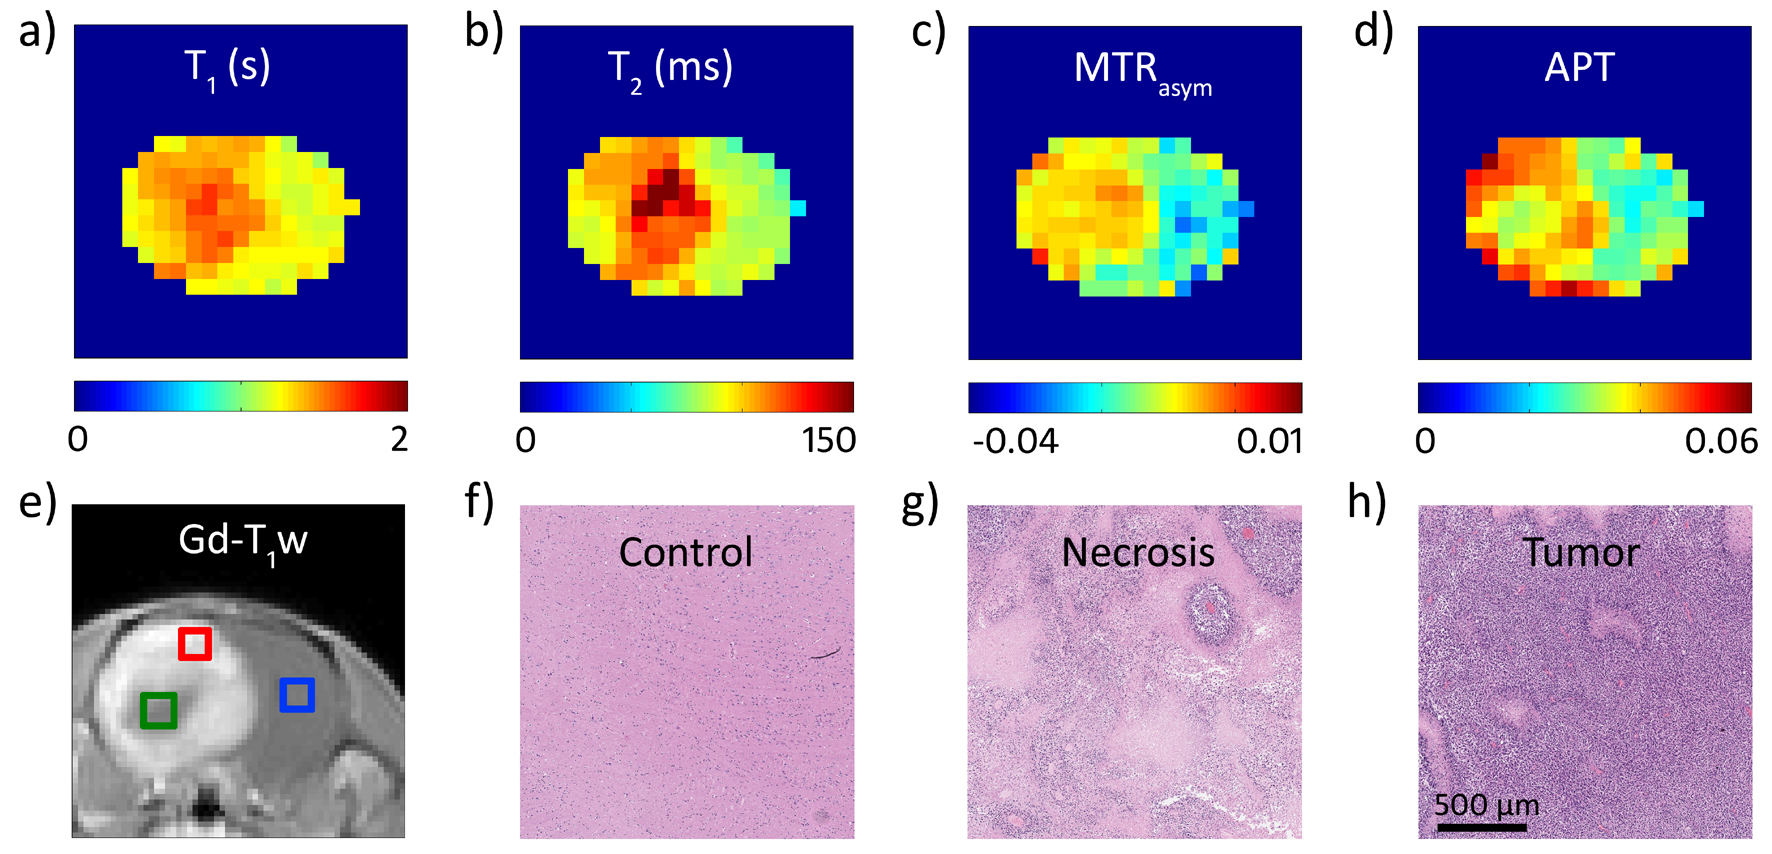
Animal MR study: C6 glioma-bearing adult SD rats (N=7) underwent radiation therapy (24 Gy) and a chemotherapy course with i.p. injection of temozolomide (50 mg/kg) for 5 consecutive days. MRI data were acquired three days after the chemoradiotherapy on a 3 Tesla scanner. Single-slice transverse multi-parametric MR imaging was conducted, including T1 (TR/TE=8000/6.5 ms, flip angle=180°, IR=200, 500, 800, 1100 and 1400 ms), T2 (TR=5000 ms, 15 echoes from 9.9-148.5 ms with steps of 9.9 ms), pulsed-RF APT MRI (TR/TE=8.0/3.8 ms, average B1=1.0 μT, 80 RF pulses with duration=15 ms, DC=50%, Ts/Tr=2.4/2.0 s, frequency offsets between ±6 ppm with steps of 0.25 ppm), and Gd-enhanced T1w MRI (TR/TE=350/3.5 ms). Finally, the brains were stained with H & E histology.
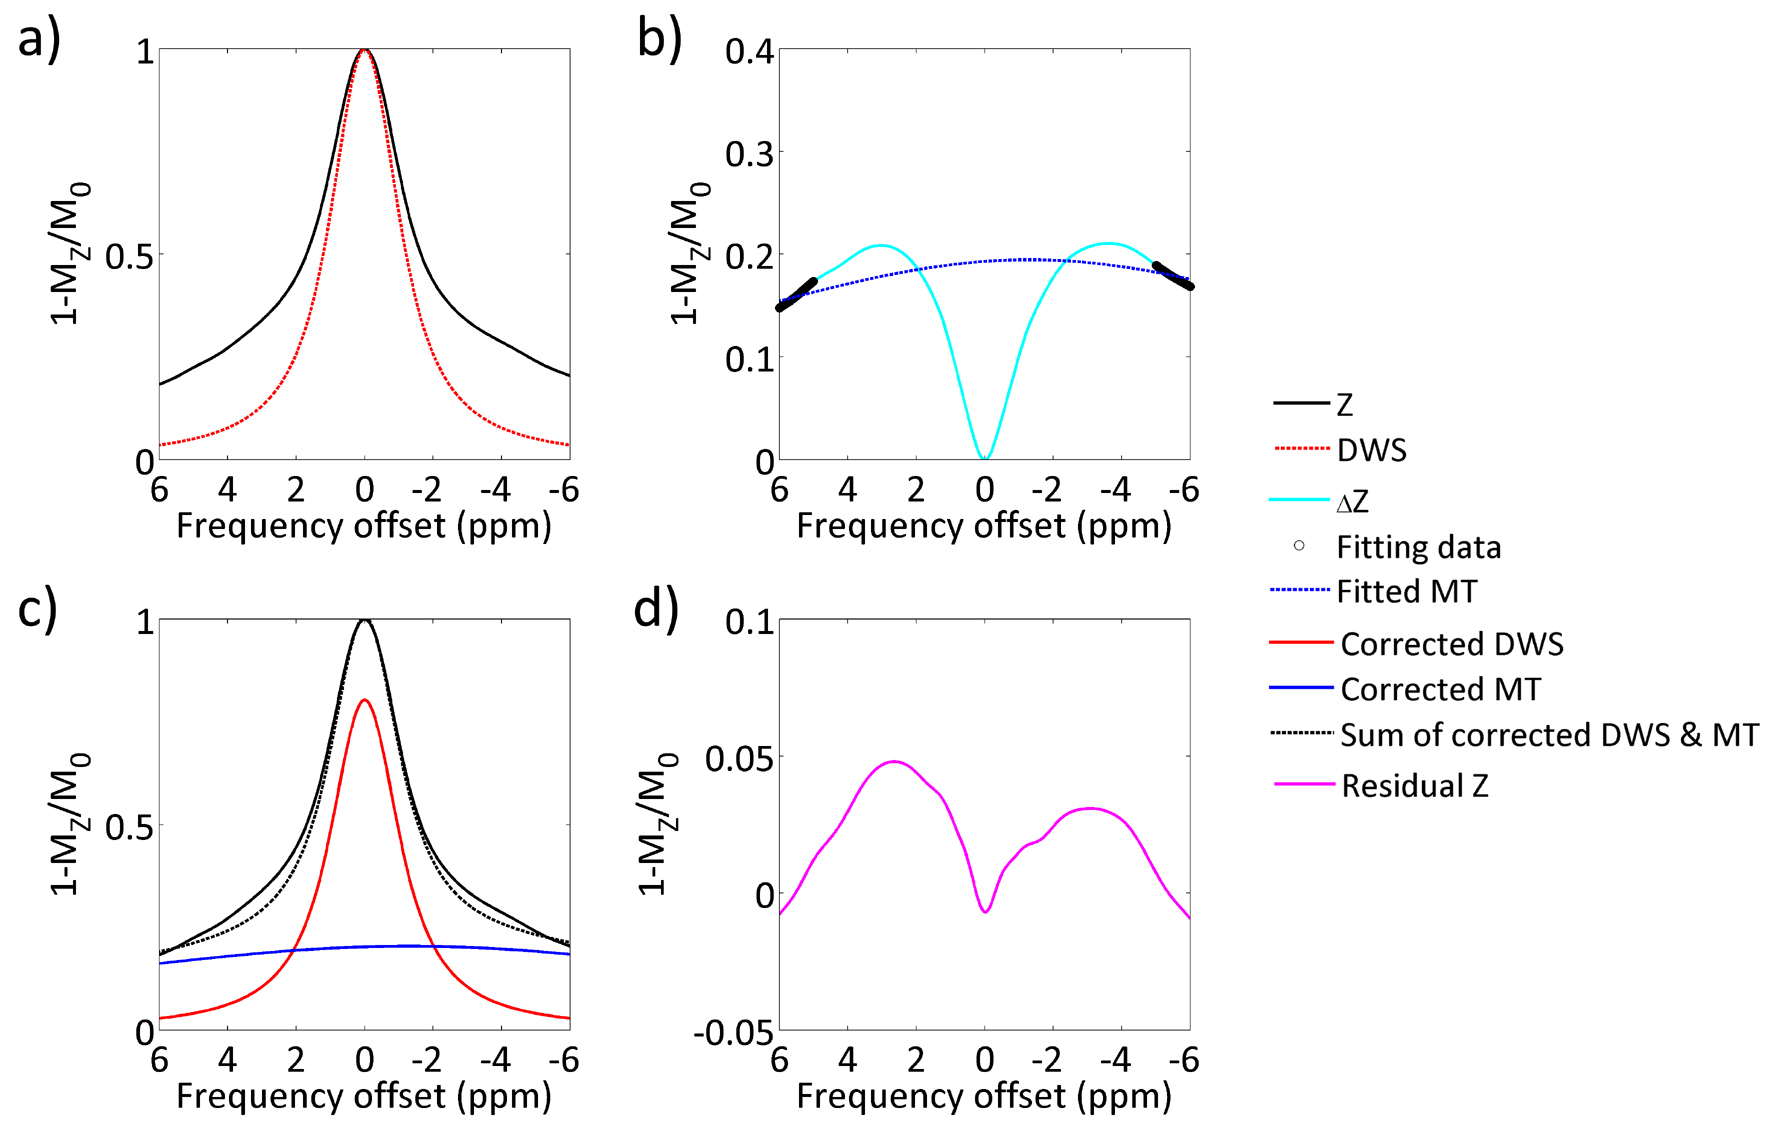
Data analysis: T1 and T2 maps were obtained from equations of I(i)=I0(1-(1-η)e-TIi/T1) and I(i)=I0e-TEi/T2, respectively, where η is the inversion efficiency, TIi is the ith inversion time and TEi is the ith echo time. Normalized Z-spectra was corrected for B0 inhomogeneity. DWS was estimated as Z'=Msat(R1ρ,TR,FA,Ts,B1)/M0(TR,FA)=[(1-e-Tr·R1w)·e-R1ρ·Ts+R1wcos2θ·(1-e-R1ρ·Ts)/R1ρ]·(1-cos(FA)·e-TR·R1w)/[1-cos(FA)·e-Tr·R1w·e-R1ρ·Ts]/(1-e-TR·R1w), where, R1ρ=R1wcos2θ+R2wsin2θ, FA is the image excitation flip angle, R1,2w are the bulk water longitudinal and transverse relaxation rates. θ=tan-1(ω1/Δω), where ω1 and Δω are the RF power and frequency offset. MT effect was determined by Lorentzian fitting of ΔZ=Z’-Z with excluding data points between -5 and 5 ppm to avoid possible APT ad NOE contributions. The obtained DWS and MT were further corrected by fitting their weighted sum to the acquired Z-spectrum at frequency offsets of ±6 to ±5 ppm and -0.5 to 0.5 ppm where the two effects were dominant. Then, APT was quantified by removing the corrected DWS and MT from the measured CEST signals at 3.5 ppm (Fig. 1). MTRasym were calculated as MTRasym=Z(-3.5)-Z(3.5). APT and MTRasym were measured in regions of tumor, necrosis and contralateral control determined from Gd-enhanced images. One-way ANOVA with Bonferroni correction was applied with P<0.05 considered statistically significant.
Results
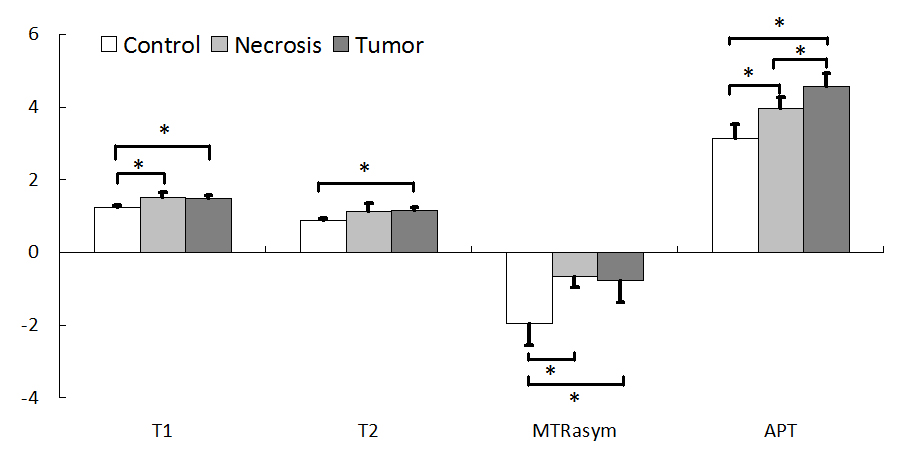
Signal differences at ±3.5 ppm were relatively stable for varied pool ratios under the same B1 or KSW between the CW and pulsed-RF irradiation schemes (Fig. 2). Figure 3 shows the conventional MTRasym and APT maps obtained from the proposed method in a representative rat. Relatively homogeneously hyperintense of MTRasym was observed in regions containing tumor and necrosis compared to normal brain, whereas, APT obtained with the proposed method was found to significantly increase from control, necrosis to tumor regions. Such regional difference was consistent with pathophysiological observations of hypocellularity and nuclear shrinkage in necrosis region and hypercellularity and nuclear atypia in tumor region. Quantitatively, no significant difference of MTRasym was found between tumor (-0.77±0.60%) and necrosis (-0.67±0.30%) regions, despite they were significantly higher than that in the control region (-1.96±0.60%, P<0.05). On the contrary, significant difference of APT was found among regions of control (3.13±0.38%), necrosis (3.95±0.31%) and tumor (4.56±0.34%) (P<0.05) with the proposed method.Conclusion
We extended a recently proposed quantitative CEST MRI approach for in vivo pulsed-RF APT imaging. The proposed method differentiates tumor, necrosis and normal tissue, superior to the conventional asymmetry analysis, demonstrating that it is promising for improved cancer characterization at clinical magnetic field strength.Acknowledgements
Grant Support: National Basic Research Program of China (2015CB755500), NSFC (81571668), and Shenzhen Science and Technology Program (GJHZ20160229200622417, JCYJ20170307165550864 and JCYJ20170413161350892).References
[1] Zhou J, Lal B, Wilson DA, Laterra J, van Zijl PCM. Amide proton transfer (APT) contrast for imaging of brain tumors. Magn Reson Med. 2003;50:1120-6
[2] Togao O, Yoshiura T, Keupp J, et al. Amide proton transfer imaging of adult diffuse gliomas: correlation with histopathological grades. Neuro Oncol. 2014;16(3):441-8
[3] Sagiyama K, Mashimo T, Togao O, et al. In vivo chemical exchange saturation transfer imaging allows early detection of a therapeutic response in glioblastoma. Proc Natl Acad Sci U S A. 2014;111(12):4542-7
[4] Zhou J, Blakeley JO, Hua J, et al. Practical data acquisition method for human brain tumor amide proton transfer (APT) imaging. Magn Reson Med. 2008;60(4):842-9
[5] Jiang W, Zhou IY, Wen L, Zhou X, Sun PZ. A theoretical analysis of chemical exchange saturation transfer echo planar imaging (CEST-EPI) steady state solution and the CEST sensitivity efficiency-based optimization approach. Contrast Media Mol Imaging. 2016;11(5):415-23
[6] Sun PZ, Benner T, Kumar A, Sorensen AG. Investigation of optimizing and translating pH-sensitive pulsed-chemical exchange saturation transfer (CEST) imaging to a 3T clinical scanner. Magn Reson Med. 2008;60(4):834-41
Figures