5121
In vivo Kinetic CEST MRI of sodium salicylate(NaSA): Comparison of MTRasym and Subtraction of saturation-weighted images1The Johns Hopkins University, Baltimore, MD, United States, 2School of Information and Technology, Northwest University, Xi'an, China, 3Medical Imaging, The First affiliated Hospital of Xian Jiaotong University, Xi'an, China, 4Radiology Department Tongji Hospital, Tongji Medical College, Huazhong University of Science and Technology, Wuhan, China
Synopsis
Salicylate analogues feature chemical shift far from water (Δω = 8-10 ppm), however, there are almost no available reports on their in vivo detection of salicylate upon intravenous administration. We aim to optimize the in vivo detection of NaSA, by comparing compared MTRasym and a Dynamic Salicylate Enhancement (DSE). For the mice brain with LPS-induced inflammation, there are ~4% DSE signal which displays a clear kinetic trend. While MTRasm values are very small, oscillating between -2% to 0% due to the unsymetric MTC. In conclusion, our DSE method is able to track the dynamic signal changes following the infusion of NaSA.
Introduction
In vivo dynamic imaging of non-metalic and biodegradable diaCEST agents are attracting more interest, especially after the FDA announcement of brain deposition of Gd-based agents. For example, a technique called dynamic glucose enhancement (DGE) has shown potential in metabolic imaging of patients with brain tumors2. Salicylate Analogues (SAA), including several common over-the-counter drugs, could be such candidates for in vivo applications3. Despite of the featured chemical shift far from water (Δω = 8-10 ppm), the in vivo detection of salicylate upon intravenous administration needs to be optimized, especially considering the conventional Magnetization Transfer (MT) contrast and few available literatures on this frequency range. Herein, we aim to determine an optimized quantification of NaSA, by comparing MTRasym and a Dynamic Salicylate Enhancement (DSE) method using subtraction of saturation-weighted images at their featured Δω.Materials and Methods
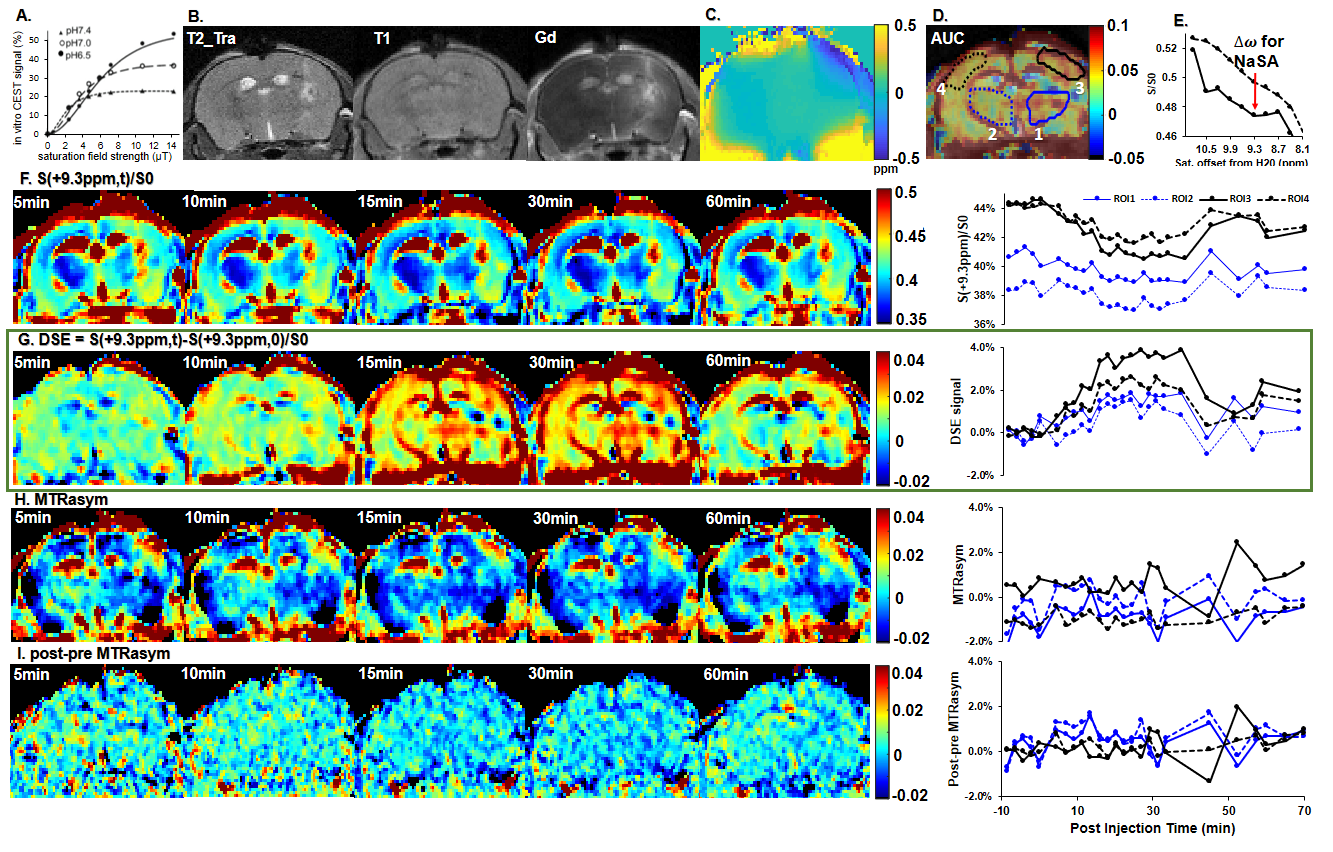
To test the method and prolong salicylate circulating in blood, we used a mouse model with disrupted blood brain barrier (BBB) upon acute inflammatory response to intrastriatial injection of lipopolysaccharide (LPS). Briefly, focal neuroinflammation was induced by a unilateral intrastriatal injection of 10 μg LPS in C57/Bl6 mice (8-10 weeks) using a stereotactic device. 10 μg saline was injected to sham group under the same protocol. 24 hours later, mice underwent MR scans on an 11.7 T horizontal scanner, with tail vein injection of 100 mg/kg sodium salicylate (NaSA) as contrast agents. A single-sliced RARE sequence following a continuous-waved saturation pulse was used to acquire sat. weighted images from pre- to 80 min post-injection of NaSA, with the sat. frequency centered around 9.3 ppm (peak offset frequency for NaSA) and -9.3 ppm for MTRasym calculation. An optimized saturation power of 5.9 μT was chosen because of its high CEST efficiency and quantification stability within the physiological pH range of 6.5-7.22. The traditional MTRasym is formed as MTRasym= (S−Δω−S+Δω)/S0, and the DSE signal at time-point t was quantified as DSE = [S(+9.3ppm,t)-S(+9.3ppm, 0)]/S0. Similar to other dynamic contrast enhancement, images of area under curve (AUC) by adding up DSE images at multiple time points were plotted as a robust representative NaSA-CEST image. At the end of experiments, Gd-enhanced T1-weighted images were collected to verify the BBB status.Results
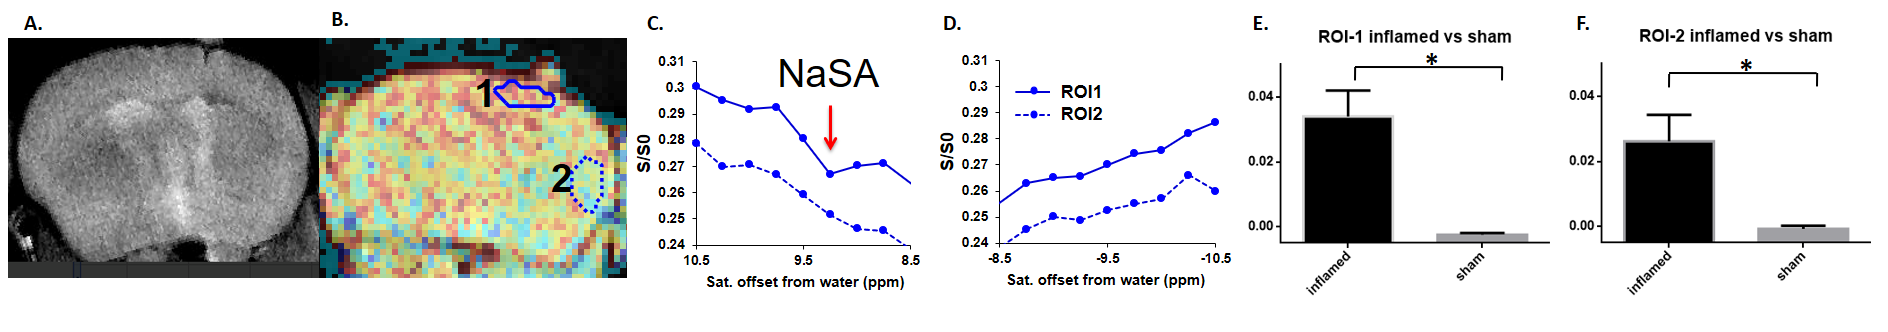
The Gd-enhanced T1-weighted image (Fig.1B) shows the region with opened BBB area near the site of LPS injection. The B0 map is relatively homogenous (Fig.1C). AUC image of 10-30 min post NaSA injection (AUC10-30min) (Fig.1D) could be plotted, clear depicting the enhancement at the right hemisphere similar to previous studies1. We then plotted regions of interest (ROIs) on the enhanced cortex and striatum in the ipsilateral hemisphere and their mirrored contralateral areas, and their averaged DSE signal curve are displayed from pre- until 70 min post-injection of NaSA (Fig.1E). Both the DSE curves and images in all the four ROIs (Fig.1G) suggest the similar signal trend, which first increase from ~10 min post injection and persist until 40 min and decrease afterwards. Thus, the AUC10-30 min post tail vein injection is defined as of NaSA-CEST signal to capture the maximum NaSA distribution. For the sham group, neither the AUC10-30min image nor the SSWI shows clear contrast for the whole brain. Moreover, a partial Z-spectrum collected between 30-40 min shows a noticeable decrease of water signal at the freq. offset of NaSA on ROI3, while no such dip for ROI4 (Fig.1E). Since the major modification of the imaging condition for saturation-weighted images at +9.3ppm (Fig.1F) is the presence of NaSa, the signal difference of pre and post injection is caused mainly by NaSA. However, for the traditional MTRasym method, only a mild variation of cortex contrast can be observed, with the kinetic curve only oscillating in a small range between -2% to 0% (Fig.1H). The negative value may because of the strong asymmetrical effects between MT signal at +9.3 ppm and -9.3 ppm at the applied B1 of 5.9 μT. Due to the subdued contrast on MTRasym images, no meaningful enhancement can be found from the post-pre MTRasym difference images (Fig.1I). Ex vivo CEST Z-spectra further validated that the region near LPS-injection site displays a peak at the NaSA saturation frequency offset (~9.3 ppm, Fig.2C) while no such specific peak at the other part of water frequency (Fig.2D). The DSE signal at ~30 min for the inflamed group (~3-4%) (Fig.2E) and the sham group (~0%) (Fig.2F) further suggest that this method could image the changes in the inflammatory tissue.Conclusions
Our DSE method can robustly track the dynamic signal changes following the infusion of NaSA in a non-invasive way. While the conventional MTRasym brings the unexpected effect from non-symmetric MT and may cause a negative contrast especially when applying a big saturation B1.Acknowledgements
This work is under the support of NIH R21EB020905. I would also like to thank Northwest University, Shaanxi, China for the financial support.References
1Montagne, A., M. Gauberti, R. Macrez, A. Jullienne, A. Briens, J.S. Raynaud, G. Louin, et al., "Ultra-sensitive molecular MRI of cerebrovascular cell activation enables early detection of chronic central nervous system disorders." Neuroimage 63, no. 2 (2012): 760-70, doi:10.1016/j.neuroimage.2012.07.018.
2Song, X., P. Walczak, X. He, X. Yang, M. Pearl, J.W. Bulte, M.G. Pomper, M.T. McMahon, and M. Janowski, "Salicylic acid analogues as chemical exchange saturation transfer MRI contrast agents for the assessment of brain perfusion territory and blood-brain barrier opening after intra-arterial infusion." J Cereb Blood Flow Metab 36, no. 7 (2016): 1186-94, doi:10.1177/0271678X16637882.
3Xu, X., K.W. Chan, L. Knutsson, D. Artemov, J. Xu, G. Liu, Y. Kato, et al., "Dynamic glucose enhanced (DGE) MRI for combined imaging of blood-brain barrier break down and increased blood volume in brain cancer." Magn Reson Med 74, no. 6 (2015): 1556-63, doi:10.1002/mrm.25995.
Figures