5119
Toward Safer Monitoring of Glucose Transport in a Rat Brain Tumor Necrosis using 3-O-Methyl-Glucose Chemical Exchange-sensitive Spin-Lock Magnetic Resonance Imaging1Center for Neuroscience Imaging Research, Institute for Basic Science SKKU, Suwon, Republic of Korea, 2Samsung Advanced Insitute for Health Sciences and Technology, SKKU, Seoul, Republic of Korea, 3Center for Molecular and Cellular Imaging, Samsung Biomedical Research Institute, Seoul, Republic of Korea, 4Radiology, Samsung Medical Center, Sungkyunkwan University School of Medicine, Seoul, Republic of Korea, 5Biomedical Engineering, Sungkyunkwan University, Suwon, Republic of Korea, 6Radiology, University of Pittsburgh, Pittsburgh, PA, United States
Synopsis
Glucose exchange-sensitive spin lock imaging has been shown to have promise in monitoring glucose uptake with reasonable sensitivity. There are design choices that can be made in such an experiment such as whether to use an analog for better sensitivity and how to establish an efficient spin-lock. We examine metabolic uptake of a rat brain tumor with necrosis using 3-O-methyl-glucose, a safer glucose analog than 2DG, and examine differences between using an adiabatic pulse and a paired self-compensated pulse with lower peak power. Both pulses demonstrated delayed uptake in the infarcted tumor region although with higher sensitivity using adiabatic pulses.
INTRODUCTION
Dynamic GlucoCESL has recently been advocated as a promising technology for visualizing the uptake of glucose metabolites in diseases such as cancer1. Inefficient spin lock using simple hard pulses can result in banding artifacts so this technology has been implemented utilizing adiabatic pulses first by Jin et al.2 and later by Schuenke et al.1 Adiabatic pulses although ideal for this experiment require high RF powers to establish the adiabatic condition and may be technically challenging as well as taxing on hardware. Alternatively, Mitrea et al.3 proposed a paired self-compensated spin-lock preparation scheme that may be more approachable with lower RF requirements. We implemented this modified preparatory scheme along with an adiabatic scheme to look at 3-OMG uptake4 (a safer alternative to the metabolizing 2DG and FDG) to examine glucose uptake in a Rat brain tumor with necrosis.MATERIALS AND METHODS
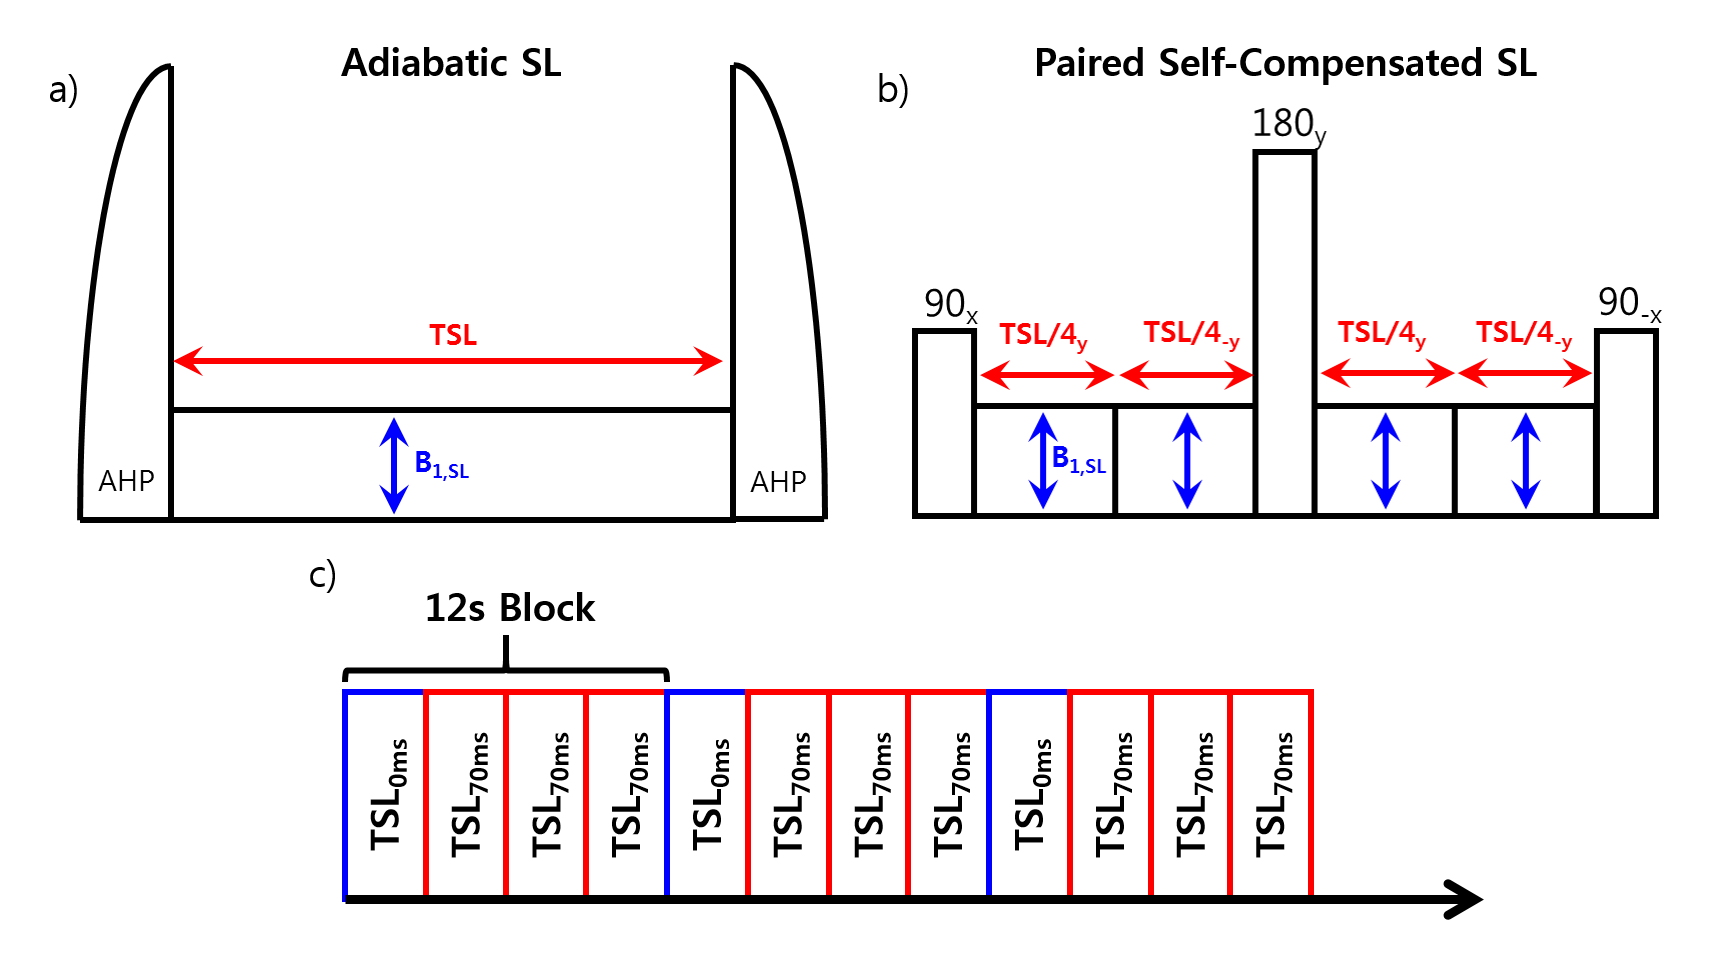
All MR experiments were performed on a Bruker Biospec 7T/20-cm instrument. A volume excitation and 4 channel receiver array coil assembly was used for imaging with a field of view of 40mmx40mm. The chemical exchange-sensitive pulse sequence comprises a spin-lock preparation module for chemical exchange contrast and a spin-echo EPI readout scheme: matrix size=64x64, slice thickness=2mm, TR=3000.0ms and TE=21ms. The spin lock pulse (ω1=250Hz and TSL=70ms) consisted of either an adiabatic scheme using adiabatic half passage pulses (Figure 1a) or a paired self-compensated pulse (Figure 1b) alternating between TSL= 0 ms and three images of TSL = 70 ms (Figure 1c). The paired self-compensated pulse scheme maintained a peak RF power of less than 25% of the adiabatic scheme.
Male Fischer (F-344) rats (250-300g) were inoculated with 1x10⁵/5μL of a C6/lacZ tumor cell line in the right striatal hemisphere and imaging was performed 12 weeks later on the rat that developed necrosis. During imaging, animals were anesthetized with isoflurane and controlled at 37.2±0.5°C. 1g/kg of 3-O-Methyl Glucose was injected intravenously at a controlled rate 5 minutes after the start of acquisition. R1ρ maps were calculated by: R1ρ=ln(STSL=0/STSL=70)/70ms.
RESULTS
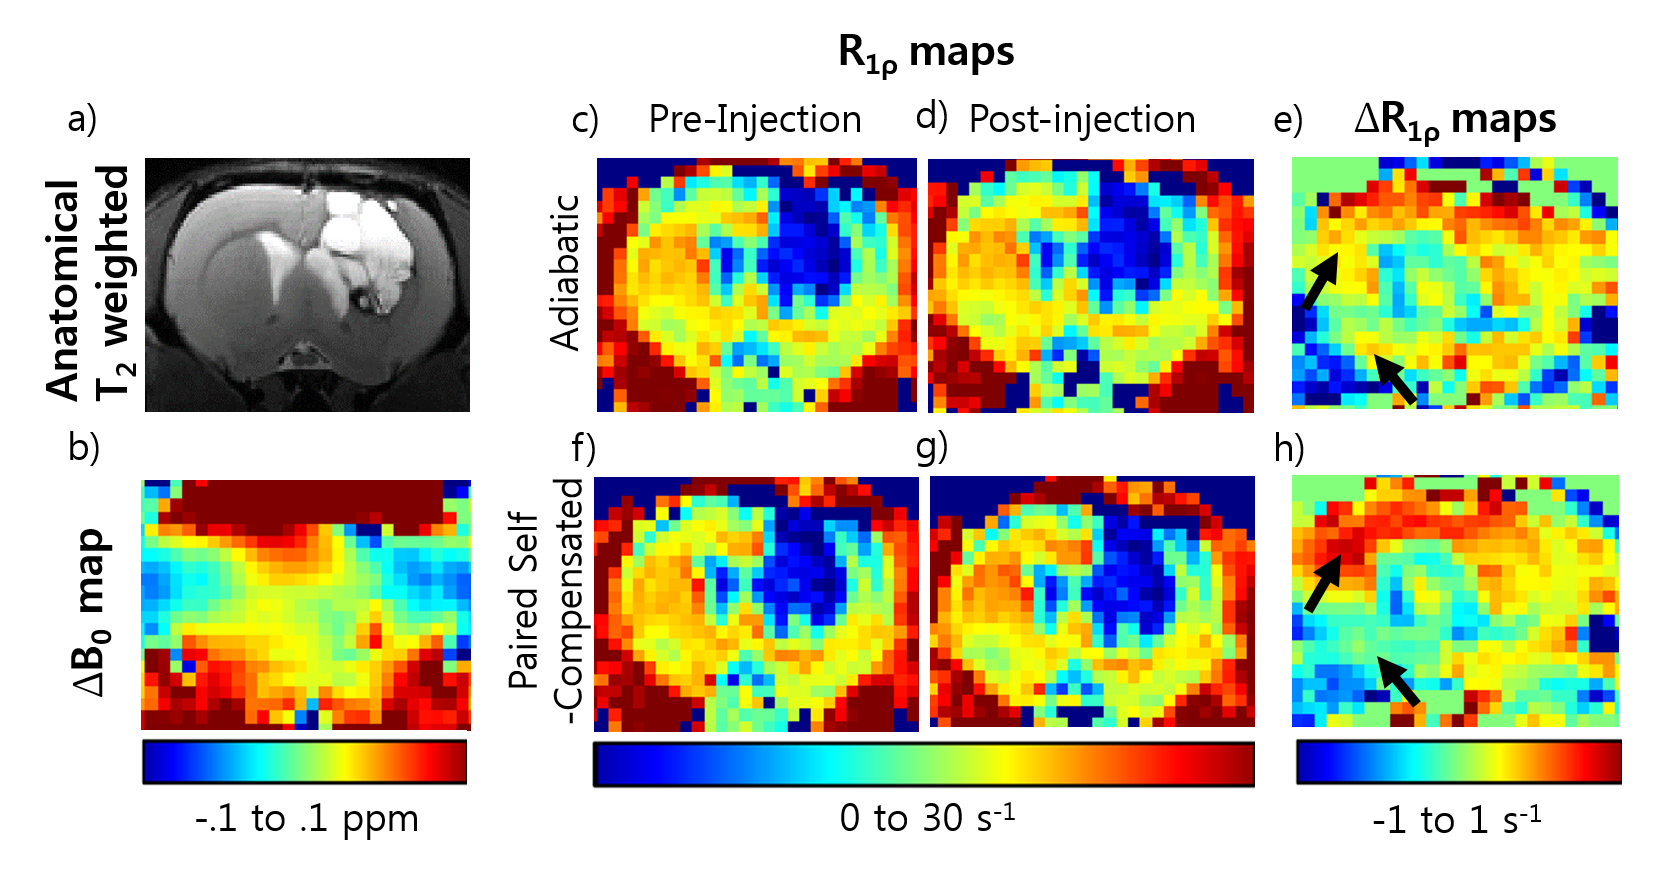
The anatomical data in Figure 2a is from 12 weeks after inoculation. The tumor area surrounds a dark core that appears to be necrosis. A map of Δ B0(Fig.2b) shows homogeneity in the tumor area with areas of inhomogeneity on the dorsal and ventral regions of the contralateral side.
Figure 2 also shows R1ρ maps and ΔR1ρ maps for both adiabatic (c-e) and paired self-compensated pulses (f-h) with a one hour period lapse between before and after 3-OMG injection. The maps using the adiabatic pulse appear qualitatively similar over time. The paired self-compensated SL pulse scheme on the whole looked similar over the course of time with no banding artifacts but there are opposite differences on the dorsal and ventral side of the brain particularly indicated by the black arrows which can be seen clearly on the difference maps.
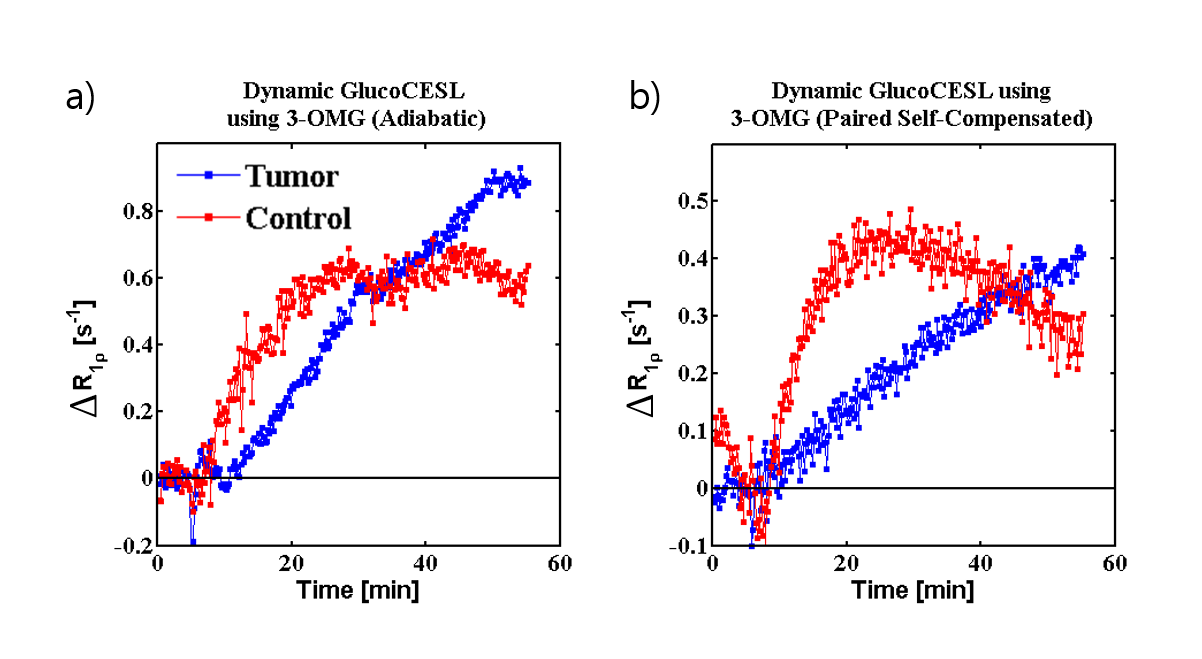
Figure 3 shows dynamic curves from injection around 5 minutes into the experiment to 50 minutes post-injection. The necrotic tissue shows slower onset of 3-OMG transport possibly due to suppressed blood flow due to necrosis. Conversely, the uptake in healthy tissue plateaus while the uptake in the necrotic tumor tissue continues to rise albeit slowly. The signal in the paired self-compensated scheme(b) was lower than the data acquired from the adiabatic scheme(a) and appeared to slightly decrease as the experiment progressed.
DISCUSSION
There is evidence of an infarction due to the slower onset of 3-OMG uptake in comparison to the healthy tissue. Normal tissue reaches a saturation plateau early on while the slow tumor tissue exceeds this plateau and continues to grow which implies differences in maximal metabolic uptake.
While both spin lock schemes yield R1ρ maps with reasonable spatial integrity free of banding artifacts the difference images appear to show that both schemes are susceptible to influence from inhomogeneities present on the dorsal and ventral side of the hemisphere contralateral to the tumor region with paired self-compensating spin lock being significantly more affected. These spatial variations may be the reason why the signal acquired by averaging over the area of the tumor and healthy is less in the paired self-compensating scheme than that of the adiabatic pulse scheme.
CONCLUSION
The paired self-compensated scheme seems to be a viable option for implementing dynamic glucoCESL. While it loses some sensitivity in comparison to an adiabatic pulse and is more susceptible to B0 inhomogeneity, it is easier to implement and requires a drastically lower peak power. Both schemes were able to detect slower uptake of 3-OMG in an infarcted tumor necrosis.Acknowledgements
This work was supported by the Institute for Basic Science (IBS-R015-D1) and a National Research Foundation of Korea (NRF) grant funded by the Korean government (MSIP) (2016R1A2A1A05004952).References
1) Schuenke P, Koehler C, Korzowski A, Windschuh J, Bachert P, Ladd ME, Mundiyanapurath S, Paech D, Bickelhaupt S, Bonekamp D, Schlemmer HP, Radbruch A, Zaiss M. Adiabatically prepared spin-lock approach for T1rho-based dynamic glucose enhanced MRI at ultrahigh fields. Magnetic resonance in medicine. Jul 2017;78(1):215-225.
2) Jin T, Mehrens H, Hendrich KS, Kim SG. Mapping brain glucose uptake with chemical exchange-sensitive spin-lock magnetic resonance imaging. Journal of cerebral blood flow and metabolism : official journal of the International Society of Cerebral Blood Flow and Metabolism. Aug 2014;34(8):1402-1410.
3) Mitrea BG, Krafft AJ, Song R, Loeffler RB, Hillenbrand CM. Paired self-compensated spin-lock preparation for improved T1rho quantification. J Magn Reson. Jul 2016;268:49-57.
4) Rivlin M, Navon G. CEST MRI of 3-O-methyl-D-glucose on different breast cancer models. Magnetic resonance in medicine. May 12 2017.
Figures