5118
GluCEST MRI: Reproducibility, background contribution and source of glutamate changes in the MPTP mouse model of Parkinson’s disease1Department of Radiology, University of Pennsylvania, Philadelphia, PA, United States, 2Children's Hospital of Philadelphia, Philadelphia, PA, United States, 3Department of Neurology, University of Pennsylvania, Philadelphia, PA, United States
Synopsis
Glutamate Chemical Exchange Saturation Transfer (GluCEST) MRI provides indirect detection of glutamate in vivo by measuring the exchange of glutamate amine protons with bulk water. The GluCEST contrast is potentially contaminated by a contribution of other metabolites exhibiting proton chemical exchange. We evaluated the reproducibility and background contamination to the GluCEST and source of the GluCEST changes in MPTP mouse model. Approximately 28% of GluCEST contrast appears to be derived from sources other than glutamate that
Introduction
Glutamate Chemical Exchange Saturation Transfer (GluCEST) MRI is a recently developed technique to image glutamate1. GluCEST provides indirect detection of glutamate in vivo by measuring the exchange of glutamate amine protons with bulk water and provides greater sensitivity and spatial resolution than conventional 1H magnetic resonance spectroscopy (1H MRS) techniques. GluCEST MRI has been used to study neurodegeneration due to , tau pathology induced synapse loss2, epilepsy3, Huntington’s disease4, schizophrenia5 and MPTP induced parkinsonism6. However, because the GluCEST method relies on the indirect detection, it is potentially contaminated by contributions of other metabolites exhibiting proton chemical exchange. In the present study, we evaluated the reproducibility and background contamination to the GluCEST and source of the GluCEST changes in MPTP model of Parkinson’s disease.Methods
Male C57BL6 mice were treated with MPTP/Saline for 7 days. For MR studies, mice were anesthetized with Isoflurane/O2 (1-2%, 1 L/hr) and positioned in a 9.4T Horizontal bore (Agilent Technologies Inc., USA) spectrometer. GluCEST imaging was performed using a custom-programmed RF spoiled gradient echo readout pulse sequence in 2mm thick coronal slices with a frequency selective continuous wave saturation preparation pulse. CEST images were collected using a 1-second saturation pulse at B1 of 250 Hz (5.9 μT) for the frequencies ±2.5-3.5 ppm from water resonance with step-size of 0.25 ppm. The B0 inhomogeneity corrected images at 3 ppm (M+3ppm) and −3 ppm (M−3ppm) were used for computing the percent GluCEST contrast, which is equal to 100×[(M−3ppm − M+3ppm)/M−3ppm]. Regions of interest (ROIs) were manually segmented from T2-weighted images. Another set of control mice were scanned three times with 2 days of rest in between the scans for the reproducibility studies. For 1H MRS studies, a 2x2x2 mm3 voxel was placed in the striatum of the mice. The spectra were processed using LCModel. Additionally, the immunohistochemical analysis was performed in the brain slices from the mice of both groups to measure glutamate and Glial Fibrillary Acidic Protein (GFAP).Results and Discussion
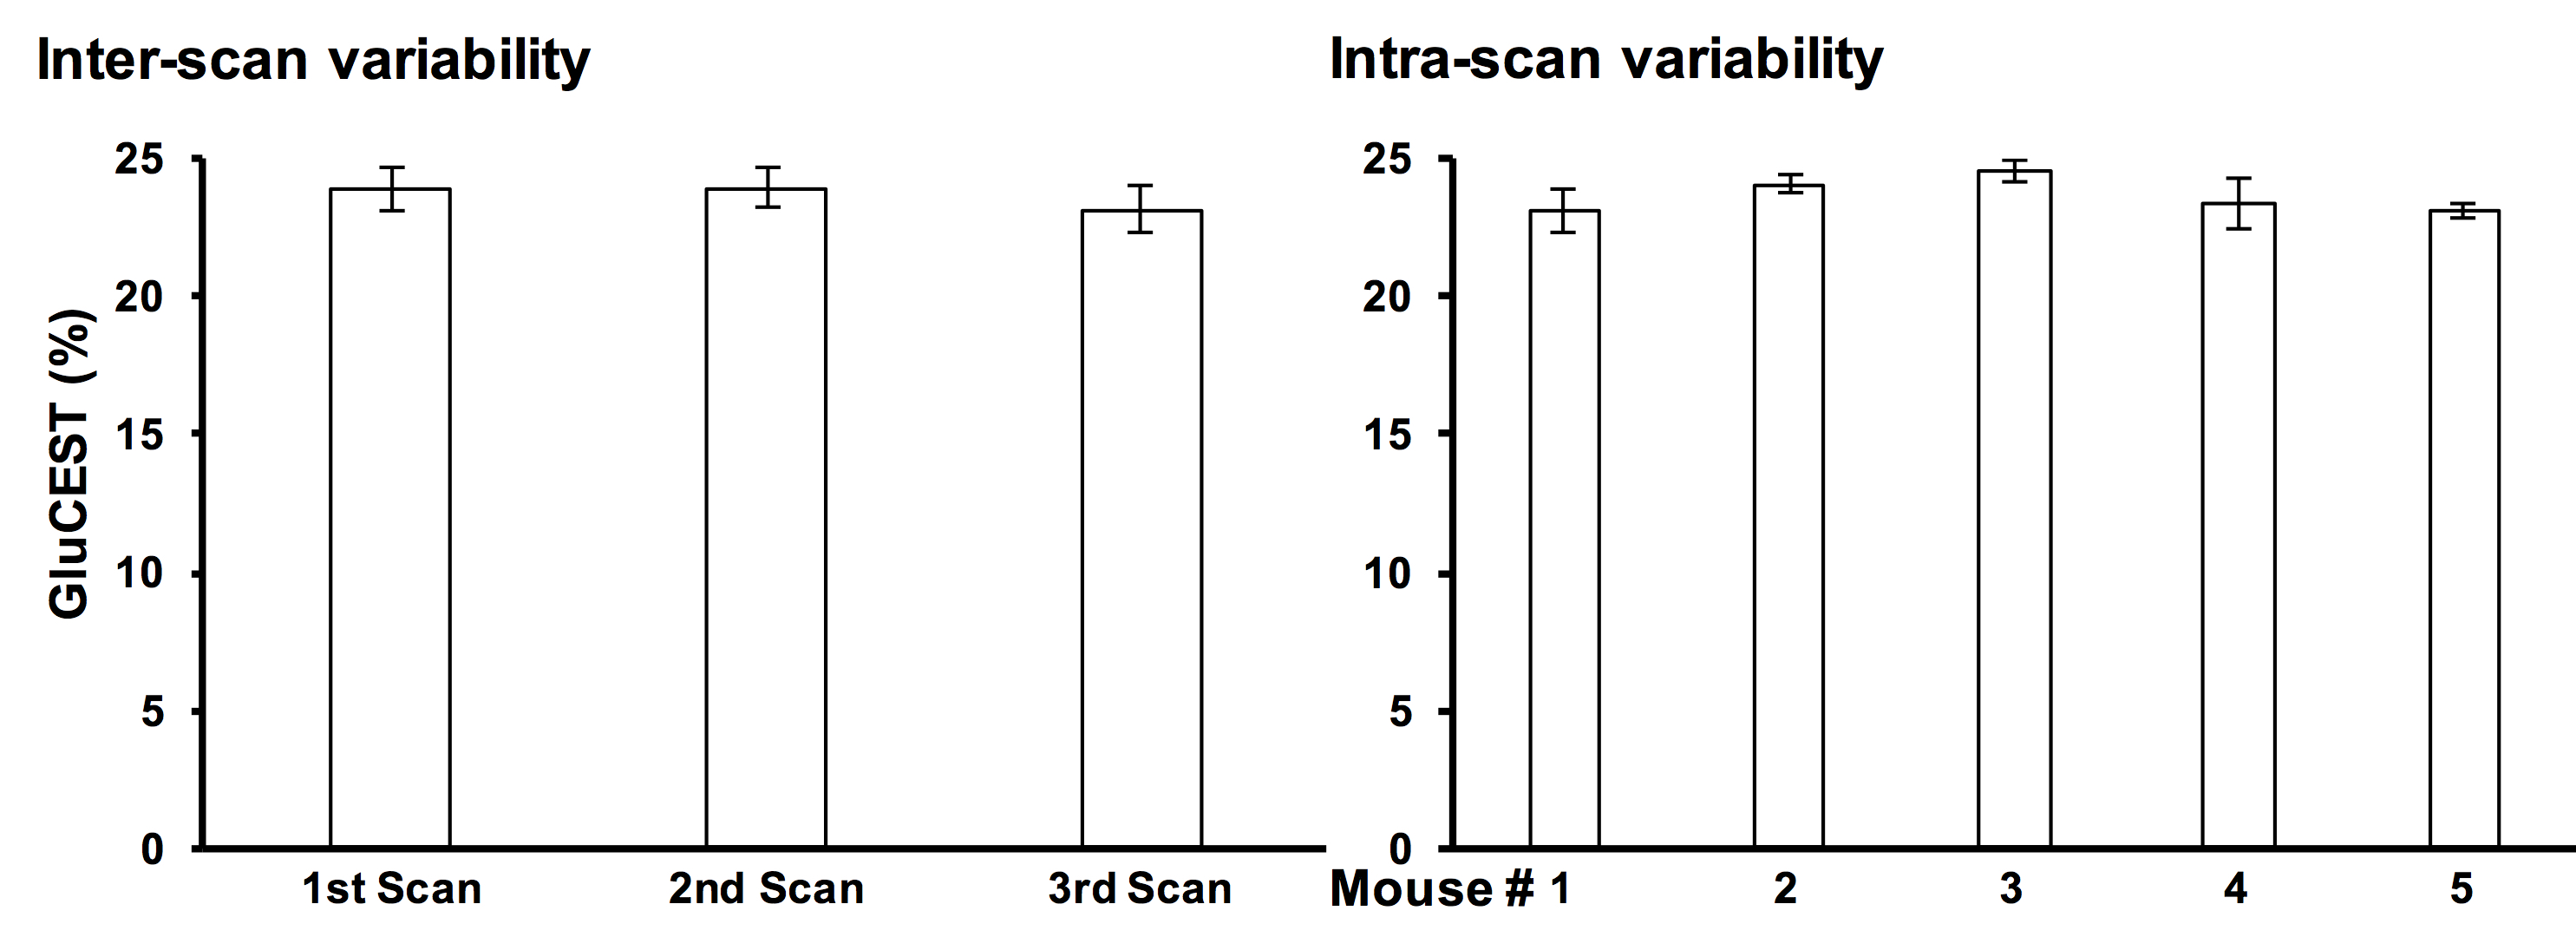
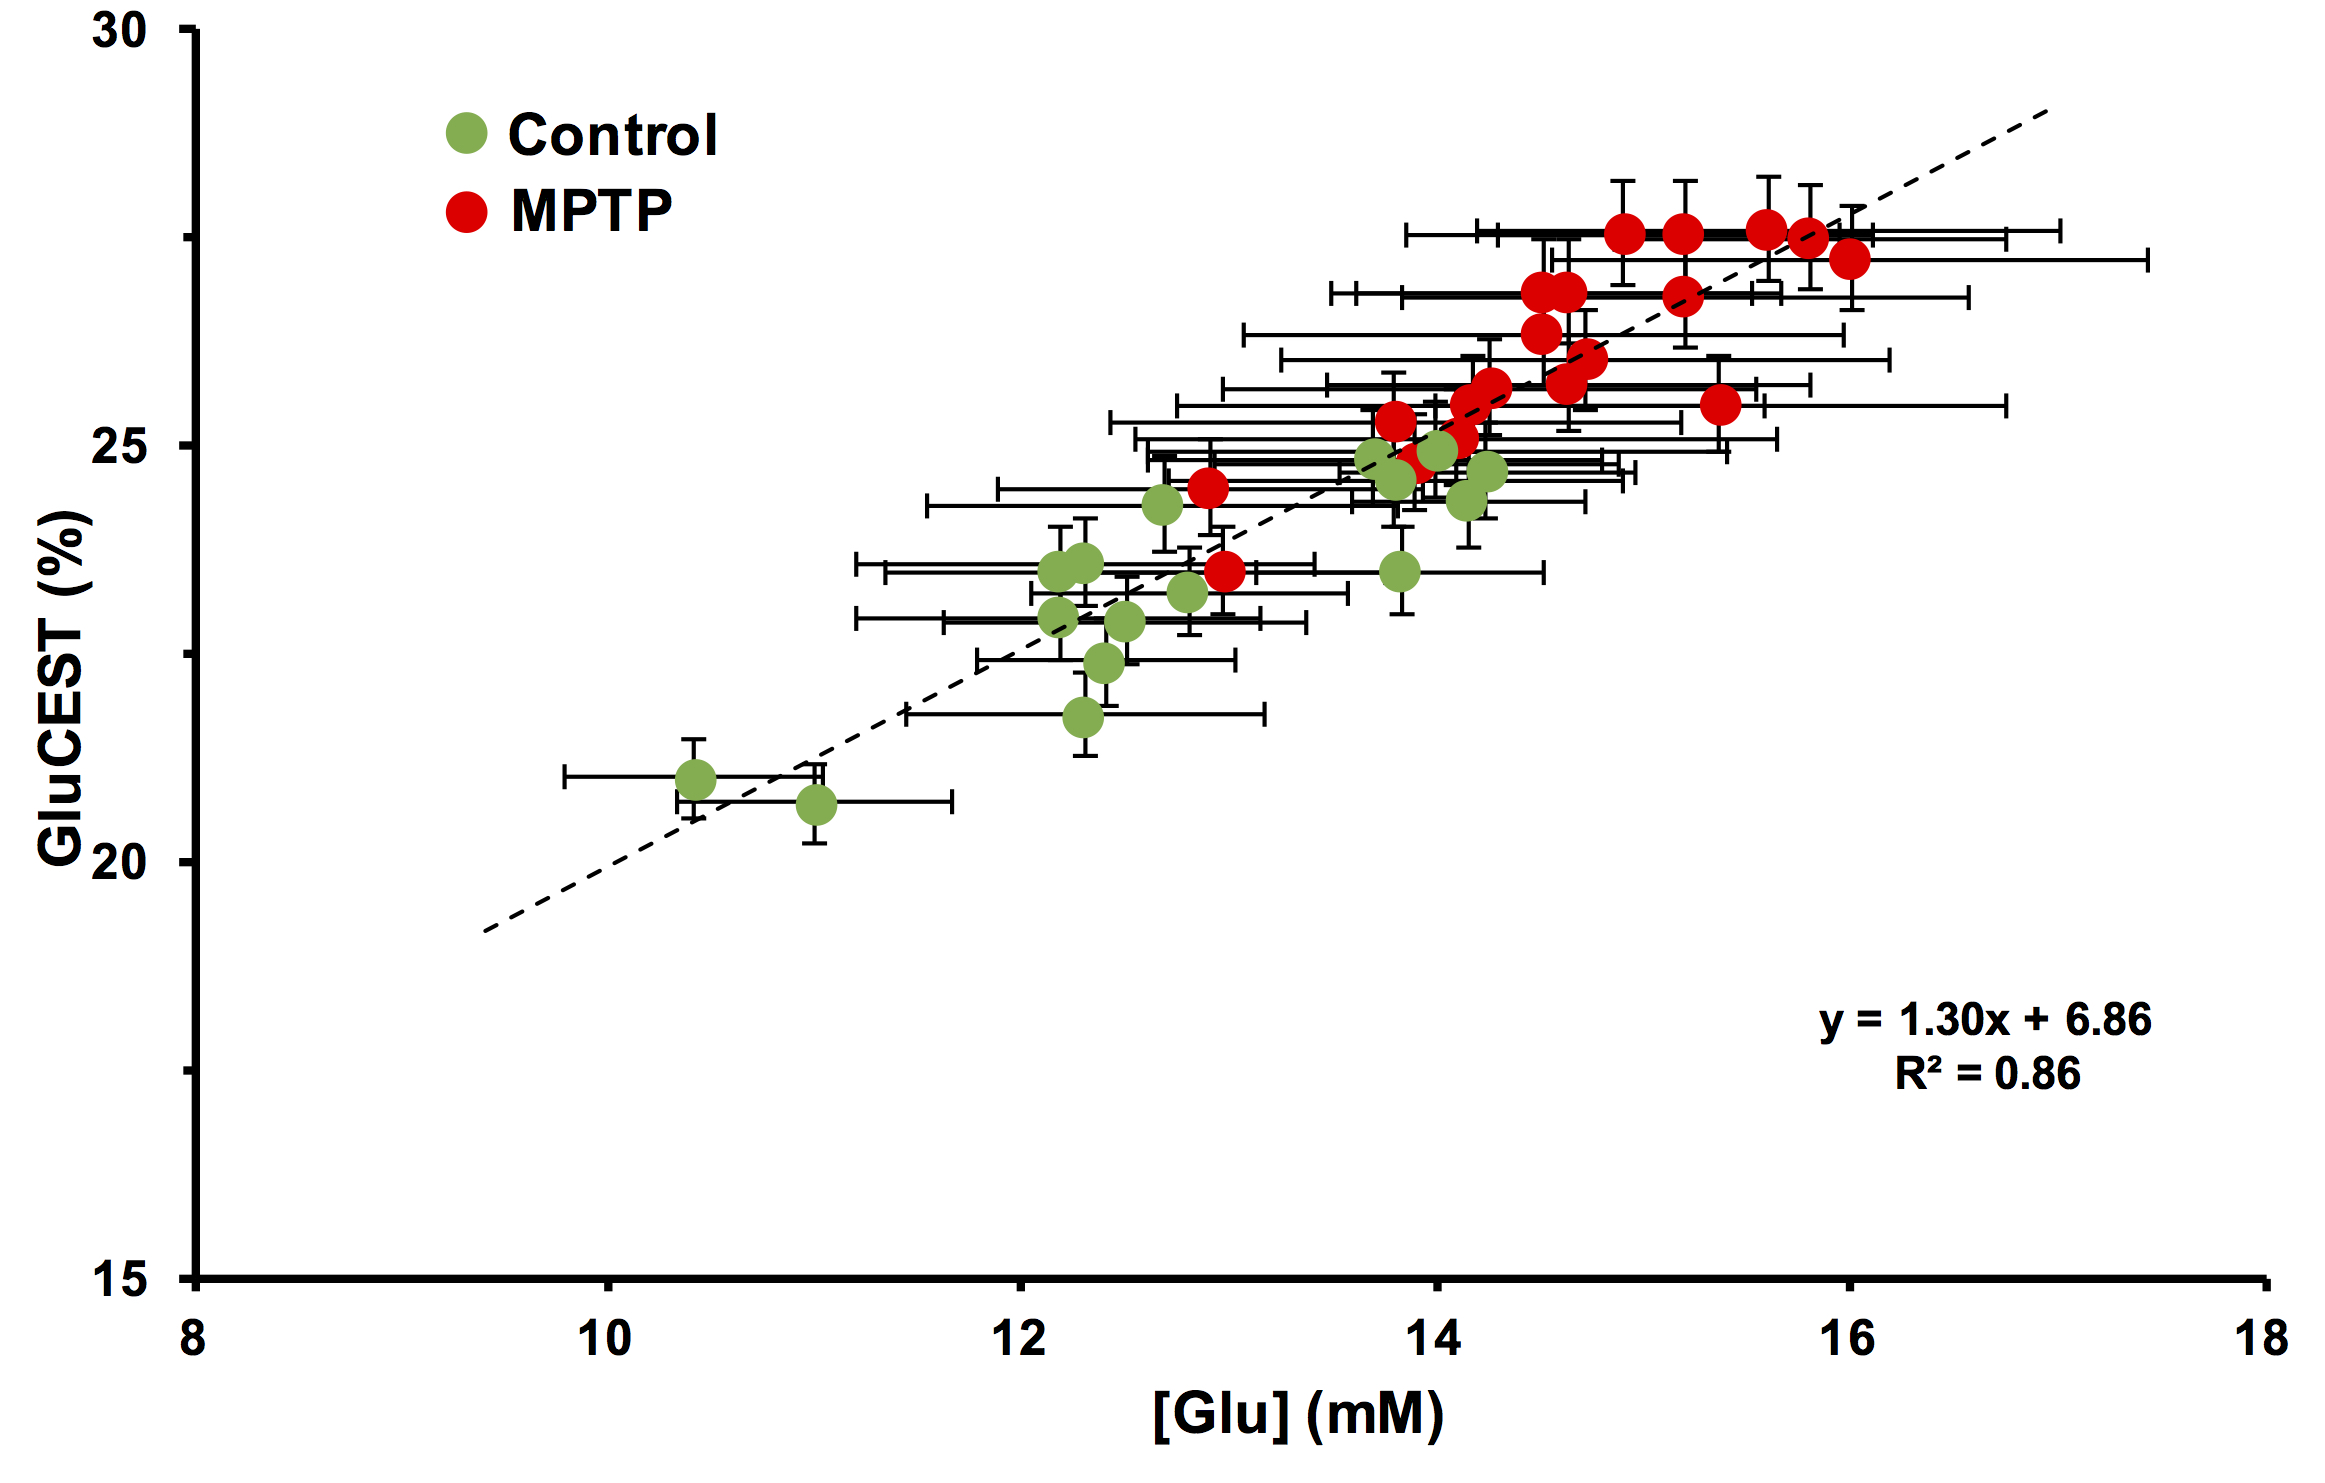
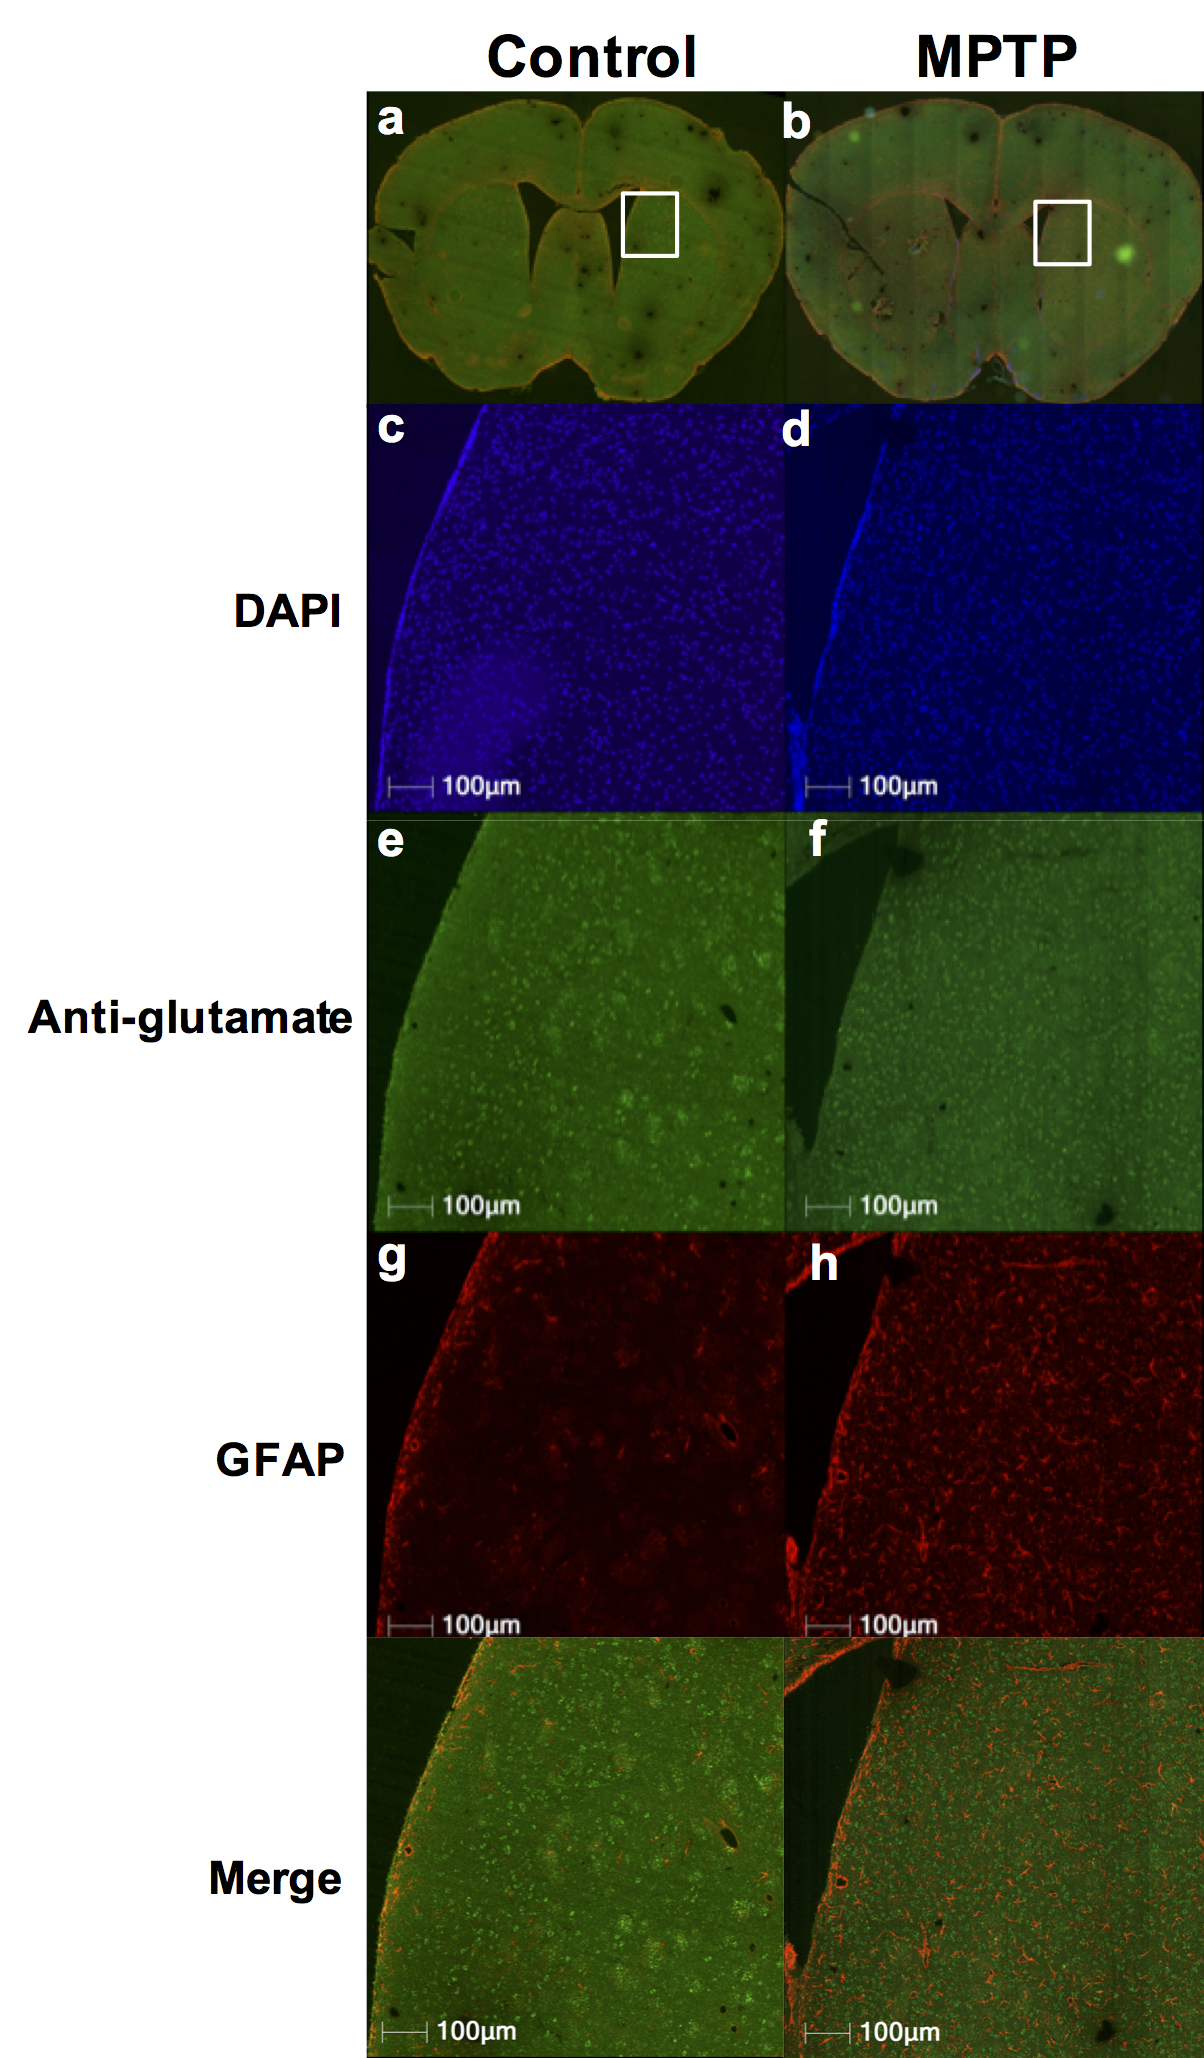
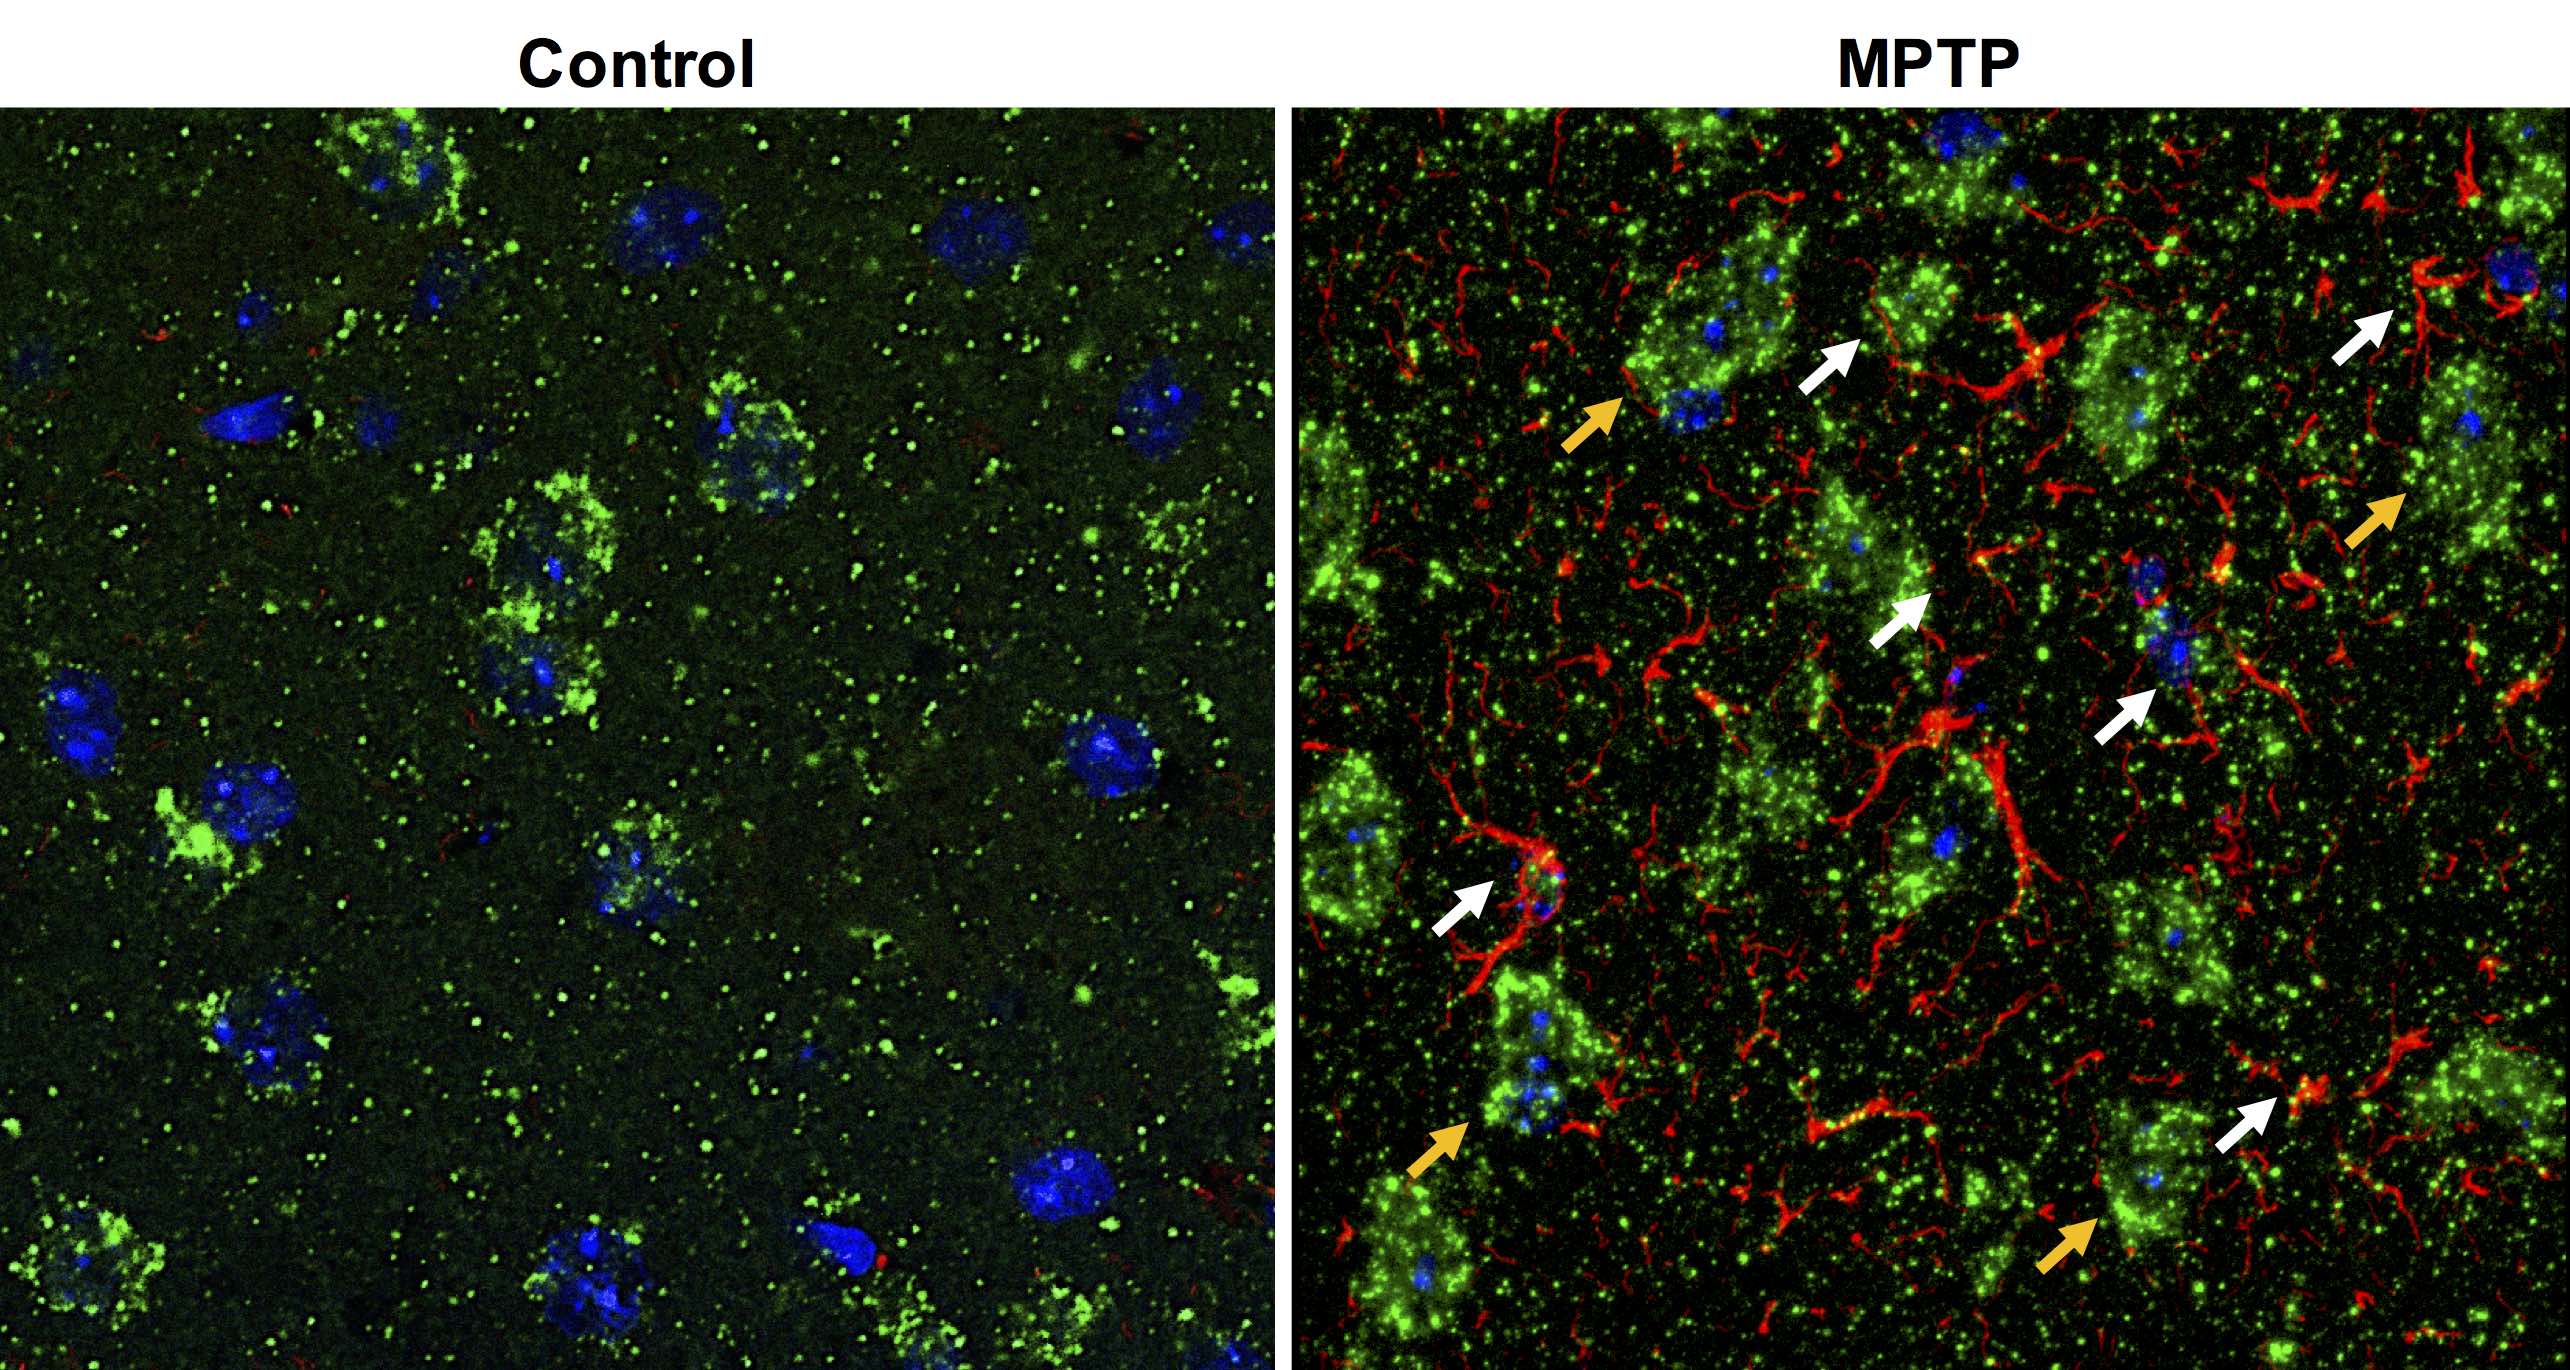
Repeated measurements from five different mice demonstrated an intra-animal coefficient of variation (CV) of GluCEST signal to be 2.3 ± 1.3% and inter-animal CV of GluCEST to be 3.3 ± 0.3% (Figure 1). This demonstrates the high degree of repeatability and low inter-animal variability of GluCEST scans performed in mice. We found an elevation of the GluCEST contrast in the striatum following MPTP treatment along with the increase in glutamate level measured by 1H MRS. Additionally, the positive association between glutamate concentration measured via 1H MRS and GluCEST signal was used to estimate background contribution to the measured GluCEST at 3 ppm from non-glutamate sources which was found to be ~6% (Relative value 28%, Figure 2). Immunohistochemical analysis of the brain showed the elevation of glutamate and GFAP in the striatum followed by the MPTP exposure (Figure 3). Additionally, the co-localization of glutamate with GFAP in the striatum suggests the elevated glutamate may be due to the gliosis and glial reactivity followed by the MPTP toxicity (Figure 4). Roughly 28% of GluCEST contrast appears to be derived from sources other than glutamate that are also not detectable by MRS, which is in corroboration with the theoretical estimate from the previous study1.Acknowledgements
This project was supported by the National Institute of Biomedical Imaging and Bioengineering of the National Institutes of Health through Grant Number P41-EB015893 and the National Institute of Neurological Disorders and Stroke through Award Number R01NS087516.References
1. Cai K et al (2012) Nat Med 18:302-6
2. Crescennzi R et al (2014) Neuroimage 101:185-92
3. Davis K et al (2015) Sci Transl Med 7:309ra161
4. Pepin J et al (2016) Neuroimage 139:53-64
5. Roalf DR et al (2017) Mol Psychiatry 22:1298-1305
6. Bagga P et al (2016) J Neurochem 139:432-439
Figures