5117
Nuclear Overhauser enhancement effect of low $$$B_{1}$$$ power CEST RF in human brain at 3.0 T1Institute of Biomedical Sciences, Tokushima University Graduate School, Tokushima, Japan, 2Global MR Applications and Workflow, GE Healthcare Japan, Hino, Japan, 3School of Health Sciences, Tokushima University, Tokushima, Japan, 4Graduate school of Health Science, Tokushima University, Tokushima, Japan
Synopsis
The purpose of this study is to clarify the relationship between APT and NOE effects derived from CPE fitting of the human brain on a 3 T MR scanner. CEST imaging with different B1 values of the brain was performed in healthy subjects. The mean NOE values of white matter at 0.5 µT were higher than all regions (P < 0.05). CPE-spectrum shows greater sensitivity for both APT and NOE peaks than conventional Z-spectrum and MTRasym. It is found that NOE imaging on a 3.0 T scanner is sensitive on low-B1 power regardless of the CEST fitting process.
Introduction
Chemical exchange saturation transfer (CEST) imaging has been rapidly advancing for clinical applications. Among others, amide proton transfer (APT) imaging has been reported to be used for tumor and acute ischemia identifications in brain tissue. The nuclear Overhauser enhancement (NOE) effect is generally observed as the opposite-side of the APT effect. In clinical applications, NOE has been generally observed in ultra-high-magnetic MRI using more than 7 T.1 Although magnetization transfer (MT) pulse with high-B1 power leads to high APT contrast, it tends to lose the NOE effect.2 Similar signal change had been also observed in previous results using a 3 T MR scanner; it had a broader peak on the opposite side of the Z-spectrum that approximately spans the frequency range from -2.2 to -5.5 ppm.3 Some multi-pool exchange models have been reported to be observed for APT and NOE. A three-extrapolated semisolid magnetization transfer reference (EMR) method enables us to accurately calculate APT, NOE, and other CEST signals in normal tissue, edema, and glioma using a 3 T MR scanner.4 Moreover, the CEST peak extraction (CPE) fitting method also had a quantitative result in a multi-pool exchange model, which includes the CEST pool, binding water MT pool and free water pool5. From now while the concern with CEST imaging using 3 T MR scanner has been growing, a more prescriptive approach will be needed to apply to NOE imaging using a 3 T MR scanner.Purpose
To assess the relationship between APT and NOE effects in the human brain, we evaluated the dependency of B1 power on CEST imaging using a 3 T clinical scanner and CPE fitting method.Materals and Methods
On a 3.0 T magnetic resonance system (Discovery 750, GE Healthcare), CEST imaging of the brain was performed on healthy subjects (five men; ages, 22-41 years; mean age, 29.2 years). An CEST imaging dataset was acquired with echo planer imaging sequence and phase cycle radio frequency (RF) preparation; the frequency offset range was from -7 to +7 ppm at intervals of 0.5 ppm, and a total of 29 data points were acquired. The mean B1 values of the MT pulses were set at 0.5, 1.0, and 1.5 µT. The other imaging parameters were echo time, 23.3 ms; repetition time, 5000 ms; bandwidth, 3906 Hz/pixel; field of view, 22 cm; matrix size, 96 × 128; slice thickness, 8 mm. All slice positions were set at three slices on center of the nucleus basalis level. Acquired imaging data were applied to B0 correction for each pixel. MT ratio asymmetry (MTRasym) was calculated as follows:
MTRasym = MTR(+∆ω) - MTR(-∆ω) = (Isat (-∆ω) - Isat (+∆ω)) / I0 ,
where Isat and I0 are the imaging signal intensities measured with MT pulses at each frequency and at -10ppm frequency where no MT effect was observed, and ∆ω is frequency offset. The CPE fitting method was performed on each pixel 5; MTR, APT, and NOE values were derived from free water, binding water, and CEST terms in the equation. Then, we set the region-of-interest (ROI) analysis in CEST images with B0 corrected images; the ROIs were set as putamen, pallidum and white matter of each subject. We evaluated Z- and CPE-spectrum, and MTRasym for each subject.
Results and Discussion
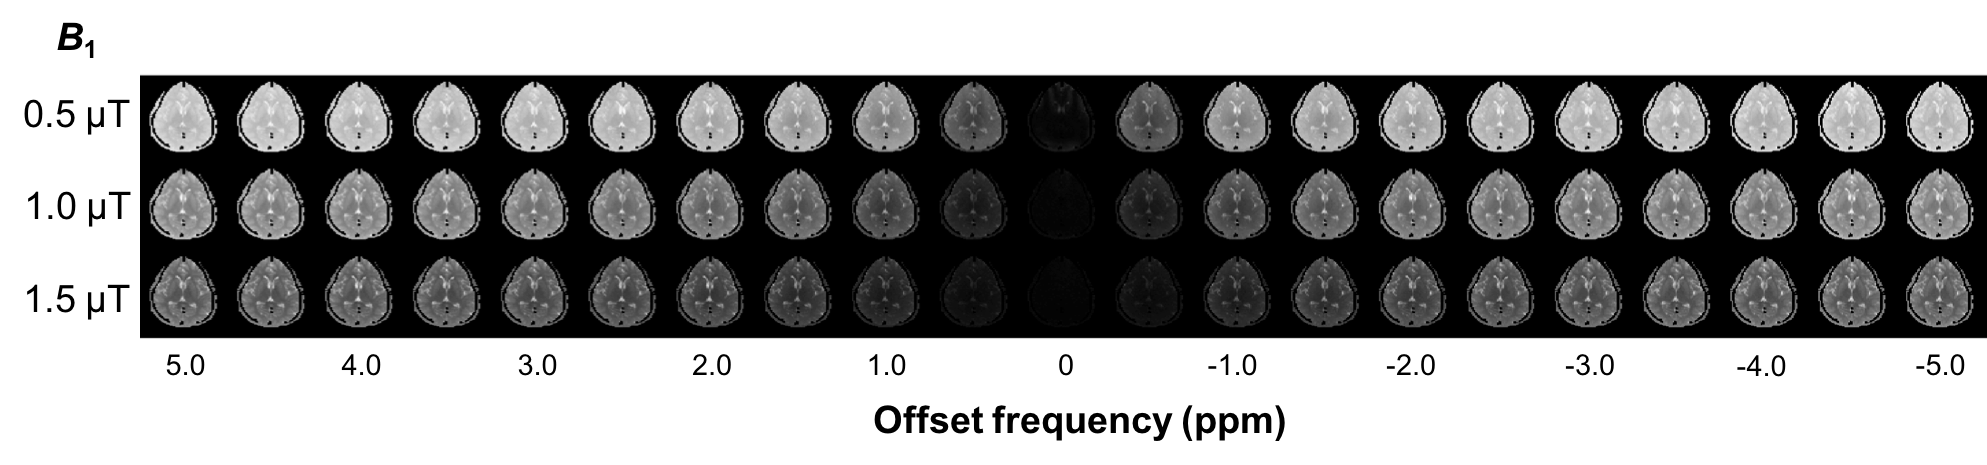
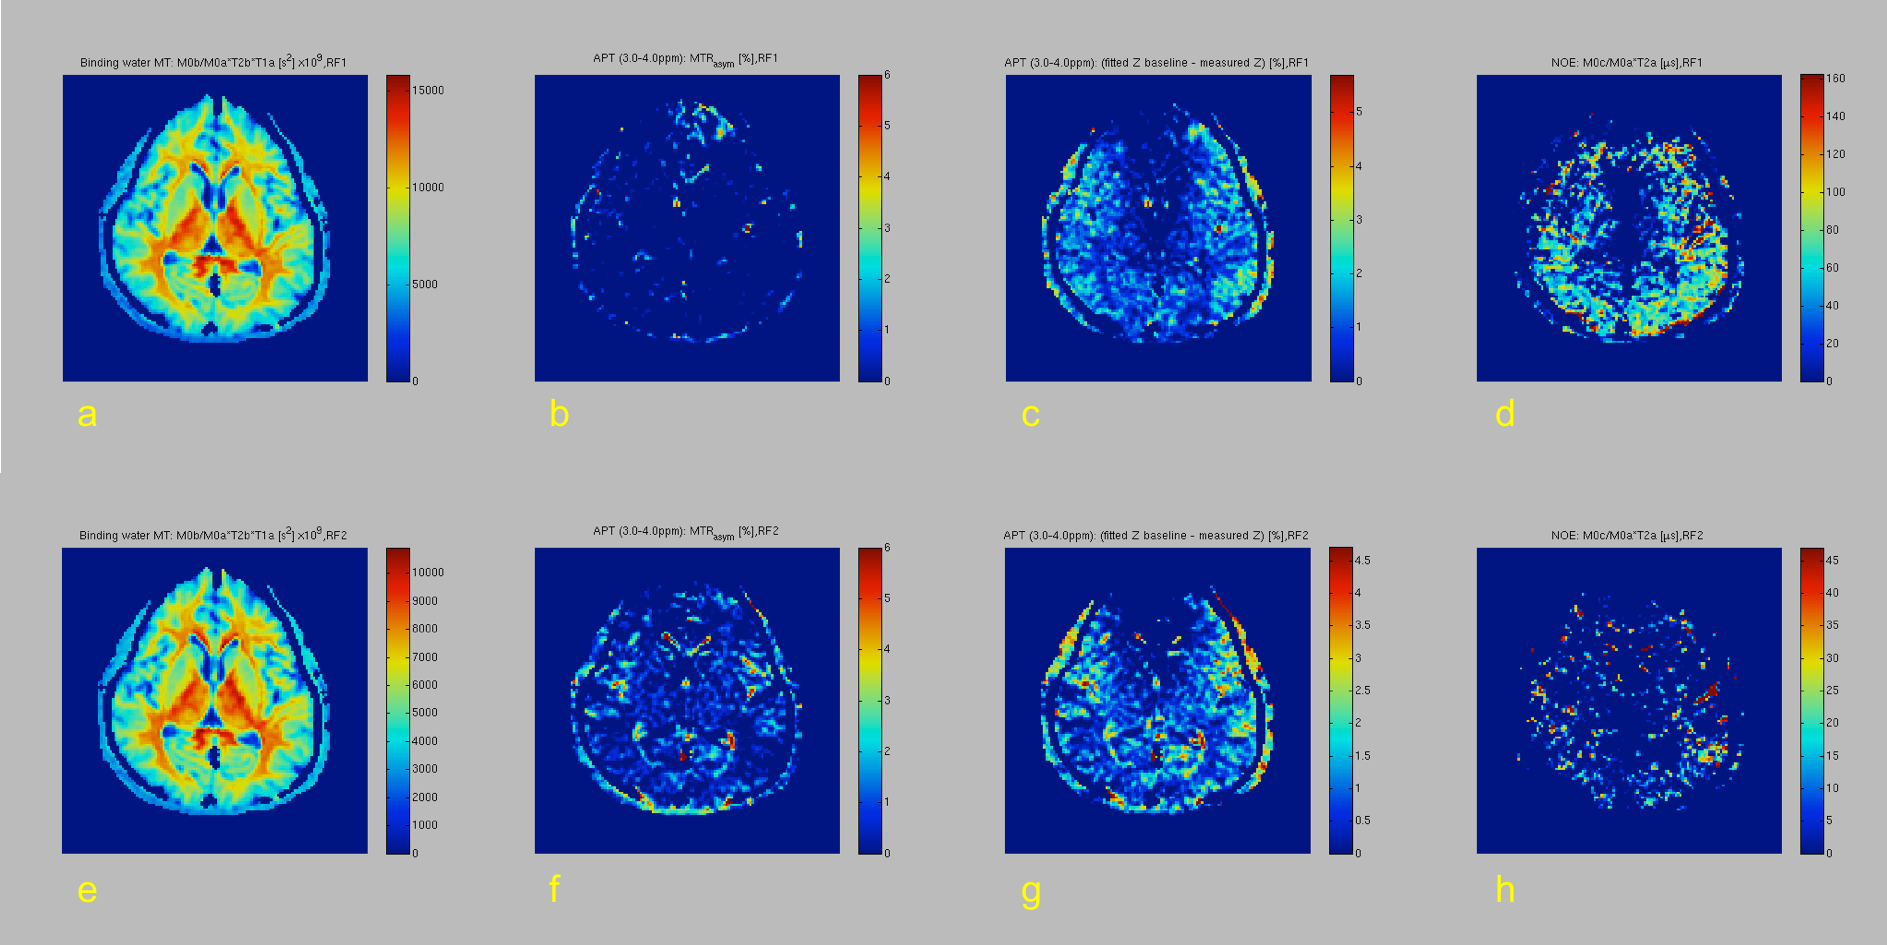
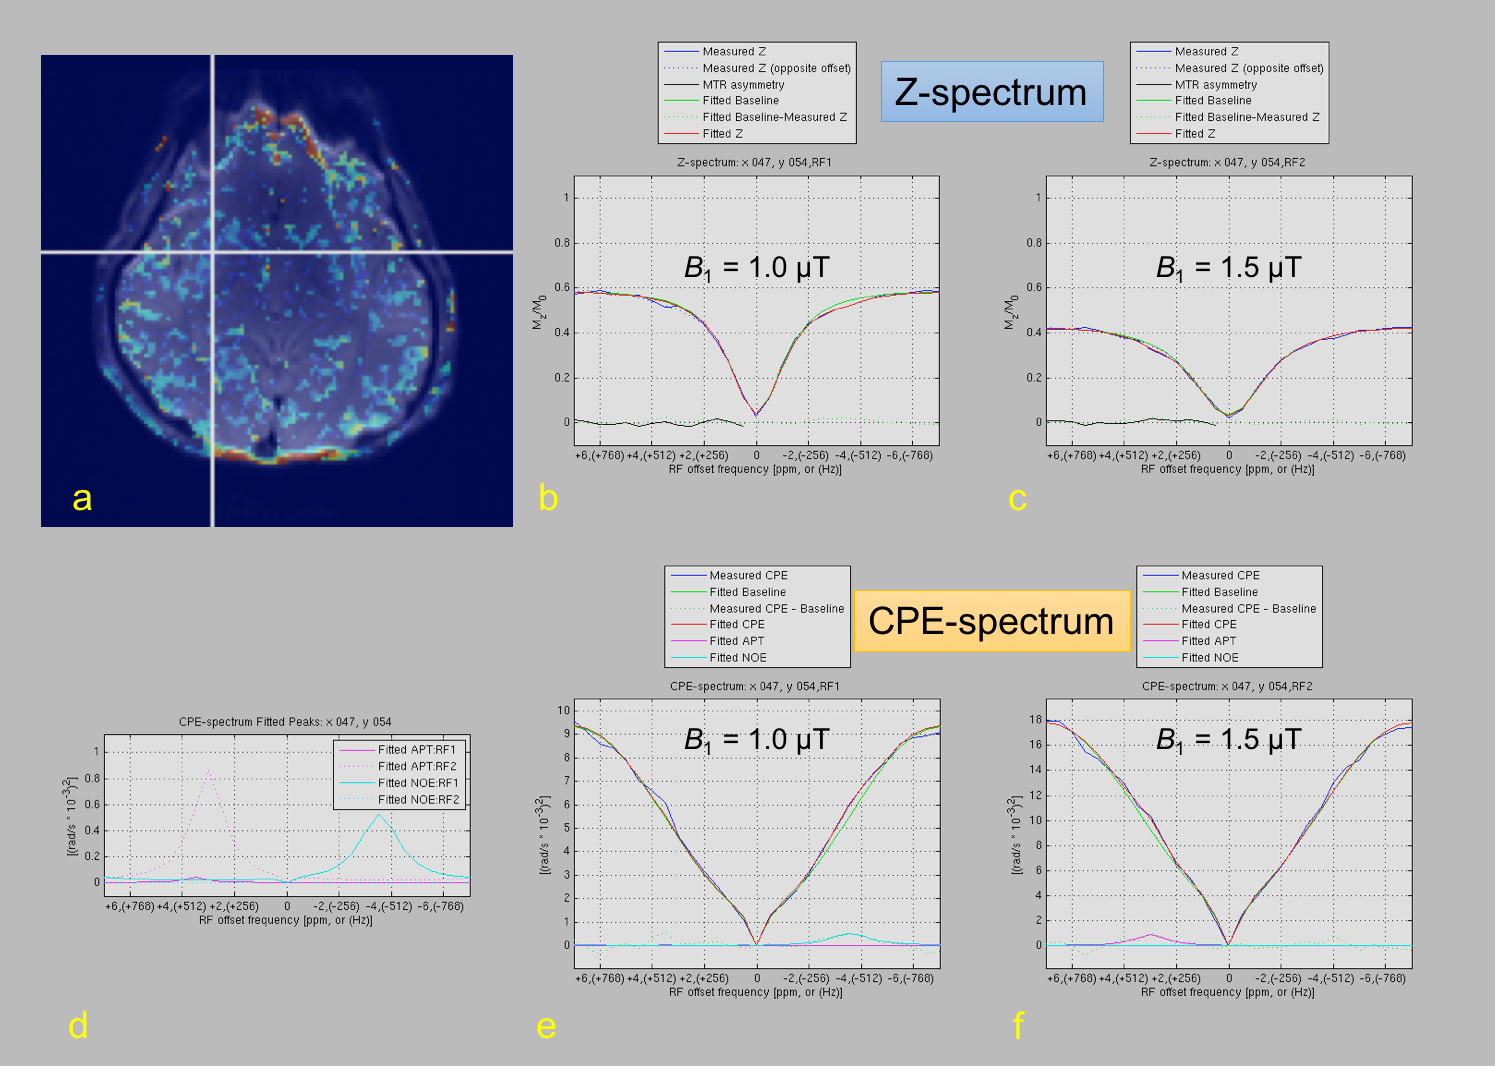
Table 1 summarizes the measurement of mean APT (+3.5 ppm), NOE (-4.0 ppm), and MTRasym (3.5 ppm) values in white matter, putamen and pallidum in healthy subjects at each B1. Figure 1 shows representative CEST images of each offset frequency from -5.0 to +5.0 ppm for each B1. Figure 2 shows conventional APT (3.0-4.0 ppm) MTRasym image, MT, APT (3.0-4.0 ppm), and NOE images derived from CPE fitting at B1 of 1.0 and 1.5 µT for a represented subject. Figure 3 shows Z- and CPE- spectrum of a pixel set in the putamen at 1.0 µT and 1.5 µT for a represented subject. The mean APT and NOE values of white matter were lower than that of putamen (P < 0.001). CPE-spectrum shows more sensitivity to both APT and NOE peaks than conventional Z-spectrum and MTRasym. Moreover, although APT images derived from the CPE fitting method were rarely different in B1 power, NOE images at 0.5 and 1.0 µT B1 obtained more clear contrast than 1.5 µT. Thus, this result proves clearly that the NOE effect is more sensitive at low-B1 power.Conclusion
NOE imaging derived from a CPE fitting method on a 3 T MR scanner makes it possible to obtain more detailed information of the brain, e.g., mobile proteins, lipids, and metabolites.Acknowledgements
No acknowledgement found.References
- Jones CK, Huang A, Xu J, Edden RA, Schär M, Hua J, Oskolkov N, Zacà D, Zhou J, McMahon MT, Pillai JJ, van Zijl PC. Nuclear Overhauser enhancement (NOE) imaging in the human brain at 7T. Neuroimage. 2013;77:114-24.
- Zhou J, Hong X, Zhao X, Gao JH, Yuan J. APT-weighted and NOE-weighted image contrasts in glioma with different RF saturation powers based on magnetization transfer ratio asymmetry analyses. Magn Reson Med. 2013;70(2):320-7.
- Scheidegger R, Wong ET, Alsop DC. Contributors to contrast between glioma and brain tissue in chemical exchange saturation transfer sensitive imaging at 3 Tesla. Neuroimage. 2014;99:256-68.
- Heo HY, Zhang Y, Jiang S, Lee DH, Zhou J. Quantitative assessment of amide proton transfer (APT) and nuclear overhauser enhancement (NOE) imaging with extrapolated semisolid magnetization transfer reference (EMR) signals: II. Comparison of three EMR models and application to human brain glioma at 3 Tesla. Magn Reson Med. 2016;75(4):1630-9.
- Miyoshi M, Matsuda T, and Kabasawa H. CEST Peak Extraction method for multi peak fitting. Proceedings of the 23th Annual Meeting of ISMRM. 2015;3346
Figures