5116
Detection of the accumulation of mannitol in rat brains using CEST MRI1Radiology, The Johns Hopkins University School of Medicine, Baltimore, MD, United States, 2Institute for Cell Engineering, The Johns Hopkins University School of Medicine, Baltimore, MD, United States
Synopsis
Mannitol is a clinically widely-used osmotic agent. Accumulation of mannitol in the interstitium of the brain, however, can cause severe adverse effects. Here we used CEST MRI to detect mannitol directly through its inherently carried exchangeable hydroxyl protons. After comprehensively characterizing the CEST properties of mannitol in vitro, we demonstrated that the intra-arterial infusion of mannitol at an excess dose led to a significantly elevated CEST signal at 0.9 ppm, indicating that CEST MRI has
Purpose
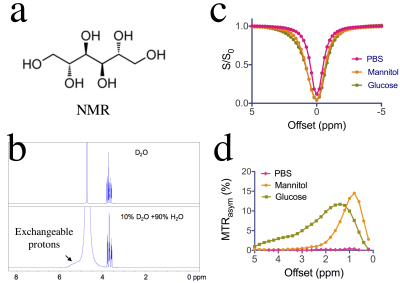
1) To characterize the Chemical Exchange Saturation Transfer (CEST) MRI signal of mannitol (Fig. 1a), an osmotic agent widely used in the clinic to reduce intracranial edema, decrease interstitial fluid pressure, and temporally open the blood-brain barrier (BBB) for drug and cell delivery1-3; 2) To exploit this CEST MRI signal for the detection of mannitol accumulation in brain parenchyma.Method
The CEST contrast of mannitol at different pH and different concentrations was measured on a 9.4 T vertical bore Bruker MRI scanner using a continuous wave (CW) pre-saturation pulse (B1=4.7 µT, Tsat= 2 sec)4. All in vivo MRI studies were conducted on a Biospec 11.7 T MRI scanner equipped with a rat brain surface array RF coil (receiver) and a 72 mm volume coil (transmitter). Under general anesthesia, a catheter was inserted in the extracranial right internal carotid artery (ICA) of rats (Wistar, male, ~250 g) and cannulated with PE20 Intramedic polyethylene tubing. Rats were infused with D-mannitol (25%, Hospira, Inc.) at a rate of 0.6 ml/min, either for 1.7 minute (n=3) or 5 minutes (n=3). CEST MR RARE images were acquired before and at 20 minutes after mannitol injection (CW pulse, B1=2 µT, Tsat= 3 sec) with offsets from -5 to +5 ppm (0.2 ppm steps) for the full Z-spectrum; TR/TE=5000/5 ms, RARE factor=20. After correcting for B0 inhomogeneity using the WASSR method5, CEST contrast was quantified by MTRasym=(S-Δω – S+Δω)/ S0. To compensate for the contribution of changes in T1 relaxation times to the apparent CEST signal, we also acquired T1 maps and calculated the T1 compensated inverse Z-analysis (AREX), defined by (S0/S+∆ω-S0/S-∆ω)/T16-8.Results
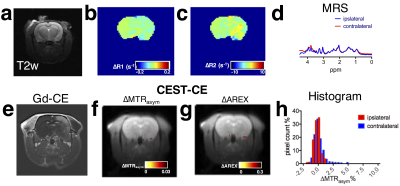
Comparison of NMR spectra of mannitol in D2O and H2O (Fig.1b) reveals a broad signal of exchangeable hydroxyl protons at 5.1- 5.5 ppm, or 0.4-0.8 ppm relative to water, which allows mannitol to be detected by CEST MRI. As shown in Figs 1c&d, for the saturation parameters used, the maximum MTRasym signal of mannitol appears at ~ 0.9 ppm, which is slightly different from that of glucose. To demonstrate the in vivo CEST MRI detection of mannitol, we infused rats with mannitol at different doses, i.e., 1 mL and 3 mL per animal. Evidenced by gadolinium contrast enhanced images at ~ 8 minutes after the completion of mannitol infusion (Gd-CE, Figs. 2e& 3e), both doses resulted in BBB opening in the ipsilateral but not the contralateral hemisphere. Interestingly, noticeable changes in the T1 and T2 values in the ipsilateral hemisphere were found in the high dose group (Figs. 2b&2c) but not in the low dose group (Figs. 3b&3c). The CEST MRI results showed that there was a negligible CEST contrast enhancement (CEST-CE) in both ipsilateral and contralateral hemispheres when the low dose was used (Fig. 3f), whereas there was a marked increase in CEST-CE in the ipsilateral hemisphere of the rat received the high dose (Figs. 2f). To prove the increase of CEST MRI signal is not due to the changes in T1 values, we calculated the ∆AREX maps (Figs. 2g&3g), which also show significantly elevated CEST signal in the brain in the high dose group (P< 0.01, Fig.4). Finally, we used MRS to validate the accumulation of mannitol in the high dose group (Figs. 2d&3d), confirming the increase of CEST signal is caused by mannitol accumulation in the brain.Discussion
Our study demonstrates that the CEST MRI can directly detect mannitol without the need of any extra imaging agents. Mannitol has a long history to be used as a clinical osmotic reagent, for example, to open BBB for the delivery of otherwise impermeable drugs to the central neural system (CNS). However, extravasted mannitol in the brain parenchyma can cause adverse neurologic complications. Therefore, mannitol should be used with caution and kept at the minimal dose level. Currently only two MRI methods have been reported for noninvasive detection of mannitol including chemical shift imaging (CSI)9 and chemical exchange imaging with spin-lock technique (CESL)10. In comparison, the CEST MRI developed in the current study has a higher specificity (frequency based) than CESL and higher spatial resolution than MRS, adding a powerful MRI tool to the arsenal for clinical monitoring of tissue accumulation of mannitol.Conclusions
In summary, we demonstrated a direct way to detect mannitol via its inherent CEST MRI and applied this method to detect the brain accumulation of mannitol after IA infusion at an excess dose, indicating its potential to serve as a tool to precisely and safely monitor mannitol administration in clinical settings.Acknowledgements
Supported by NIH grants R03EB021573, R01CA211087, R21CA215860, and R01EB015032.References
1. Gumerlock, M.K. Osmotic blood brain barrier disruption Source J Neurooncol Jurnal of Neuro-Oncology (1992).
2. Fortin, D., Desjardins, A., Benko, A., Niyonsega, T. & Boudrias, M. Enhanced chemotherapy delivery by intraarterial infusion and blood-brain barrier disruption in malignant brain tumors: the Sherbrooke experience. Cancer 103, 2606-2615 (2005).
3. Doolittle, N.D., et al. Targeted delivery in primary and metastatic brain tumors: summary report of the seventh annual meeting of the Blood-Brain Barrier Disruption Consortium. Clin Cancer Res 8, 1702-1709 (2002).
4. Liu, G., et al. In vivo multicolor molecular MR imaging using diamagnetic chemical exchange saturation transfer liposomes. Magn. Reson. Med. 67, 1106-1113 (2012).
5. Kim, M., Gillen, J., Landman, B., Zhou, J. & van Zijl, P. Water saturation shift referencing (WASSR) for chemical exchange saturation transfer (CEST) experiments. Magn. Reson. Med. 61, 1441-1450 (2009). 6. Zaiss, M., et al. Inverse Z-spectrum analysis for spillover-, MT-, and T1 -corrected steady-state pulsed CEST-MRI--application to pH-weighted MRI of acute stroke. NMR Biomed. 27, 240-252 (2014). 7. Lee, D.H., et al. Quantitative assessment of the effects of water proton concentration and water T1 changes on amide proton transfer (APT) and nuclear overhauser enhancement (NOE) MRI: The origin of the APT imaging signal in brain tumor. Magn. Reson. Med. (2016).
8. Wu, R., Liu, C.M., Liu, P.K. & Sun, P.Z. Improved measurement of labile proton concentration-weighted chemical exchange rate (k(ws)) with experimental factor-compensated and T(1) -normalized quantitative chemical exchange saturation transfer (CEST) MRI. Contrast Media Mol. Imaging 7, 384-389 (2012).
9. Maioriello, A.V., Chaljub, G., Nauta, H.J. & Lacroix, M. Chemical shift imaging of mannitol in acute cerebral ischemia. Case report. J Neurosurg 97, 687-691 (2002).
10. Jin, T., Mehrens, H., Wang, P. & Kim, S.-G. Glucose metabolism-weighted imaging with chemical exchange-sensitive MRI of 2-deoxyglucose (2DG) in brain: Sensitivity and biological sources. Neuroimage 143, 82-90 (2016).
Figures


