5114
Quantitative Magnetization Transfer Imaging in Murine Kidneys with Renal Artery Stenosis1Division of Nephrology and Hypertension, Mayo Clinic, Rochester, MN, United States
Synopsis
Quantitative magnetization transfer (qMT) imaging was used to measure bound water fraction in mouse kidneys with renal artery stenosis (RAS). MT-weighted images at variable offset frequencies and amplitudes, as well as B0, B1, and T1 maps of control and RAS kidneys, were acquired. A two-pool qMT model was used to estimate the bound water fraction as well as other relaxation and exchange parameters. An increased bound water fraction was found in the cortex, outer medulla, and inner medulla of the RAS kidneys. In conclusion, qMT imaging offers potential new biomarkers for assessment of RAS kidneys.
Introduction
Magnetization transfer (MT) imaging has been shown to detect renal fibrosis in renal artery stenosis (RAS), in which the MT ratio (MTR) correlated well with renal fibrosis by histology1,2. However, the MTR measurement semi-quantitative as it is influenced by scan-specific factors, and may not be reproducible across sites3. In contrast, quantitative magnetization transfer (qMT) imaging provides a direct measurement of macromolecule content. In this study, we aim to investigate the utility of qMT imaging in murine RAS kidneys.Methods
MRI. MRI studies were performed on a vertical 16.4 T Bruker scanner equipped with a 38-mm inner diameter birdcage coil. Nine 10-week-old male 129S1 mice underwent RAS (n=4) or sham (n=5) surgeries. MT scans as well as B0, B1, and T1 mapping, were performed after 2 weeks of RAS. A total of five 1.5 mm thick slices were imaged with a FOV of 3.0×3.0cm2 and matrix size of 128×128.
MT-weighted images were acquired using a MT-prepared fast-low-angle-shot (FLASH) sequence with the following parameters: TR, 120ms; TE, 2.7ms; flip angle, 20°; number of averages, 4. Magnetization saturation was achieved using Gaussian pulses. A total of 24 images were acquired with 12 different offset frequencies from 1 to 50 kHz and 2 flip angles of 450° and 900°. B0 mapping was performed using a dual-echo gradient echo sequence4 with the following parameters: TR, 120ms; TE1/TE2, 2.04/4.08ms; flip angle, 20°; number of averages, 4. B1 maps were acquired using an actual flip angle method5 with the following parameters: TR1/TR2, 40/200ms; TE, 2.4ms; flip angle, 60°; number of averages, 8. T1 mapping was performed using a saturation recovery Snap-FLASH method6. A total number of 60 images were acquired at recovery times from 0 to 18s. Other imaging parameters were: TR, 20ms; TE, 1.8ms; flip angle, 15°; encoding scheme, central; number of averages 1.
Image Analysis. The B0 maps were calculated using the phase difference between the two images at different echo times. The actual flip angle was calculated as arccos((rn-1)/(n-r)), where r and n are the ratios of two magnitude images and their TRs, respectively5. Then the B1 maps were calculated as the ratio between the actual and nominal flip angles. The T1 maps were generated using pixel-wise mono-exponential fitting6.
The qMT parameters in kidney cortex (CO), outer (OM) and inner (IM) medulla were fitted using a two-pool model3,7, in which the free water pool (a) is coupled to the bound pool (b) through magnetization exchange. The observed MR signal can be described by:
$$M_z^a=gM_0^a\left(\frac{R_{b}[\frac{RM_0^a}{R_{a}(1-f)}]+R_{rfb}+R_{b}+RM_0^a}{[\frac{RM_0^af}{R_{a}(1-f)}](R_{b}+R_{rfb})+\left(1+\left[\frac{\omega_{CWPE}}{2\pi\Delta}\right]^{2}\left[\frac{1}{R_{a}T_2^a}\right](R_{rfb}+R_{b}+RM_0^a)\right)}\right)$$
where g is a scan-specific factor, $$$M_0^a$$$ the full magnetization of the free pool, R the magnetization exchange rate, f the bound pool fraction, Ra and Rb the longitudinal relaxation rates of the two pools, Rrfb the bound pool RF absorption rate governed by a super-Lorentzian line shape, ωCWPE the continuous wave power equivalent frequency of the MT pulses, Δ the offset frequency, and $$$T_2^a$$$ the transverse relaxation time of the free pool. The parameter $$$gM_0^a$$$ can be set as the signal intensity at 50 kHz and Rb as 1 s-1. The Rrfb is determined by the transverse relaxation time $$$T_2^b$$$ of the bound pool. Therefore, four combined parameters $$$gM_0^a$$$, $$$T_2^b$$$, $$$\frac{1}{R_{a}T_2^a}$$$, and $$$\frac{f}{R_{a}(1-f)}$$$ are fitted. Then f can be determined using the following equation:
$$R_{a}=\frac{R_{aobs}}{1+\frac{\frac{RM_o^af}{R_{a}(1-f)}(R_{b}-R_{aobs})}{R_{b}-R_{aobs}+RM_o^a}}$$
where Raobs is the measured longitudinal relaxation rate from T1 mapping. The measured B0 and B1 maps were used to correct Δ and ωCWPE respectively.
Results
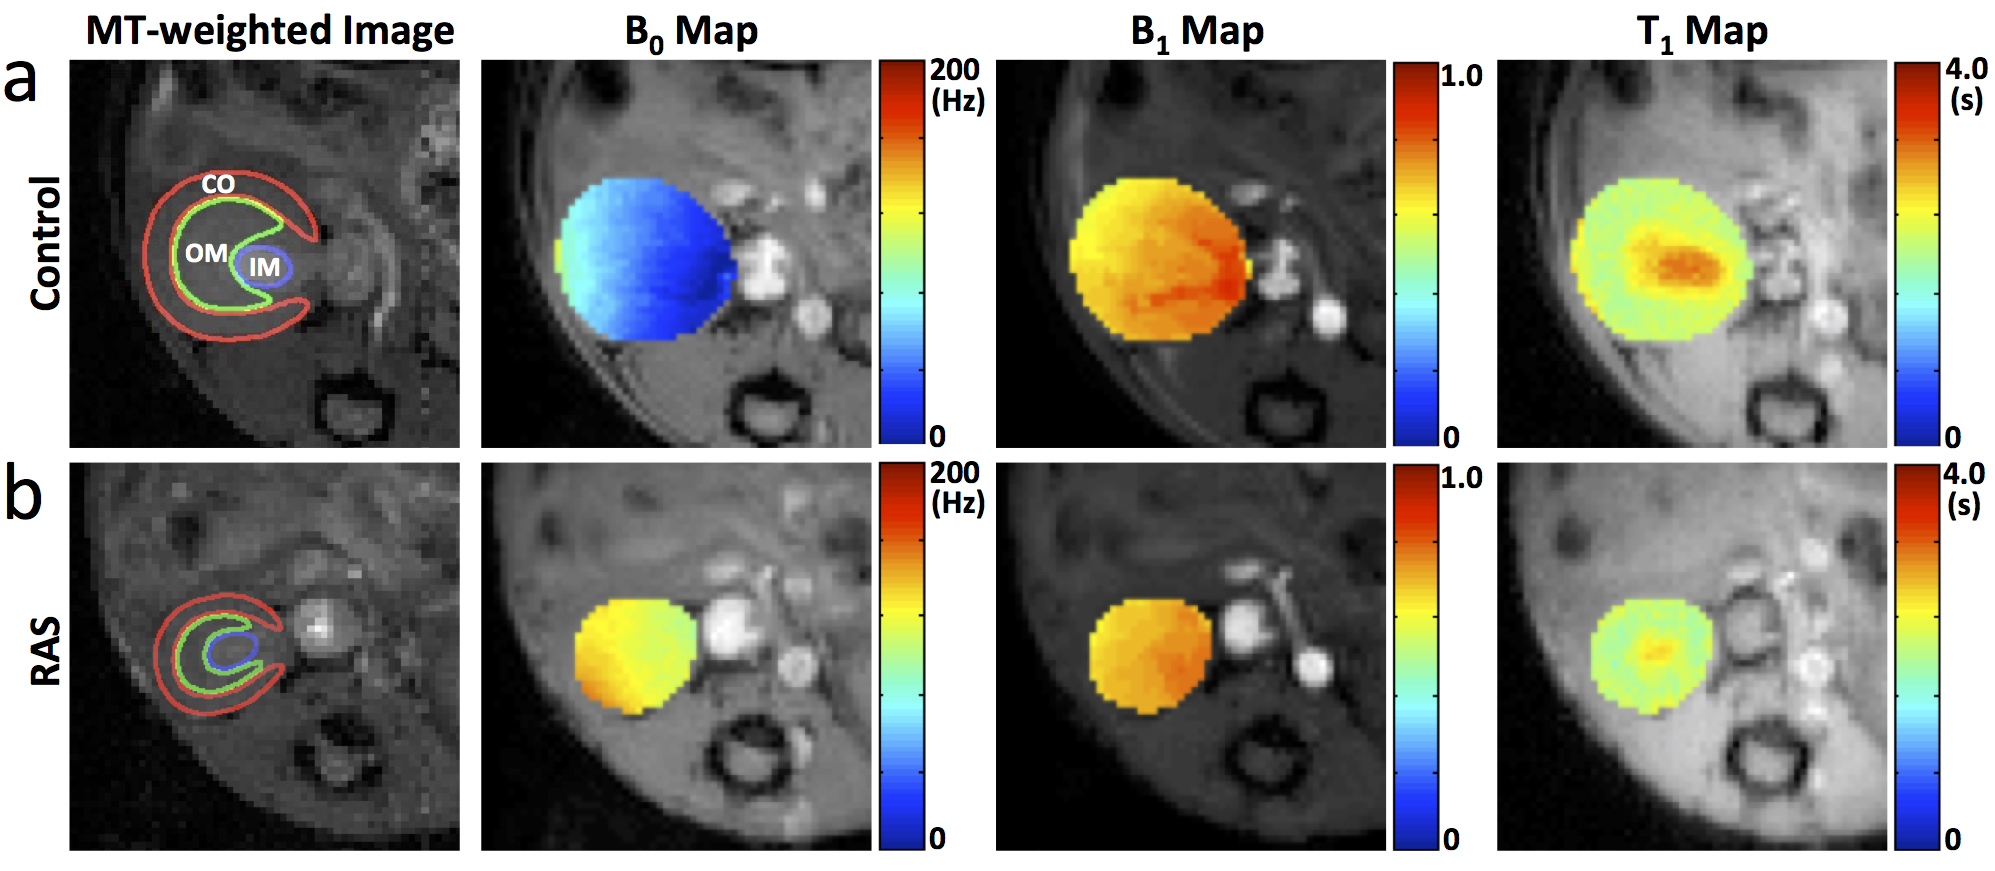
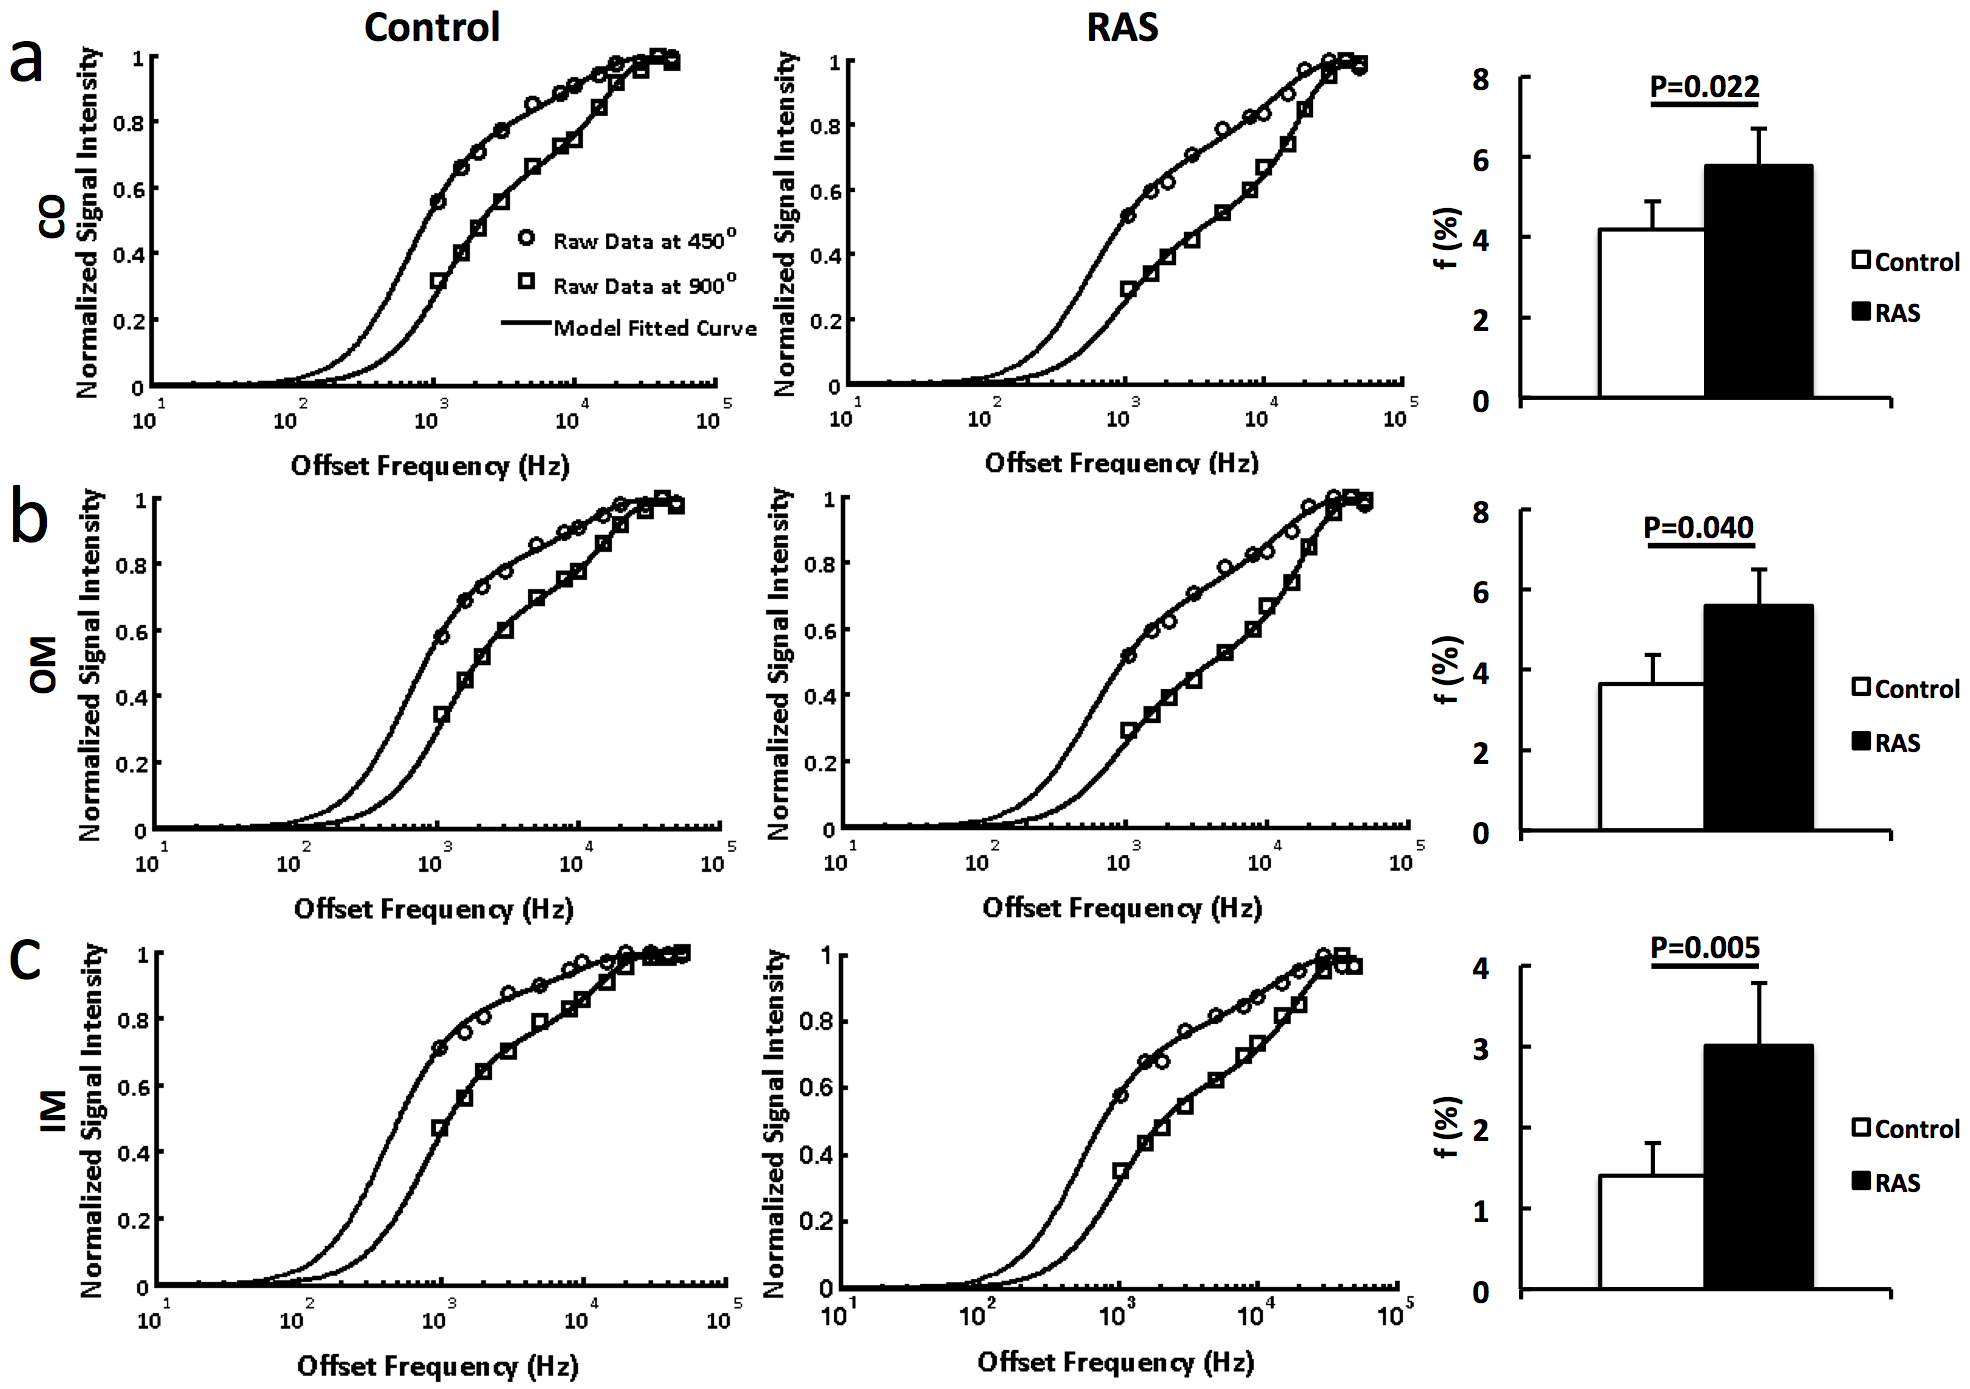
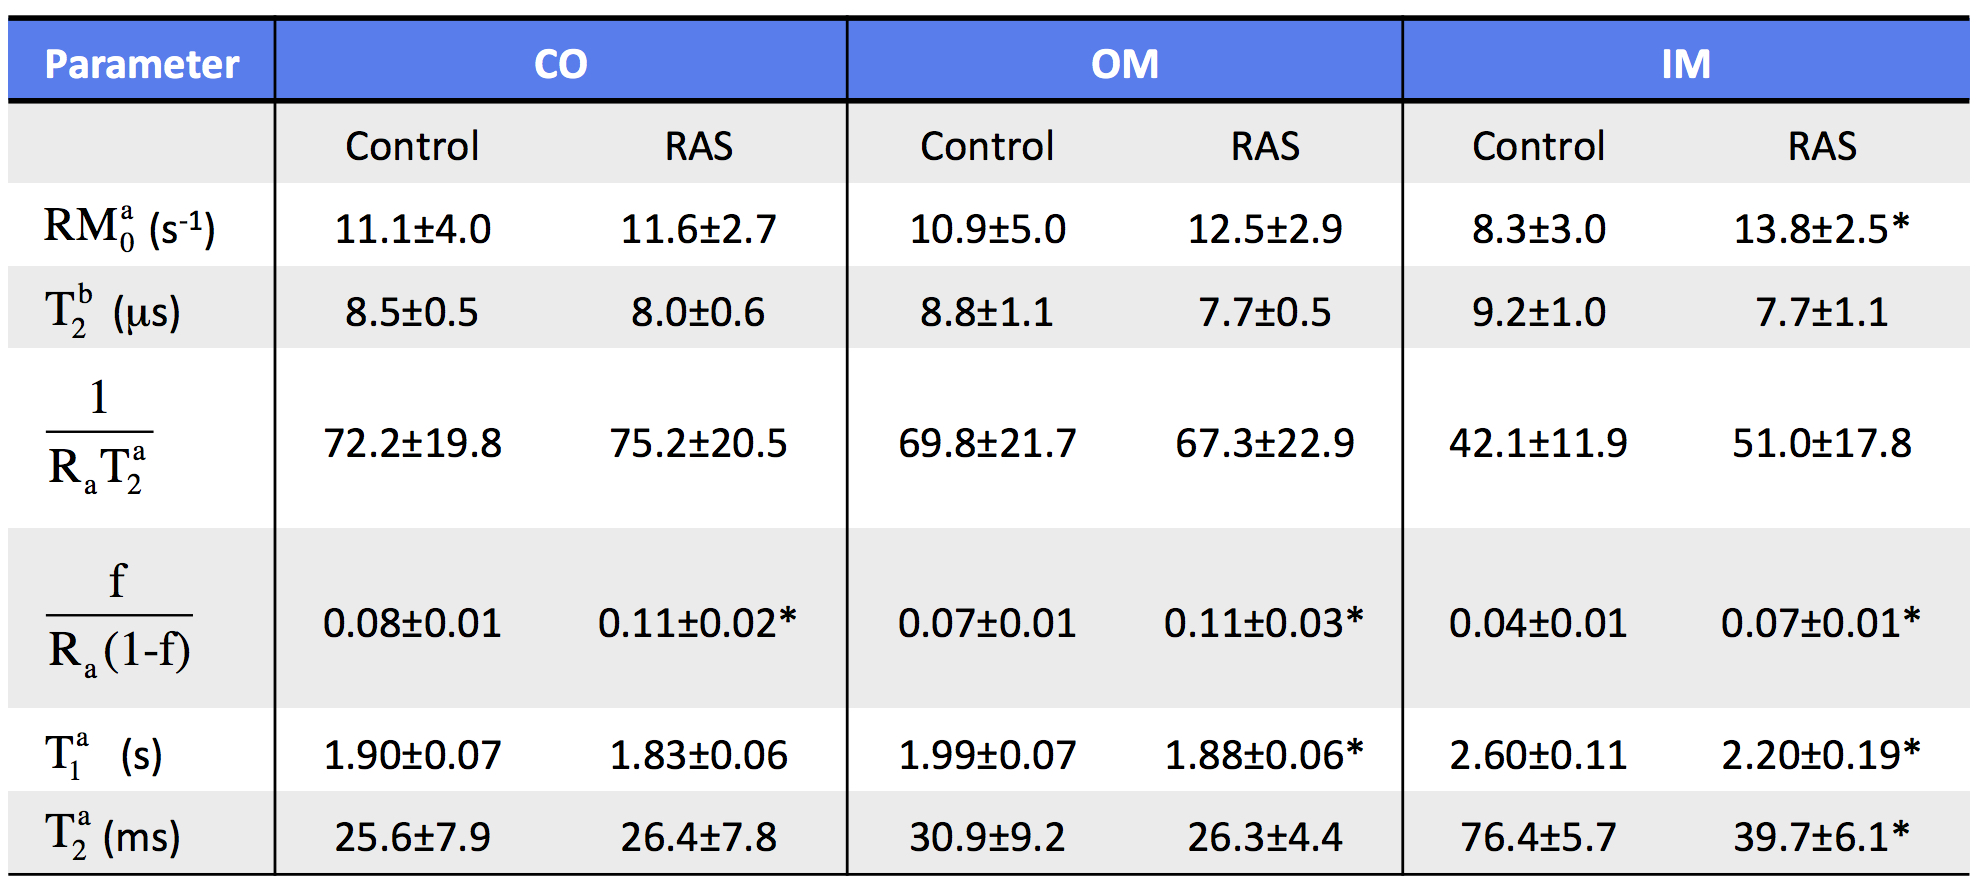
The representative MT-weighted images with manually-traced regions of interests and B0, B1, T1 maps of the control and RAS kidneys are shown in Fig. 1. The measured offset resonance frequency B0 was between -200 and 200Hz. The averaged B1 was approximately 0.7 for both control and RAS kidneys. The measured T1 in IM was significantly lower in RAS vs. Sham kidneys (2.5±0.2 vs. 3.1±0.1 s, P=0.001), possibly as a result of decreased fluid content. Shown in Fig. 2 are the representative experimentally-acquired and model-fitted MT signal intensity curves as a function of offset frequency in the CO (Fig. 2a), OM (Fig. 2b), and IM (Fig. 2c). The measured bound pool fractions were elevated in all three regions of the RAS kidney. Other model-fitted and derived parameters are shown in Fig. 3. The IM of the RAS kidney showed the largest differences, suggesting the greatest changes in tissue content and hemodynamics.Conclusion
Quantitative magnetization transfer imaging detected increased bound pool fraction in mouse kidneys with renal artery stenosis, providing potential new biomarkers for assessment of RAS kidneys. Future studies need to investigate whether these measures linked to development of renal fibrosis.Acknowledgements
This study was partly supported by National Institutes of Health Grants DK104273, DK102325, DK73608, and HL123160.References
1. Jiang K, Ferguson CM, Ebrahimi B, Tang H, Kline TL, Burningham TA, Mishra PK, Grande JP, Macura SI, Lerman LO. Noninvasive Assessment of Renal Fibrosis with Magnetization Transfer MR Imaging: Validation and Evaluation in Murine Renal Artery Stenosis. Radiology 2017;283:77-86.
2. Jiang K, Ferguson CM, Woollard JR, Zhu X, Lerman LO. Magnetization Transfer Magnetic Resonance Imaging Noninvasively Detects Renal Fibrosis in Swine Atherosclerotic Renal Artery Stenosis at 3.0 T. Invest Radiol 2017;52:686-692.
3. Sinclair CD, Samson RS, Thomas DL, Weiskopf N, Lutti A, Thornton JS, Golay X. Quantitative magnetization transfer in in vivo healthy human skeletal muscle at 3 T. Magn Reson Med 2010;64:1739-1748.
4. Skinner TE, Glover GH. An extended two-point Dixon algorithm for calculating separate water, fat, and B0 images. Magn Reson Med 1997;37:628-630.
5. Yarnykh VL. Actual flip-angle imaging in the pulsed steady state: a method for rapid three-dimensional mapping of the transmitted radiofrequency field. Magn Reson Med 2007;57:192-200.
6. Jiang K, Tang H, Mishra PK, Macura SI, Lerman LO. Measurement of Murine Single-Kidney Glomerular Filtration Rate Using Dynamic Contrast-Enhanced MRI. Magn Reson Med 2017.
7. Ramani A, Dalton C, Miller DH, Tofts PS, Barker GJ. Precise estimate of fundamental in-vivo MT parameters in human brain in clinically feasible times. Magn Reson Imaging 2002;20:721-731.
Figures