5110
Phase-locked CEST – Introducing dynamic B0-correction to gagCEST1Center of Biomedical Imaging, New York University Langone Health, New York, NY, United States, 2Magnetic Resonance Center, Max Planck Institute for Biological Cybernetics, Thuebingen, Germany, 3Department of Chemistry, New York University, New York, NY, United States
Synopsis
Even a small frequency drift of less than 1Hz/min of the MRI scanner can have a strong impact on gagCEST measurements. We propose a dynamic B0-correction that tracks the frequency shift using the phase images provided by the GRE readout. We show that this correction eliminates the influence of the frequency drift on gagCEST without the need of additional measurement time allowing higher accuracy, reproducibility, and comparability of gagCEST studies.
Introduction
Chemical Exchange Saturation Transfer (CEST) enables the detection of
glycosaminoglycan (GAG) present in human articular cartilage1, which
represent an early marker of osteoarthritis. For reliable gagCEST analysis exact
B0 mapping and correction are essential2. In this study we
investigates the influence of a frequency drift often observed in a clinical MRI
scanners3,4 on gagCEST. Furthermore, we introduce a dynamic B0-correction method called phase-locked CEST, which utilizes
phase maps extracted from the GRE readout.
Methods
Measurements
were performed in model solution (20 mM D-Glucose, 3.4% Agar, 9 uM Gadoteric
acid) – experiment I – and in vivo in the knee of a 32-year-old healthy
volunteer – experiment II. All measurement were performed on a 7T whole body
scanner (MAGNETOM, Siemens, Germany) using a 28-channel knee coil (QED, USA). For precise B0 mapping four WASABI5
measurements were interleaved with
three identical gagCEST measurements. The gagCEST parameters are: 5 Gaussian-shaped pulses with tp$$$~$$$=$$$~$$$100$$$~$$$ms, B1$$$~$$$=$$$~$$$1.5$$$~$$$μT, DC$$$~$$$=$$$~$$$99%, 41 equally-distributed frequency offsets from -2$$$~$$$ppm$$$~$$$to$$$~$$$2$$$~$$$ppm
(Msat) and 6 far off-resonant offsets at -300 ppm (M0) for improved normalization6.
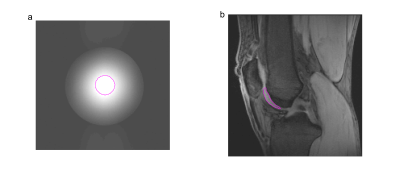
Image acquisition was performed using 3D$$$~$$$GRE$$$~$$$SnapCEST7 with TR$$$~$$$=$$$~$$$4.2$$$~$$$ms, TE$$$~$$$=$$$~$$$2.3$$$~$$$ms, FOV$$$~$$$150$$$~$$$x$$$~$$$140$$$~$$$x$$$~$$$36$$$~$$$mm3, resolution 0.85$$$~$$$x$$$~$$$0.85$$$~$$$x$$$~$$$3$$$~$$$mm3. Evaluation was performed in ROIs shown in Figure 1.
For phase-locked CEST the relative B0 shift is calculated pixel-by-pixel as $$$\delta B_0(t) [ppm] = \frac{\theta(t)-\theta(t_0)}{TE\cdot\omega_0}$$$ from phase maps. Only phase maps of M0 acquisitions were used and two subsequent acquisitions were averaged to reduce noise. After linear extrapolation the relative B0 shift δB0(t) was added to the absolute B0 map from the first WASABI acquisition to create the absolute B0 shift ΔB0(t).
Three different B0-correction methods were compared for the two experiments:
$$$~~~~~$$$1) Time-independent correction using only the B0 map of the first WASABI measurement.
$$$~~~~~$$$2) Time-dependent correction using linear interpolation of all the B0 maps of the WASABI measurements.
$$$~~~~~$$$3) Time-dependent
correction using phase-locked CEST, as described above.
Results
Figure 2 shows representative Z-spectra of articular cartilage and their corresponding MTRasym curves and as a function of a simulated, artificial B0 shift, which changes the gagCEST signal at MTRasym(1.0 ppm) by 53%/ppm (0.18%/Hz).
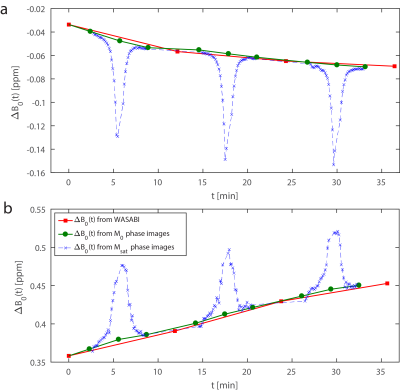
In Figure 3 ΔB0(t) determined by WASABI acquisitions is compared to ΔB0(t) from the new phase-locked CEST approach in experiments I & II. Both methods show very good agreement. The variation of ΔB0 during Msat acquisitions look similar to the direct water saturation in a Z-spectrum, making most Msat phase images unusable for B0-correction. In experiment II ΔB0(t) increased linearly with approx. 0.003 ppm/min (0.9 Hz/min). In experiment I ΔB0(t) decreased with -0.002 ppm/min (-0.6 Hz/min).
Figure
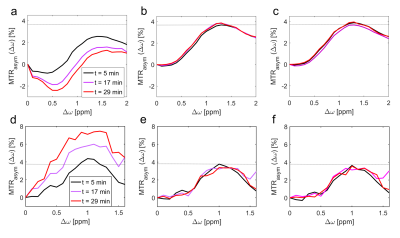
4 shows the comparison of the B0-correction methods 1-3 in
experiments
I & II. MTRasym curves of method 1 show strong time-dependence
(Fig. 4a,d), whereas MTRasym curves of methods 2 and 3 both reduce this variation dramatically. Even the gagCEST value of the first measurement obtained with method 1 deviates about 1% from the gagCEST value obtained with methods 2 and 3 (dotted line).
Discussion
The
steep slope of the direct water saturation in the Z-spectrum around Δω =
1.0 ppm is responsible for the observed high sensitivity on ΔB0. While the small B0 drift measured here is negligible for APT and NOE around $$$\pm$$$3.5 ppm for CEST
effects closer to the water resonance accuracy and reproducibility can be improved if these drifts can be measured and corrected for.
The linear drift observed in experiment II is consistent with linear drifts of 0.003$$$~$$$-$$$~$$$0.005 ppm/min observed in previous experiments on the same scanner. The negative non-linear drift in experiment I may be due to the scanner cooling down from a preceding gradient intensive fMRI experiment.
The origin of the strong phase variation as a function of saturation offset in Msat acquisitions could not be identified yet. Increasing the spoiling time before GRE readout resulted in no change (data not shown).
Using only the M0 acquisitions can be understood as a virtual re-adjustment of the center frequency, thus a real re-adjustment of the center frequency of the scanner before each measurement may also reduce overall ΔB0(t). However, it does not reduce ΔB0(t) within the gagCEST acquisition, which is not negligible as can be seen in Figure 4. Additionally, it is not sure that the scanner adjusts the frequency in the same way as for the B0 map acquisition, introducing further uncertainty to the experiment.
Conclusion
Phase-locked CEST is a simple and robust dynamic B0-correction method allowing higher accuracy, reproducibility, and comparability of gagCEST studies by eliminating errors due to frequency shifts of the MRI scanner. This might be especially relevant for long measurements as well as measurements after gradient-intensive imaging.
Acknowledgements
This work was supported in part by the National Institutes of Health (grants R01EB016045, R01AR067156 and R01AR068966).References
1. Ling W, Regatte R R, Navon G, et al. Proc. Nat. Acad. Sci. USA 2005;105(7):2266-2270
2. Krishnamoorthy G, Nanga Reddy R P, Bagga P, et al. High Quality Three-Dimensional gagCEST Imaging of In Vivo Human Knee Cartilage at 7 Tesla. MRM 2017;7(5):1866-1873
3. Smith A M, Lewis B K, Ruttimann U E, et al. Investigation of Low Frequency Drift in fMRI Signal. NeuroImage 1999;9(5):526-533
4. De Poorter J, De Wagter C, De Deene Y, et al. Noninvasive MRI Thermometry with the Proton Resonance Frequency (PRF) Method: In Vivo Results in Human Muscle. MRM 1995;33(1):74-81
5. Schuenke P, Windschuh J, Roeloffs V, et al. Simultaneous Mapping of Water Shift and B1 (WASABI) - Application to Field-Inhomogeneity Correction of CEST MRI Data. MRM 2017;77(2):571-580
6. Jones C K, Huang A, Xu J, Edden R AE, et al. Nuclear Overhauser enhancement (NOE) imaging in the human brain at 7 T. NeuroImage 2013;77:114-124
7. Zaiss M, Ehses P, Scheffler K, et al. snapCEST - A single-shot 3D CEST sequence for motion corrected CEST MRI. Proc. ISMRM 2017;25:3768
Figures


