5109
APT-CEST post Gadolinium. Should it be avoided? Comparison of pre- & post-Gadolinium CEST on glioma at 3T.1Centre for Medical Imaging, UCL, london, United Kingdom, 2Medical school, UCL, london, United Kingdom, 3High Field Magnetic Resonance, Max Plank Institute, Tubinghen, United Kingdom, 4Institute of Nuclear Medicine, UCLH, London, United Kingdom, 5Teenage Cancer Unit, UCLH, london, United Kingdom
Synopsis
This study compares APT-CEST between pre- and post-gadolinium in patients with gliomas at 3T, and evaluates the feasibility of performing CEST after administration of T1 contrast. The results of the study demonstrate that Gd administration does not significantly affect the quality of the APT-CEST image, encouraging the acquisition of CEST data, even after the administration of T1 contrast agents.
Introduction
In the last few years, chemical exchange saturation transfer (CEST) imaging has emerged as a metabolic marker for MRI, with great promise in the field of neuro-oncology. APT-CEST has shown to correlate with tumour grading1 as well as to provide useful clinical information such as differentiation of radiation necrosis from tumour recurrence2. Tissue relaxation can alter APT-CEST contrast and as such the recommendation is to perform it prior the administration of contrast agent3,4 However, this can be practically difficult as clinical exams tend to be prioritised over changes in protocol for research. Some MRI vendors require modification of the scanner software to run CEST sequences, which further complicates the inclusion of CEST half way through the clinical exam. This study compares APT-CEST between pre- and post-gadolinium in patients with gliomas at 3T, and evaluates the feasibility of performing CEST after administration of T1 contrast.Methods
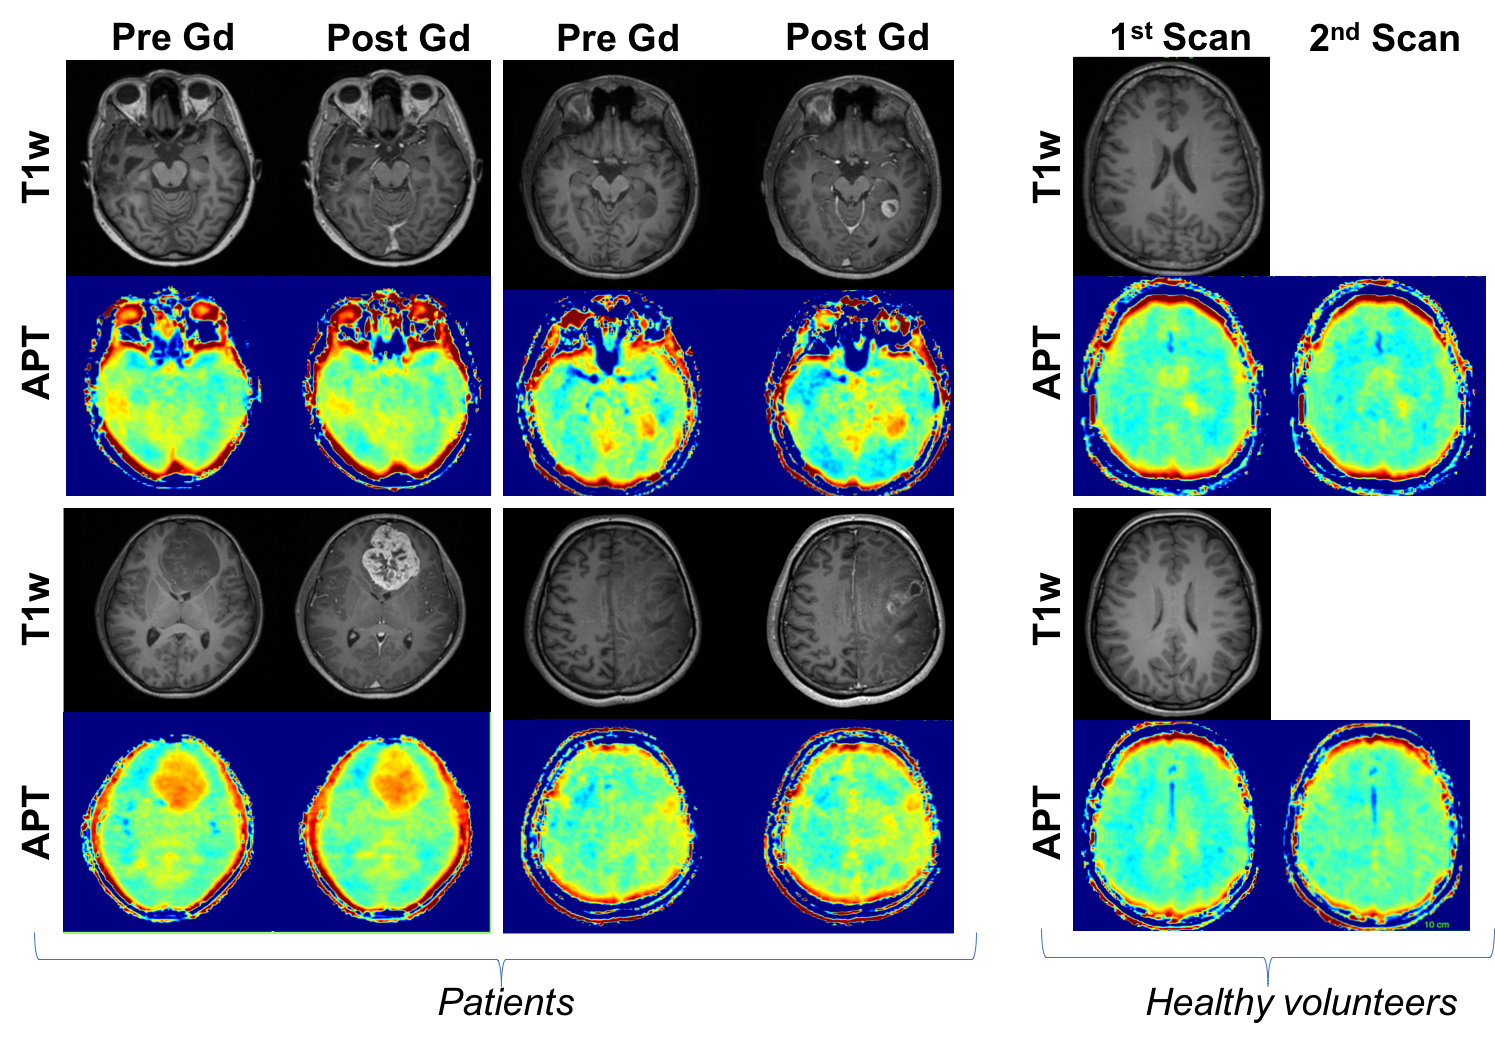
Patients: Seven patients with suspected glioma were recruited with inform consent for APT-CEST pre- and post- Gadolinium (Gd). Three patients underwent follow up imaging with a total of 11 studies included for analysis. Volunteers: Nine healthy volunteers were also recruited to assess repeatability of APT within subjects. Time between APT-CEST scans was identical as in patients but no Gd was administrated. All studies were conducted on a Siemens mMR biograph. APT-CEST was acquired with a gradient echo based snapCEST acquisition5, where a 3s (50% duty cycle) was used at two different powers (B1 = 0.75, 1.25μT) for B1 correction. A WASAB1 scan6 was also acquired for field homogeneity corrections. APT-CEST was calculated as the normalised asymmetry at 3.5ppm and corrected for both B0 and B1 field inhomogeneity7. T1 maps were acquired with an inversion recovery method (TI=0.1s, 0.235s, 0.550s, 1.3s, 3s and 7s, TR=10s) using the same readout as for APT-CEST. Analysis: In patients, regions of interest (ROI) of the ‘non-enhancing’, ‘enhancing’ and ‘necrotic core’ in the tumour and healthy ‘white matter’ (WM), were segmented from T2w-FLAIR and T1w-postGd images (Figure 1). In volunteer subjects WM was segmented from the T2w-FLAIR. For all ROIs, APT-CEST signal was compared pre- and post- Gd. Bland Altman plots and histogram analysis was performed for both APT-CEST and quantitative T1 maps. In order to assess the effect of Gd in APT-CEST, the normal variation was estimated from the healthy volunteer cohort.Results
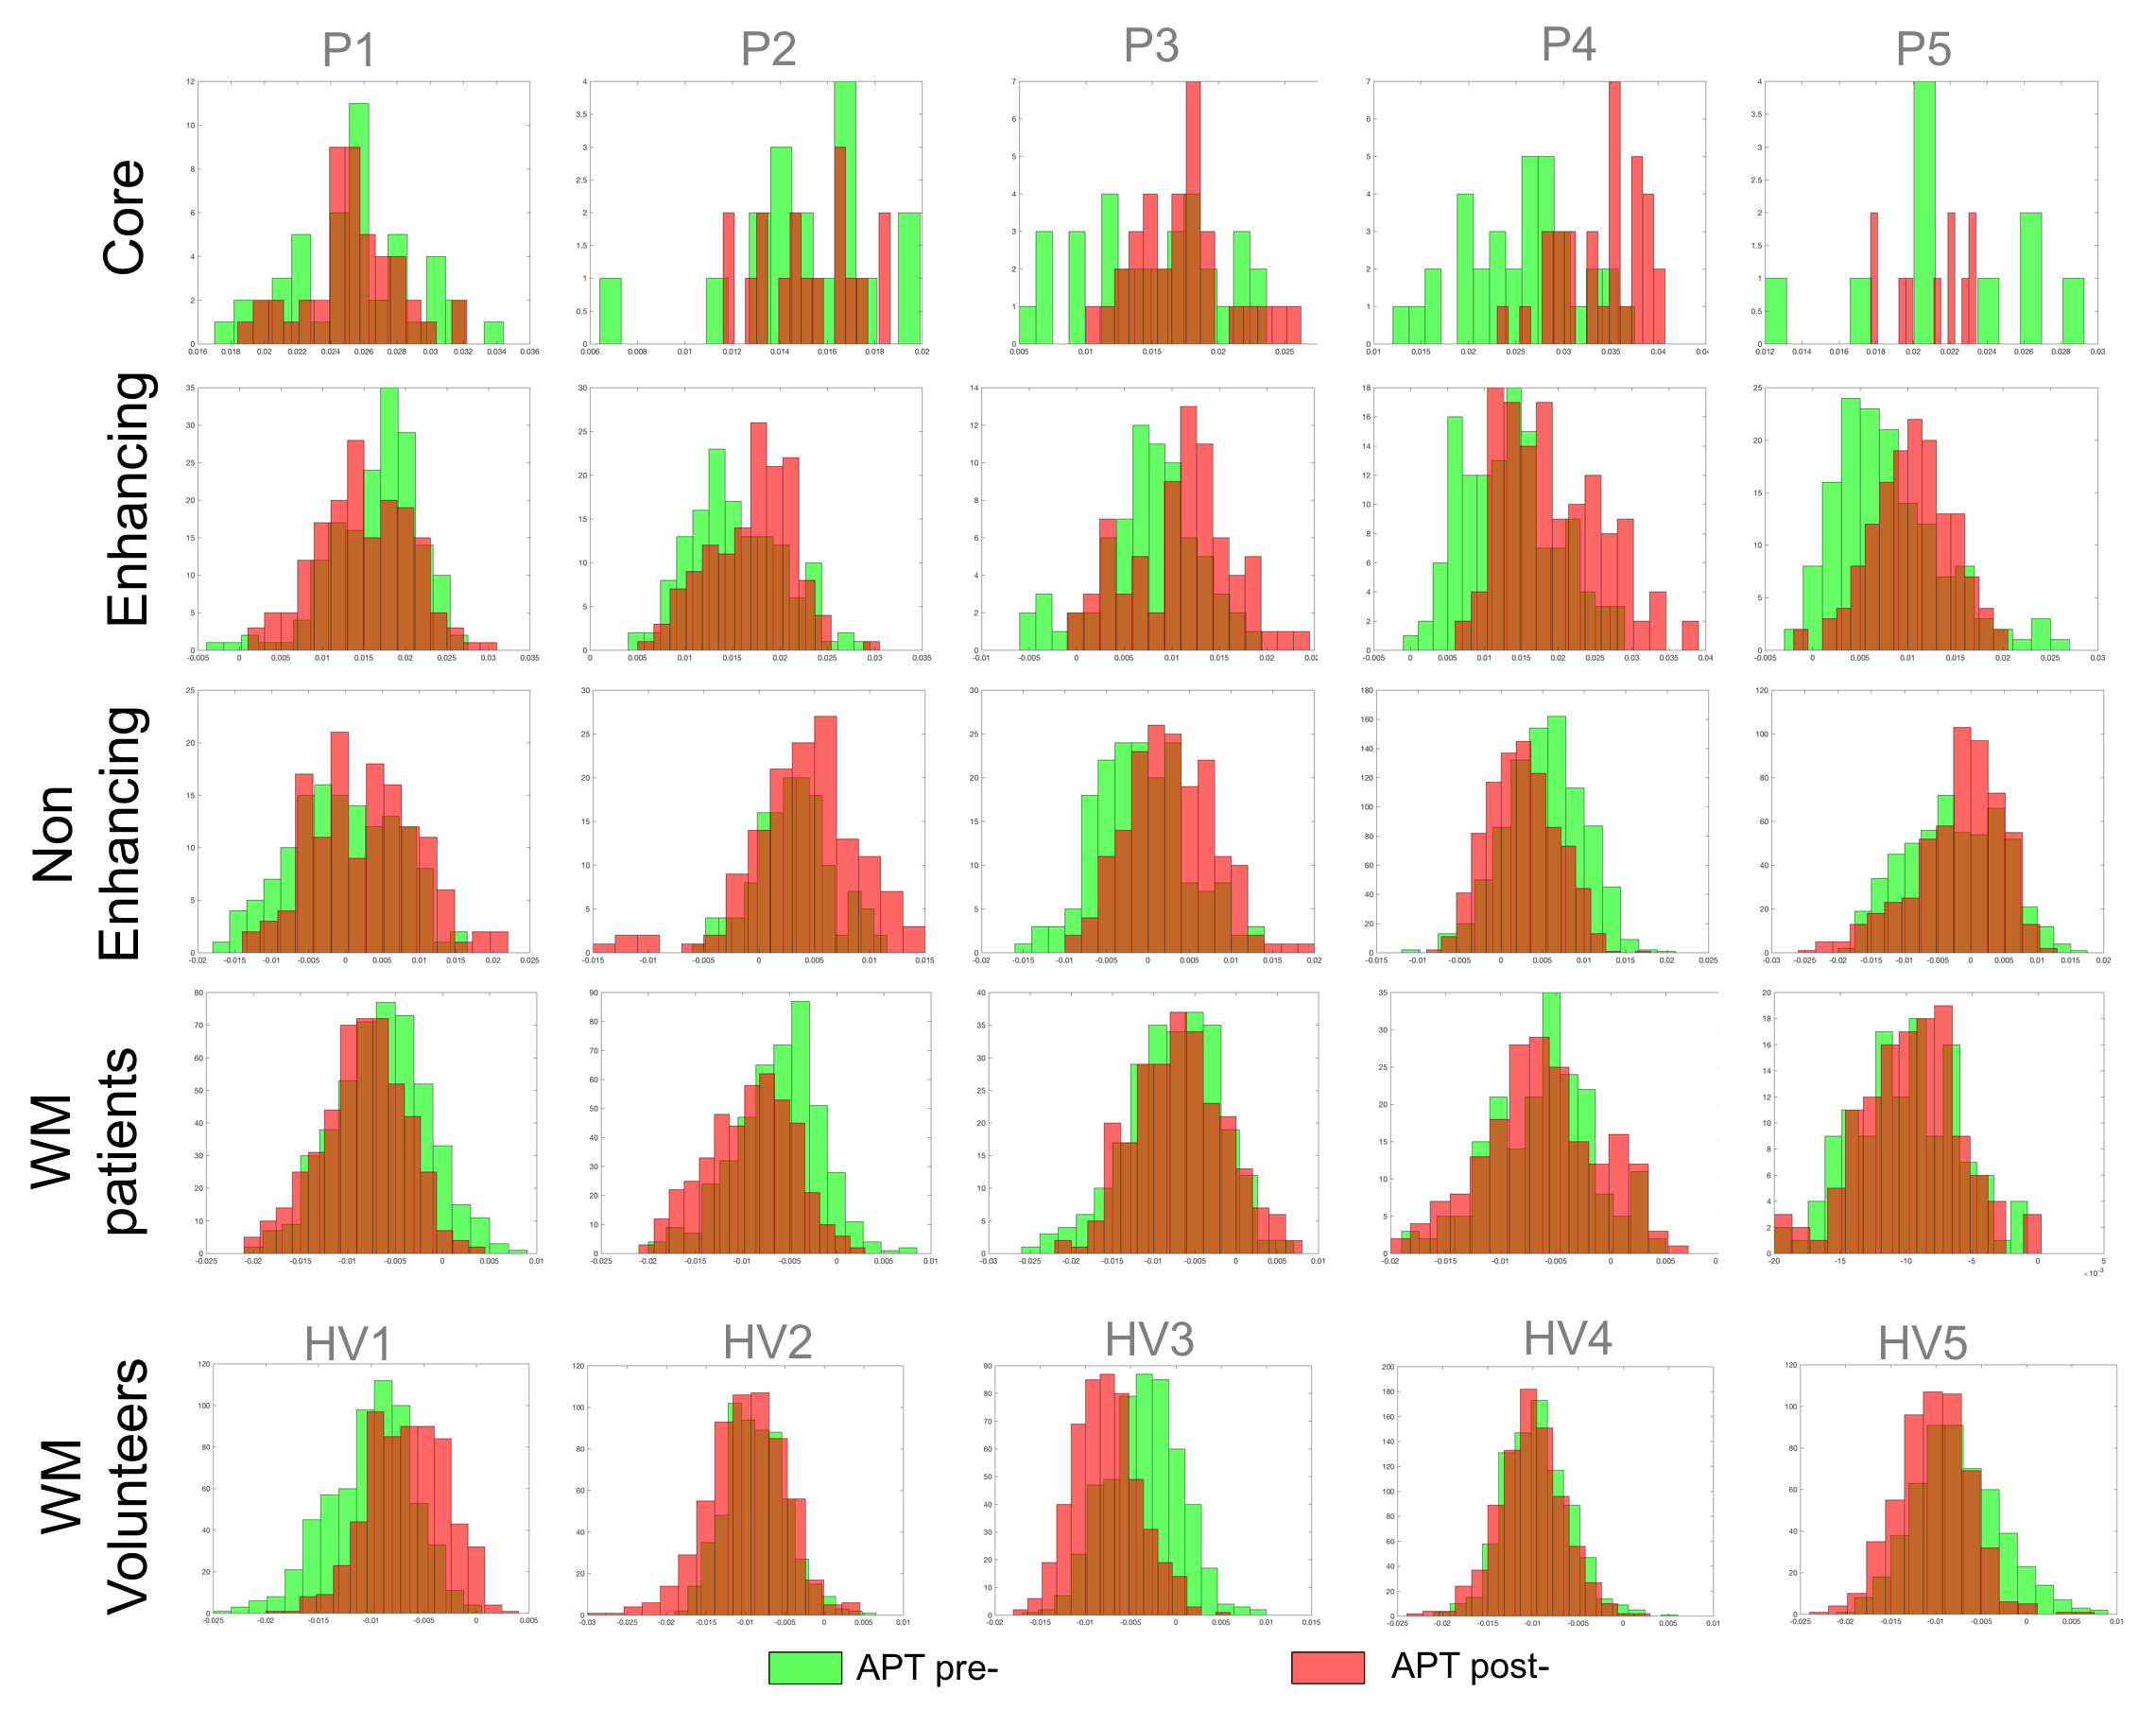
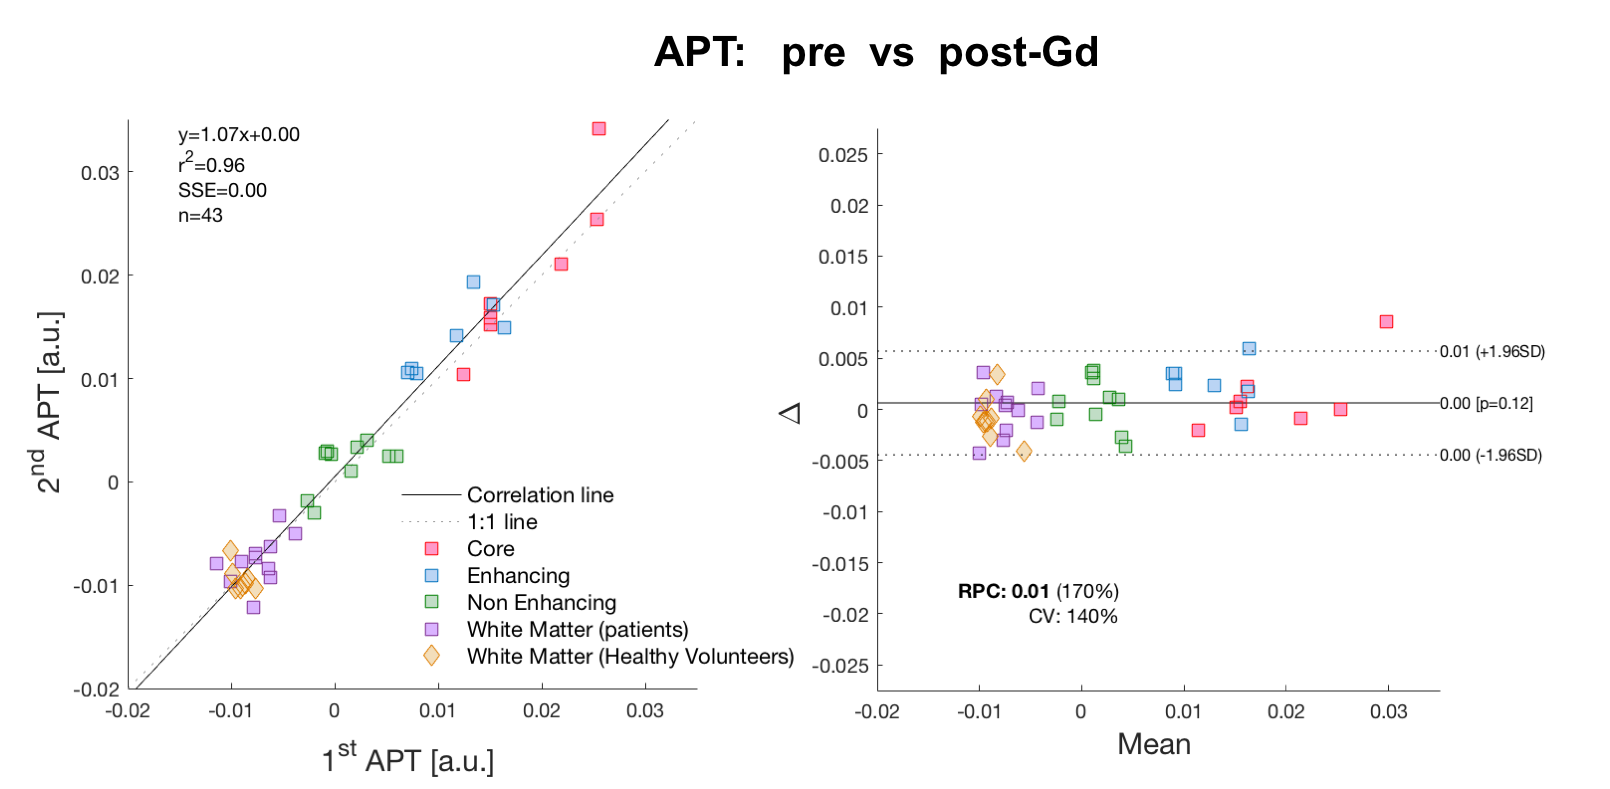
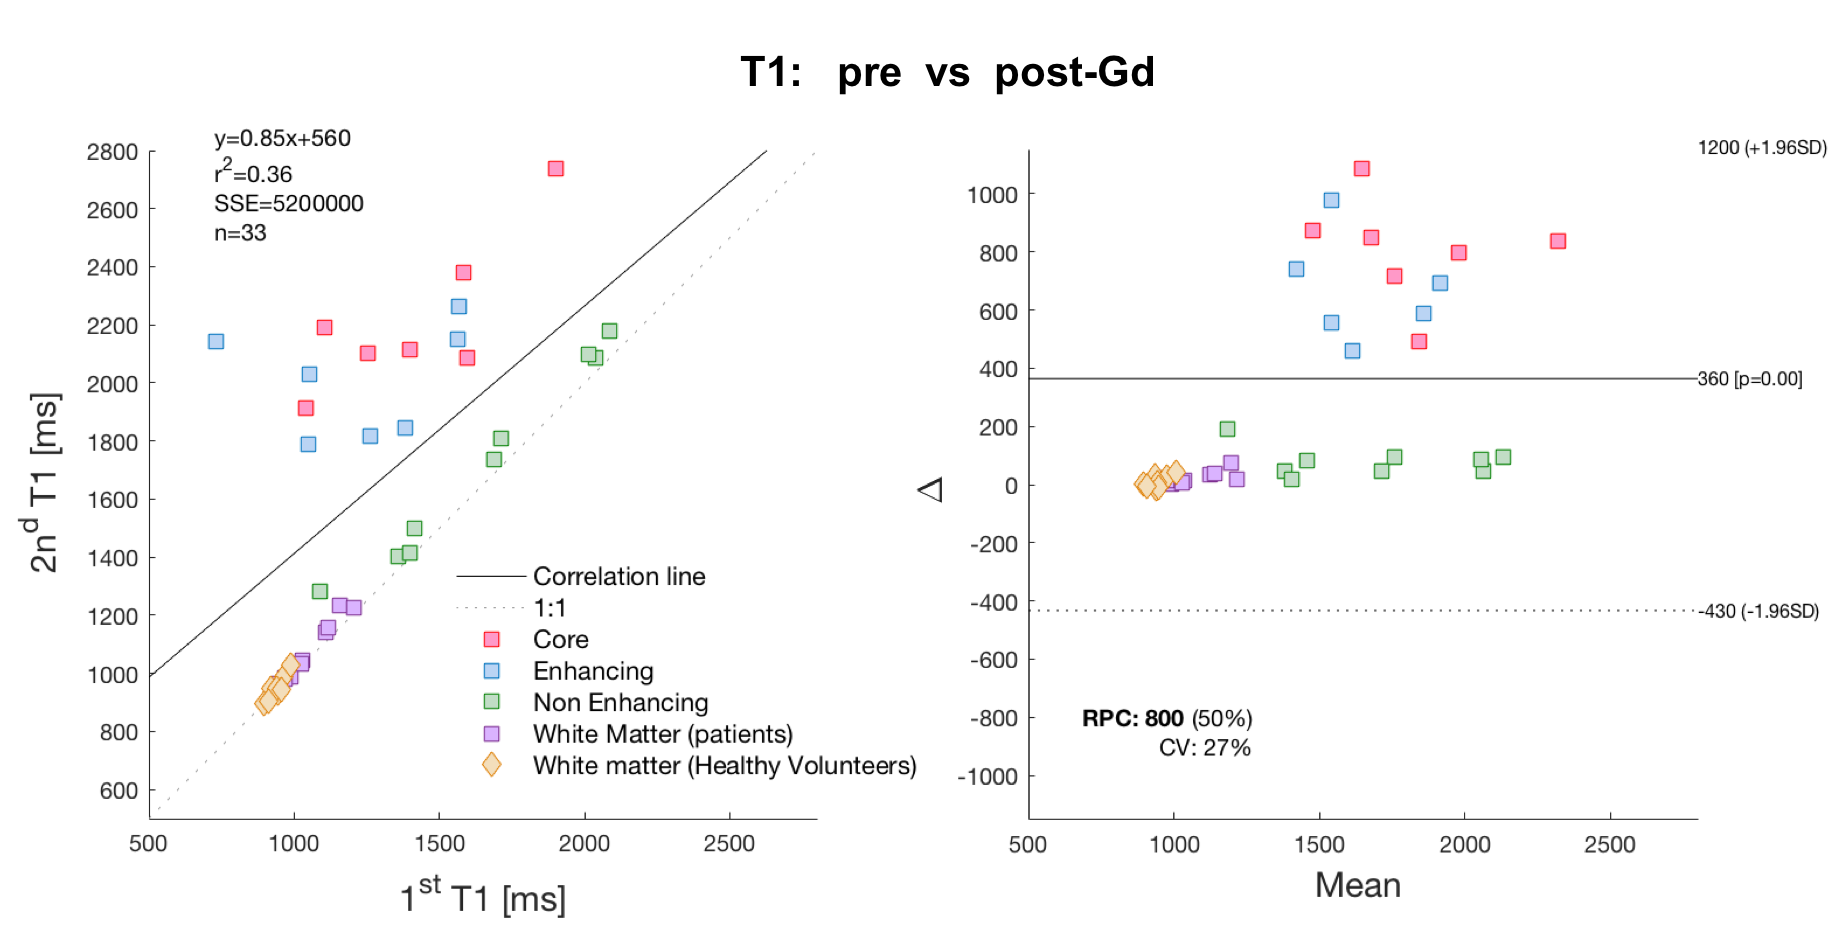
Pre- and post- Gd APT-CEST images displayed very similar features, highlighting the same areas of the brain in both scans. The range of contrast in different gliomas that APT- CEST was able to produce remained mostly unaffected post administration of Gd as seen in figure 1. ROI based histogram analysis in figure 2 illustrates the variation pre- and post- contrast in the APT-CEST. All ROIs (in rows) show extensive overlap between the two time-points. Pairwise t-test on the mean signal of each patient in different ROIs revealed no significant difference (p>0.05) in the core, non-enhancing and WM regions. Low significant difference (p<0.05) was found in the enhancing tumour region (row 2). A near identity (1:1) correlation was found between the pre- and post- Gd APT-CEST scans (y=1.07x+0.00, r2 = 0.96, n= 43) as shown in figure 3 (left). Based on the contrast required to differentiate WM versus non-enhancing lesions, the ‘maximum allowed difference’ for APT was set at ±0.005. With this limit the Bland-Altman plot (figure 3, right) shows a 95% agreement between pre- and post scans (41 out of 43 points). Healthy volunteers display the same degree of variation as patients with Gd administration. In contrast, the scatter plot of the quantitative T1 (figure 4), show both enhancing and core regions to be severely biased due to the Gd administration with a mean difference of 700ms.Discussion and Conclussion
The consistency of the APT-CEST even in regions with significant T1 reduction post Gd, supports the idea that the APT signal originates mostly from the intracellular volume, where Gd does not permeate. Further quantitative analysis would need to account for the blood volume (an interstitial space in cases of blood brain barrier leakage) in order to accurately estimate the impact of Gd in the APT contrast. Nonetheless, the results of this study demonstrate that Gd administration does not significantly affect the quality of the APT-CEST image, encouraging the acquisition of CEST data, even after the administration of T1 contrast agents.Acknowledgements
No acknowledgement found.References
1. O Togao, T Yoshiura, J Keupp, et al. Amide proton transfer imaging of adult diffuse gliomas: correlation with histopathological grades. Neuro-Oncology 2014; 16(3): 441–8
2. Wang S 1 , Tryggestad E , Zhou T , Assessment of MRI parameters as imaging biomarkers for radiation necrosis in the rat brain.International Journal of Radiation Oncology, Biology, Physics [05 Apr 2012, 83(3):431-6
3. Y Kai Tee, MJ Donahue, GWJ Harston, et al. Quantification of Amide Proton Transfer Effect Pre- and Post gadolinium contrast agent administration. JMRM 2014; 40:832-838
4. L Hua, X Zhang, X Jiang, et al. correction in amide proton transfer imaging: indication of the influence of transcytolemmal water exchange on CEST measurements. NMR Biomed. 2015; 28: 1655–1662
5. M Zaiss, P Ehses and K Scheffler. SnapCEST- A single shot 3D CEST sequence for motion correction CEST MRI. Proceeding of ISMRM, Hawaii, 2017
6. P Schuenke, J Windschuh, V Roeloffs et al. Simultaneous mapping of water shift and B1 (WASABI)-application to field inhomogeneity correction of CEST MRI data. Magn Reson Med 2017; 77(2):571-80
7. J Windschuh, M Zaiss, J Meissner, et al. Correction of B1 inhomogeneities for relaxation-compensated CEST imaging at 7T. MR in Biomed 2015; 28(5): 529-37
Figures