5108
Toward CEST MRI of renal masses: protocol optimization and first preliminary data1Radiology Department, University of Texas Southwestern Medical Center, Dallas, TX, United States, 2Biomedical Engineering, University of Texas Dallas, Dallas, TX, United States, 3Advanced Imaging Research Center, University of Texas Southwestern Medical Center, Dallas, TX, United States, 4Philips Research, Hamburg, Germany, 5Philips Healthcare, Gainesville, FL, United States
Synopsis
Chemical Exchange Saturation Transfer (CEST) MRI is emerging as a tool for the studies of human malignancy. However, the translation of CEST into a successful tool for renal cancer characterization has been slow and hampered by technical difficulties associated with body imaging, such as motion, contaminating lipid signals and increased B0 ingomogeneity. Here we optimize CEST protocol for characterization of renal masses and demonstrate CEST measurements are feasible in kidneys using combination of motion synchronization, post-processing registration and lipid artifact removal. In addition, first Renal Cell Carcinoma patient CEST-mDixon data is shown and imaging results are correlated with the pathology.
INTRODUCTION
The role of MRI in the evaluation of kidney diseases, including renal cancer, continues to expand. The development of non-invasive quantitative MRI techniques aims to provide objective information about changes in tumor biology, especially prior to changes in size or morphology. This may be particularly advantageous in patients with renal masses, such as those undergoing active surveillance.
Chemical Exchange Saturation Transfer (CEST) MRI is emerging as a tool in the clinical and preclinical studies of malignancy1-2. However, the translation of CEST into a successful imaging tool for body, specifically for renal cancer has been slow and hampered by technical difficulties typically associated with body imaging. Specifically, the presence of contaminating fat signals, physiological motion, and large B0 inhomogeneities, that are more pronounced in the body, challenge the CEST data acquisition
Here we focus on optimizing the protocol for characterization of renal masses with CEST. First, we incorporate advances in motion synchronization and post-processing with effective fat separation. We combined guided breathing and post-processing motion correction with Turbo-Spin Echo (TSE) or multi-point Dixon Turbo-Field Echo (mDixon-TFE) acquisition3. The results of TSE and mDixon-TFE are compared. Next, we aim to use the optimized protocol in a group of Renal Cell Carcinoma (RCC) patients prior to nephrectomy and correlate the results of CEST with the gold standard pathology results. To the best of our knowledge this is the first application of CEST to RCC.
METHODS
All the experiments were conducted on the 3T Philips Ingenia scanner using a 32-channel torso array coil. Seven healthy volunteers and one renal cancer patient prior to nephrectomy were scanned, with IRB approval and written informed consent. The CEST saturation train consisted of 40 Sinc-Gauss RF pulses, 50msec each (total saturation length of 2 sec)4. Guided-breathing5 was used during acquisition to minimize the motion. Z -spectra data was obtained using 12 saturation frequency offsets in the range ±6 ppm and three B1rms power levels (0.7 μT ,1.2 μT , 1.6μT). CEST-TSE acquisition: Coronal FOV = 300 × 362 mm2, voxel size = 2.0 × 2.0 mm2, slice thickness = 5 mm, 2D single shot TSE, TR/TE = 6000/4.9 ms. Separate GRE-based B0 mapping was used to correct B0 inhomogeneities in the TSE acquisitions. CEST-mDixon acquisition parameters: Coronal FOV = 300 × 360 mm2, voxel size = 3.0 × 3.0 mm2, slice thickness = 5 mm, 2D single shot TFE, TR/TE1/DTE = 3.3/0.94/0.6 ms. A 3-point mDixon acquisition was used, which generated the following images: water-only, fat-only and B0 map for each frequency. All images were further post-processed for motion correction using Structuralized Mutual Information (SMI) algorithm6.RESULTS AND DISCUSSION
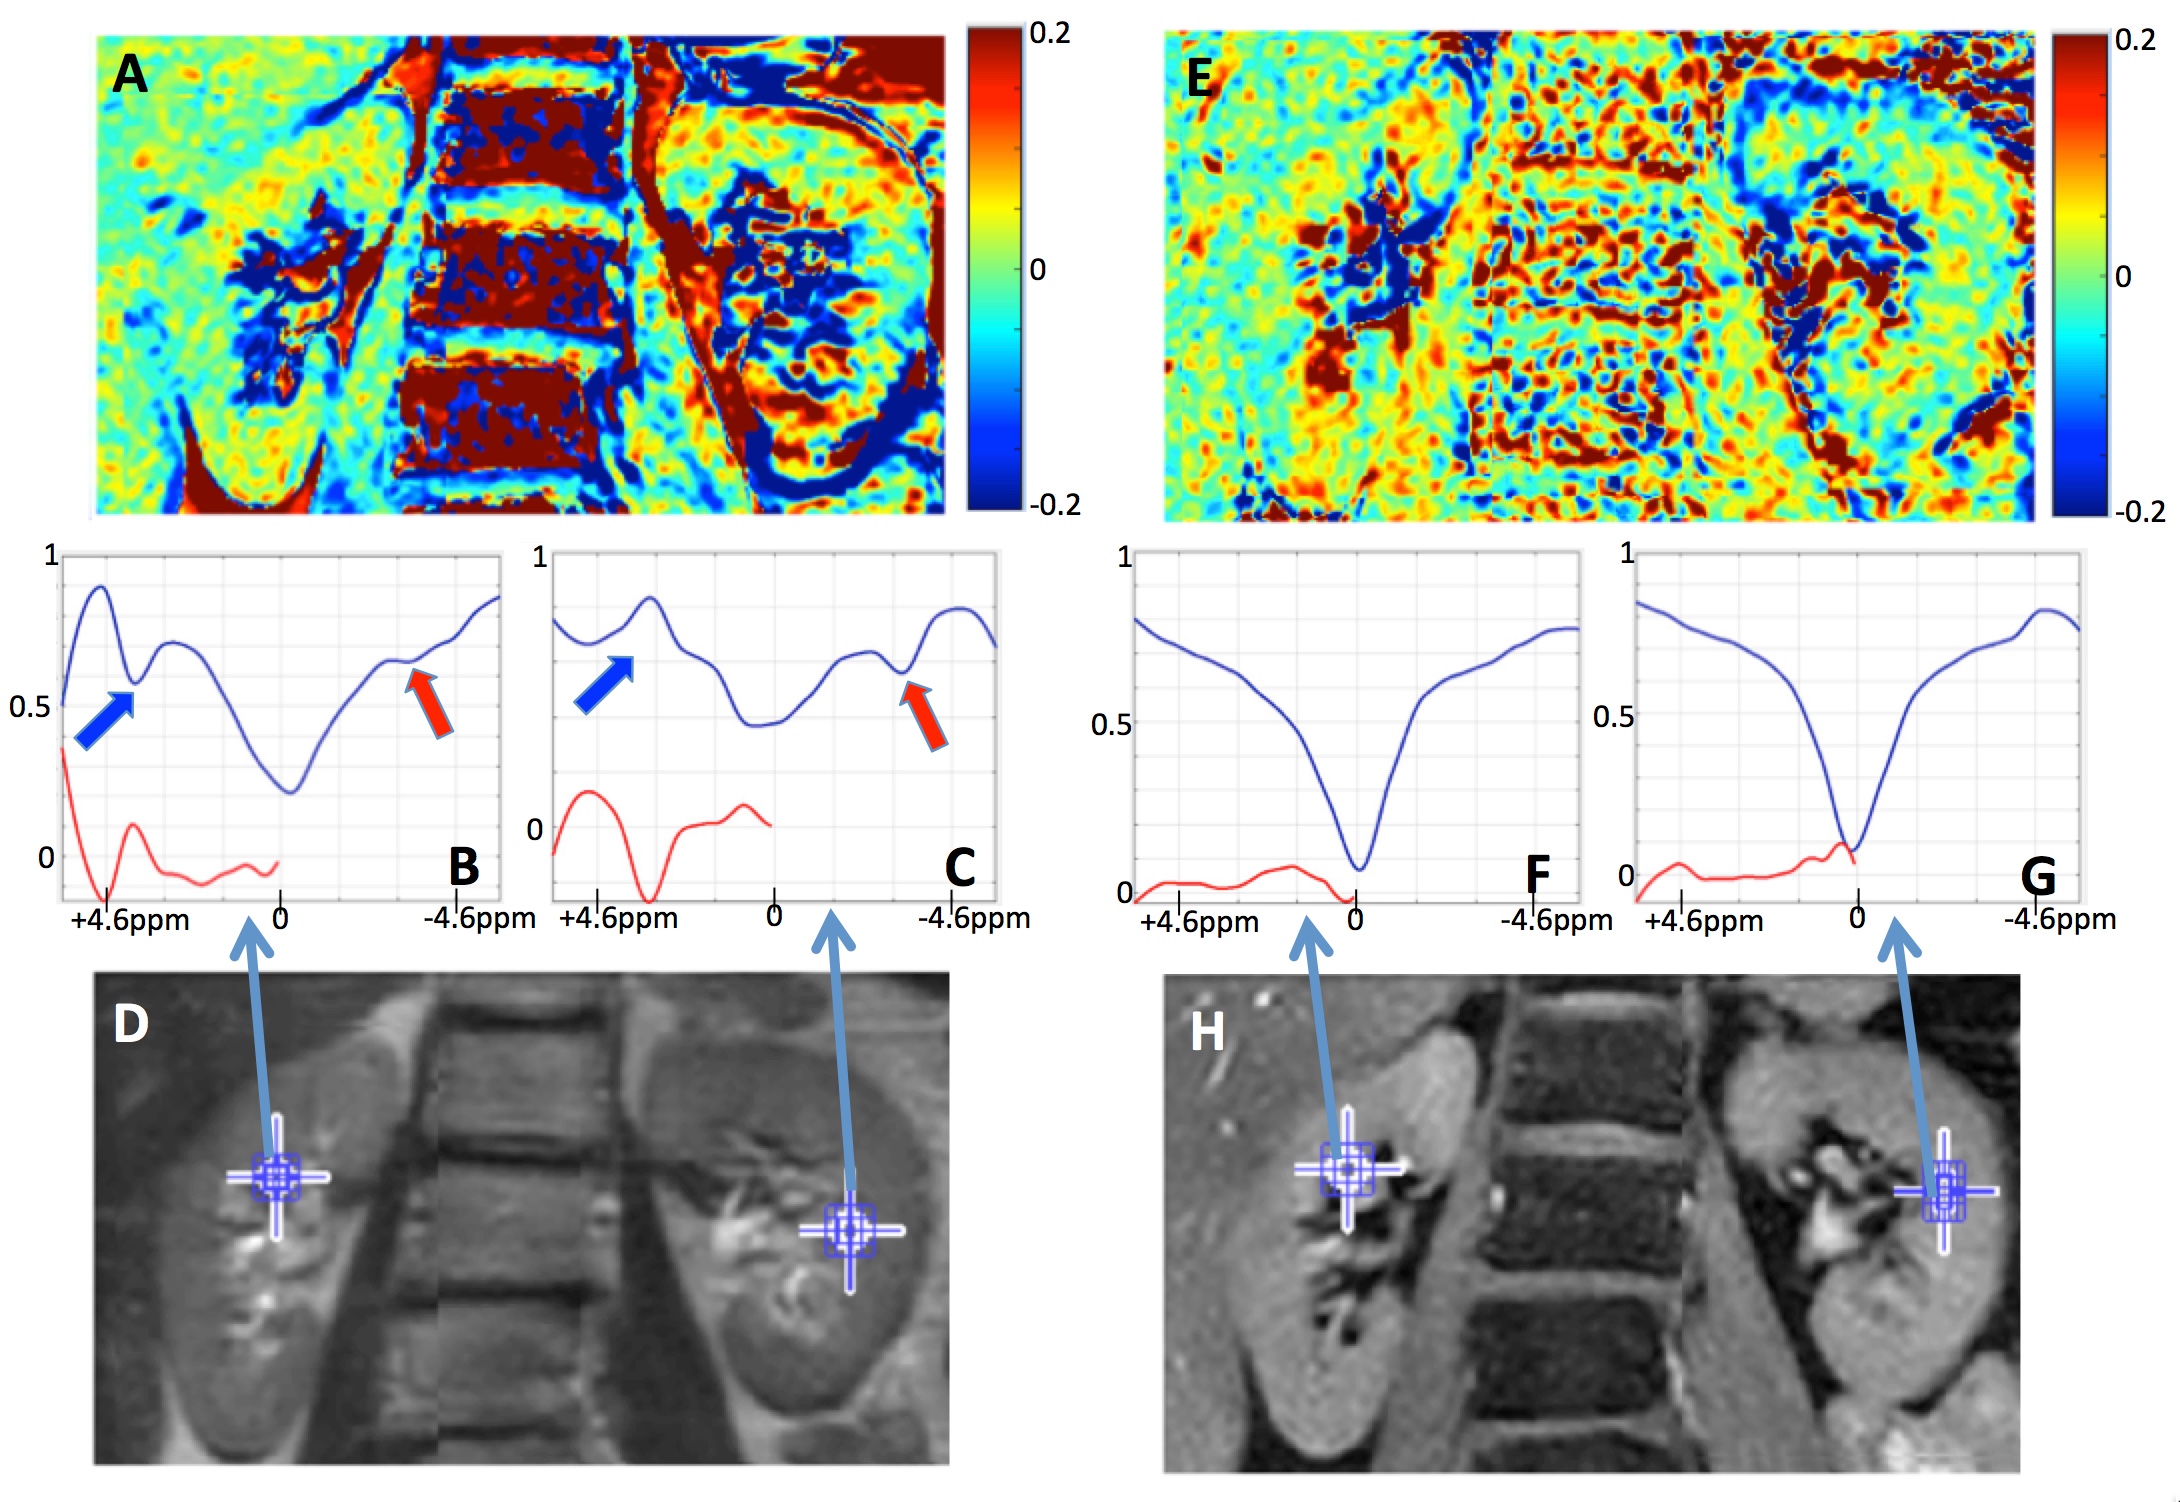
Figure 1 compares representative MTRasym(2ppm) maps and Z-spectra from the data acquired using TSE (A-D) and mDixon (E-H) at B1rms=1.2 μT. The TSE acquisition offered increased overall SNR, however Z-spectra were contaminated by the lipid presence (red arrows). The nature of the large peaks in CEST-TSE at +3.5ppm (blue arrows) is under investigation, as they do not appear in CEST-mDixon Z-spectra. Since they are too narrow for amide peaks lines (typical for this region), they could potentially be attributed to amide signals from protein molecules extracted in urine. Overall, CEST-mDixon generates smoother Z-spectra (Fig.1B-C vs Fig.1F-G), by successfully removing lipid artifacts. Moreover, embedded acquisition of B0 map saves time and removes uncertainties associated with separate B0 acquisition (due to motion or dynamic changes), leading to a more robust experiment.
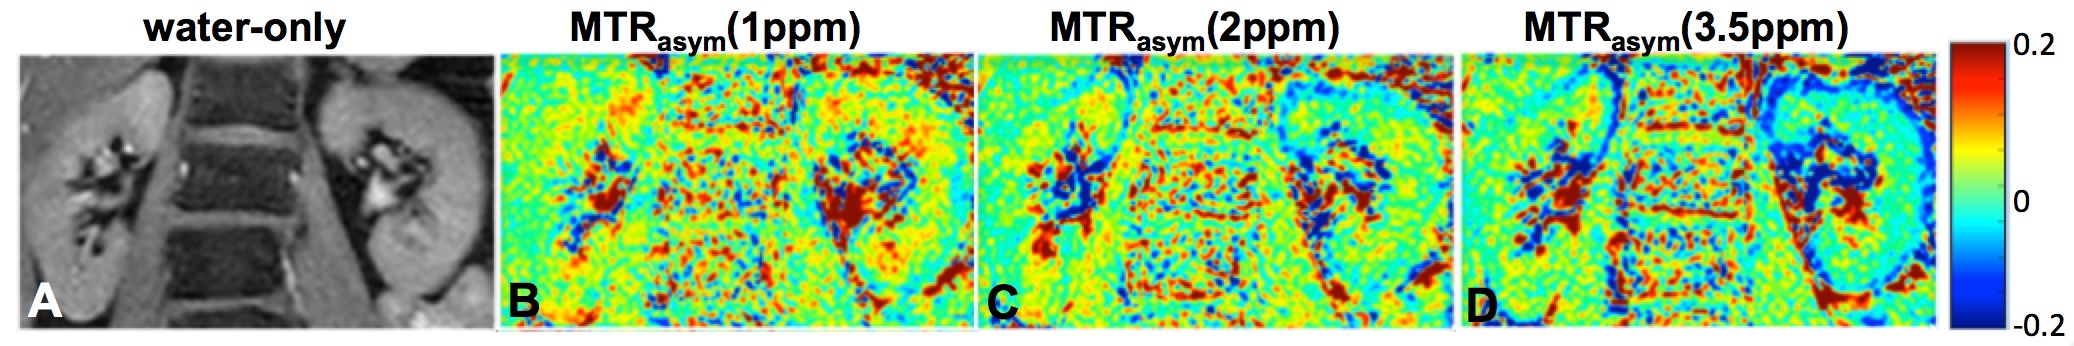
Figure 2 shows MTRasym at different frequency ranges: 1ppm, 2ppm and 3.5ppm corresponding to weighting by –OH, -NH2 and –NH chemical groups, respectively. The highest CEST is observed at 1ppm and 2ppm, with 2ppm possibly assigned to contributions from urea7-8 (see also Fig.1F).
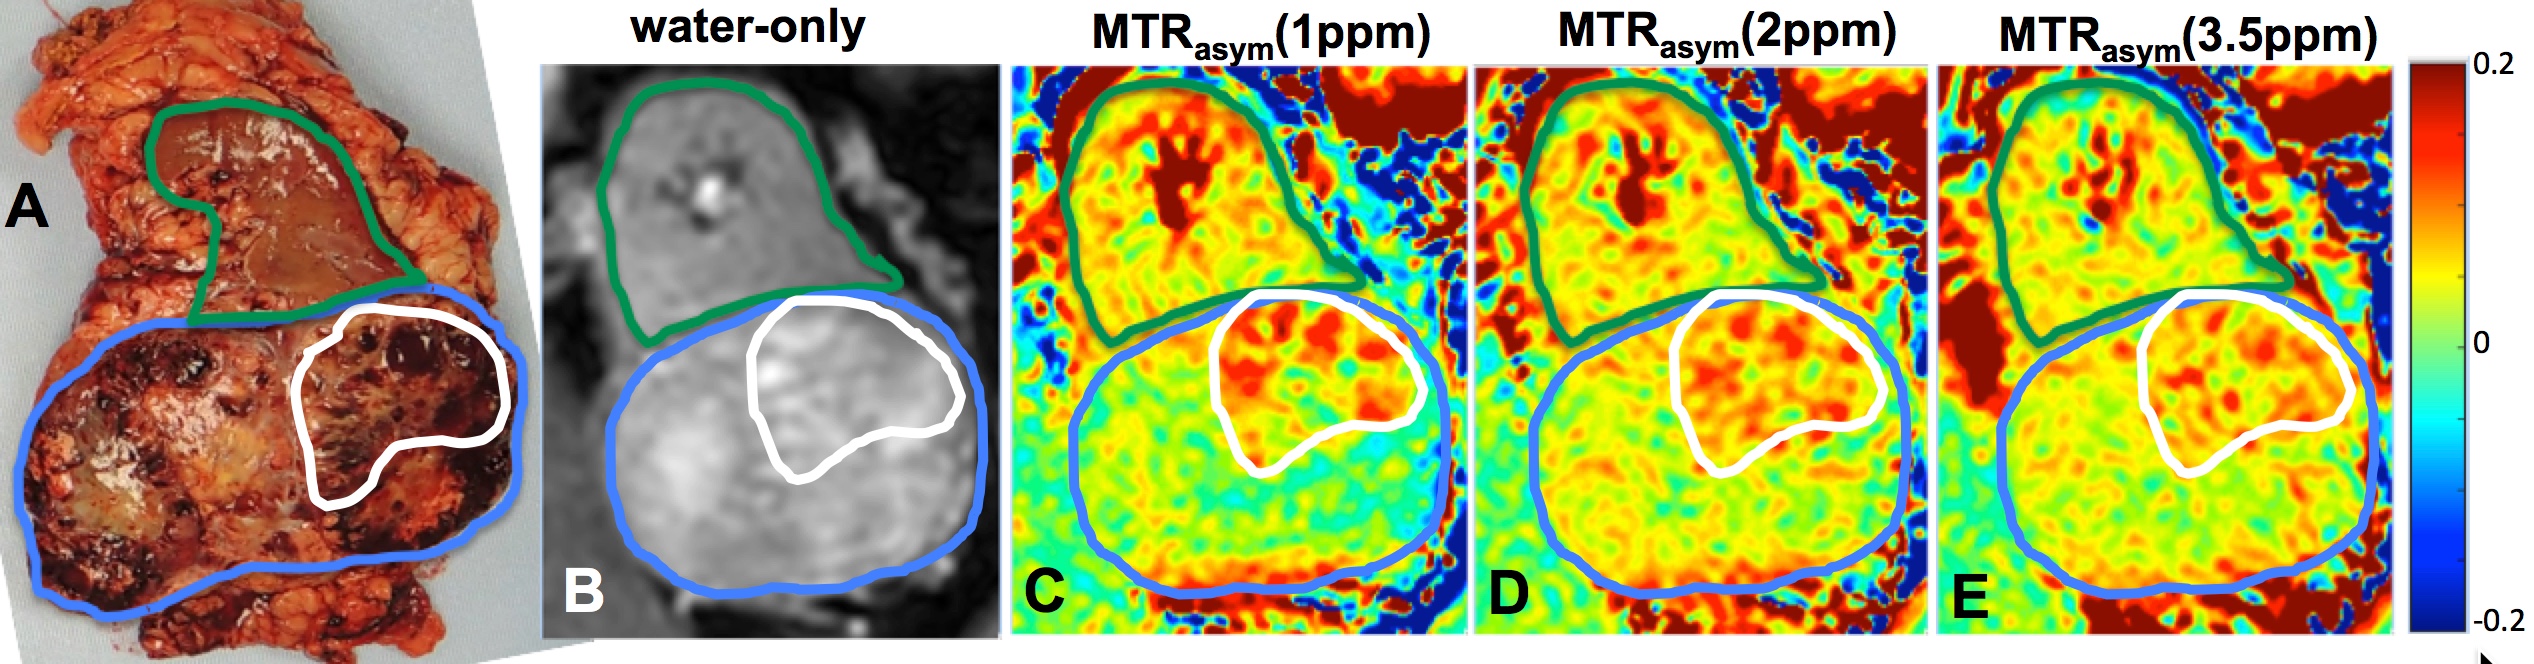
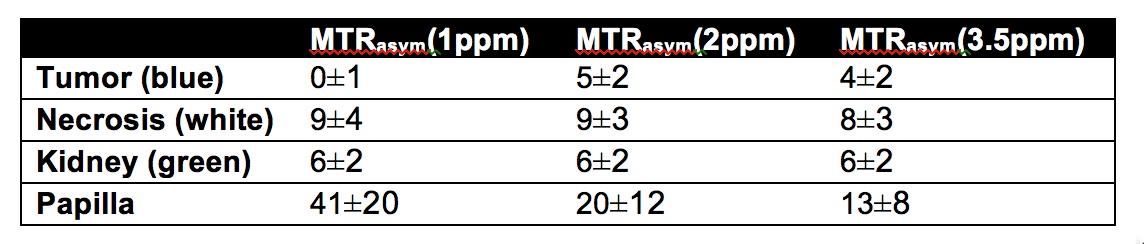
Figure 3 demonstrates the first in vivo renal cancer patient data (B-E) together with the post-surgery specimen (A). The average MTRasym values for the three frequency ranges for different areas are listed in Table 1. Although the results are preliminary in nature, necrosis demonstrated higher MTRasym in all the three frequency ranges. Tumor-kidney tissue difference is the largest for MTRasym(1ppm) (Fig.3B and Table 1). Work is in progress to compare the results using different B1 levels as well as applying more advanced analysis schemes, e.g. Lorentzian peak fitting. Larger patient study is also underway.
CONCLUSION
CEST measurements are feasible in kidneys using combination of motion synchronization, post-processing registration and lipid artifact removal. CEST-mDixon provides a robust way to separate water and fat and obtain dynamically updated B0 correction. First patient data is promising with necrosis clearly differentiated in CEST maps. Larger patient study and further optimization of acquisition and post-processing are underway.Acknowledgements
The research was supported by the NIH grant R21 EB020245 and the University of Texas Southwestern Medical Center Radiology Research fund.References
1. Zhou, J.; van Zijl, P. C. M., Chemical exchange saturation transfer imaging and spectrosopcy. Prog. Nucl. Magn. Reson. Spectrosc. 2006, 48, 109-136.
2. Togao, O.; Yoshiura, T.; Keupp, J.; Hiwatashi, A.; Yamashita, K.; Kikuchi, K.; Suzuki, Y.; Suzuki, S. O.; Iwaki, T.; Hata, N.; Mizoguchi, M.; Yoshimoto, K.; Sagiyama, K.; Takahashi, M.; Honda, H., Amide proton transfer imaging of adult diffuse gliomas: Correlation with histopathological grades. Neuro-Oncology 2014, 16 (3), 441-448.
3. Zhang, S.; Seiler, S.; Madhuranthakam, A. J.; Keupp, J.; Dimitrov, I. E.; Lenkinski, R. E.; Vinogradov, E. In CEST-mDixon for Breast Lesion Characterisation at 3T, International Society forMagnetic Resonance in Medicine, 24th Annual Meeting and Excibition, Singapore, 2016
4. Keupp, J.; Baltes, C.; Harvey, P. R.; van den Brink, J. In Parallel RF Transmission Based MRI Techniue for Highly Sensitive Detection of Amide Proton Transfer in the Human Brain, International Society for Magnetic Resonance in Medicine, 19th Annual Meeting and Exhibition, Montreal, Canada, 2011
5. Robson, P. M.; Madhuranthakam, A. J.; Dai, W.; Pedrosa, I.; Rofsky, N. M.; Alsop, D. C., Strategies for Reducing Respiaratory Motion Artifacts in Renal Perfusion Imaging with Arterial Spin Labeling. Magn. Reson. Med. 2009, 61 (6), 1374-1487.
6. Li, B.; She, H.; Zhang, S.; Keupp, J.; Dimitrov, I. E.; Montillo, A.; Madhuranthakam, A. J.; Lenkinski, R. E.; Vinogradov, E., Image Registration with Structuralized Mutual Information: Application to CEST. International Society for Magnetic Resonance in Medicine, 25th Annual Meeting and Exhibition, Honolulu, Hawaii, 2017
7. Vinogradov, E.; Liu, Z.; Madhuranthakam, A. J.; Hajibeigi, A.; Jump, A.; Pedrosa, I.; Moe, O. W.; Lenkinski, R. E. In Endogenous Urea CEST (urCEST) for MRI monitoring of kidney function, International Society for Magnetic Resonance in Medicine, 23th Annual Meeting and Exhibition, Toronto, Canada, 2015.
8. Dagher, A. P.; Alertas, A. H.; Choyke, P.; Balaban, R. S., Imaging of urea using chemical exchange dependent saturation transfer at 1.5T. J Magn Reson Im 2000, 12, 745-748.
Figures