5107
Chemical Exchange Saturation Transfer imaging of prostate cancer at 3T: Repeatability, and initial results of an acquisition and multi-pool analysis protocol1Centre for Medical Imaging, UCL, London, United Kingdom, 2Institute of Nuclear Medicine, UCLH, London, United Kingdom, 3Brain Repair and Rehabilitation, Institute of Neurology, UCL, London, United Kingdom
Synopsis
An optimised acquisition and post-processing protocol for multi-pool Lorentzian analysis of CEST data in the prostate at 3T is described. The repeatability of the technique is evaluated in five healthy volunteers and the contrast observed between healthy tissue, TZ tumour and PZ tumour in two prostate cancer patients is evaluated.
Introduction
Multi-parametric MRI (mp-MRI) of the prostate enables harmonization of clinical and research projects between groups1. However, approximately 29% of radiologist scores of prostate lesions are indeterminate2 therefore further information is needed to improve scoring and avoid additional biopsies.
Chemical exchange saturation transfer (CEST) imaging is a strong candidate as it provides metabolically-relevant chemical information with good spatial resolution within clinically reasonable scan-times.
A small number of studies have investigated the MTRasym fluctuations in regions of prostate cancer3,4. Here we present a CEST acquisition and post-processing protocol optimized for multi-pool Lorentzian fitting of prostate MRI data acquired on a 3T clinical scanner. The fitting-algorithm is used to extract semi-quantitative parameters from both sides of the water resonance. The repeatability of the fitting metrics is evaluated in five healthy volunteers and an initial assessment of the CEST contrast in transition zone (TZ) and peripheral zone (PZ) tumours is carried out in two biopsy-confirmed prostate cancer patients.
Methods
MRI: Data were acquired using a 3.0T Philips Achieva scanner. CEST sequence parameters were previously optimized5. A TSE readout (α=90°; RefocusingControl=120°; Halfscan=0.65; SPIR; TEeff=14ms; TSEes/shot=4.8/219ms; FOV=140mm2; acqMatrix=72x56) was used with pre-saturation of 60 sinc-Gaussian pulses (tp=td=40ms;θ=1133°/B1eq=0.92μT); TR=5.1s. 66 frequency offsets were sampled with frequency spacings of 0.25ppm between ±5ppm; 0.5ppm between ±(5-7.5ppm); 2.5ppm between ±(7.5-10ppm); and 5ppm between ±(10-30ppm), with additional offsets at ±100ppm and ±300ppm. WASABI data was acquired for B0-corrections6. CEST scan-time: 5m41s. WASABI scan-time: 41s.
Post-processing: All processing performed in Matlab (Mathworks, Natick, MA, R2016a). A sum of Lorentzians, accounting for the water, amide and Nuclear Overhauser Effect (NOE) contributions to the z-spectrum, and a modified super-Lorentzian lineshape, accounting for the magnetization transfer (MT) contribution, was fitted to the acquired z-spectra using a non-linear least squares fitting-algorithm. Preliminary analysis suggested that fitting with more than four-pools (eg to include the amine and NOE@-1.6ppm effect7) reduced reproducibility due to over-fitting. Vertical and horizontal offsets were included as unknowns in the fit equation to account for both imperfect B0-corrections and noise in the normalisation reference scans, respectively.
Repeatability: Five healthy volunteers were scanned twice (mean(Δt)=17days). The intra- and inter-session repeatability scores of the heights of the fitted peaks in ROIs drawn in the TZ, PZ and muscle were evaluated.
CEST contrast in tumour: Two prostate cancer patients were recruited. One with a PI-RADS 5 TZ tumour (Gleason 3+4 ascertained by biopsy over 3 years prior to scanning, PSA had risen to 8.4 by time of recruitment) and the other with a PI-RADS 5 PZ tumour (Gleason 4+3 confirmed by biopsy 4 months prior to scanning, PSA=3.95). CEST scans were run twice on each patient without re-positioning. Contrast between healthy tissue and tumour was evaluated.
Results
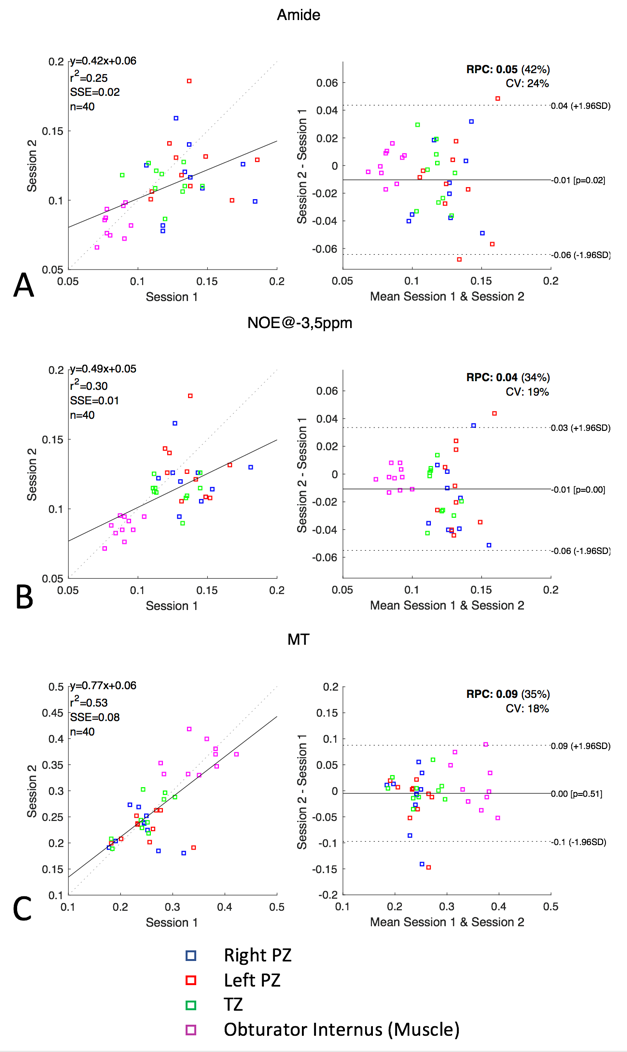
Intra- and inter-session repeatability scores were found to lie between 9.2% and 27% with the amides showing highest coefficient of variation (CoV) of 27% intra- and 25% inter-session, and MT showing the lowest CoV’s of 9.2% intra-session and 18% inter-session. Bland-Altman and correlation plots of the inter-session ROI data are shown in figure 1.
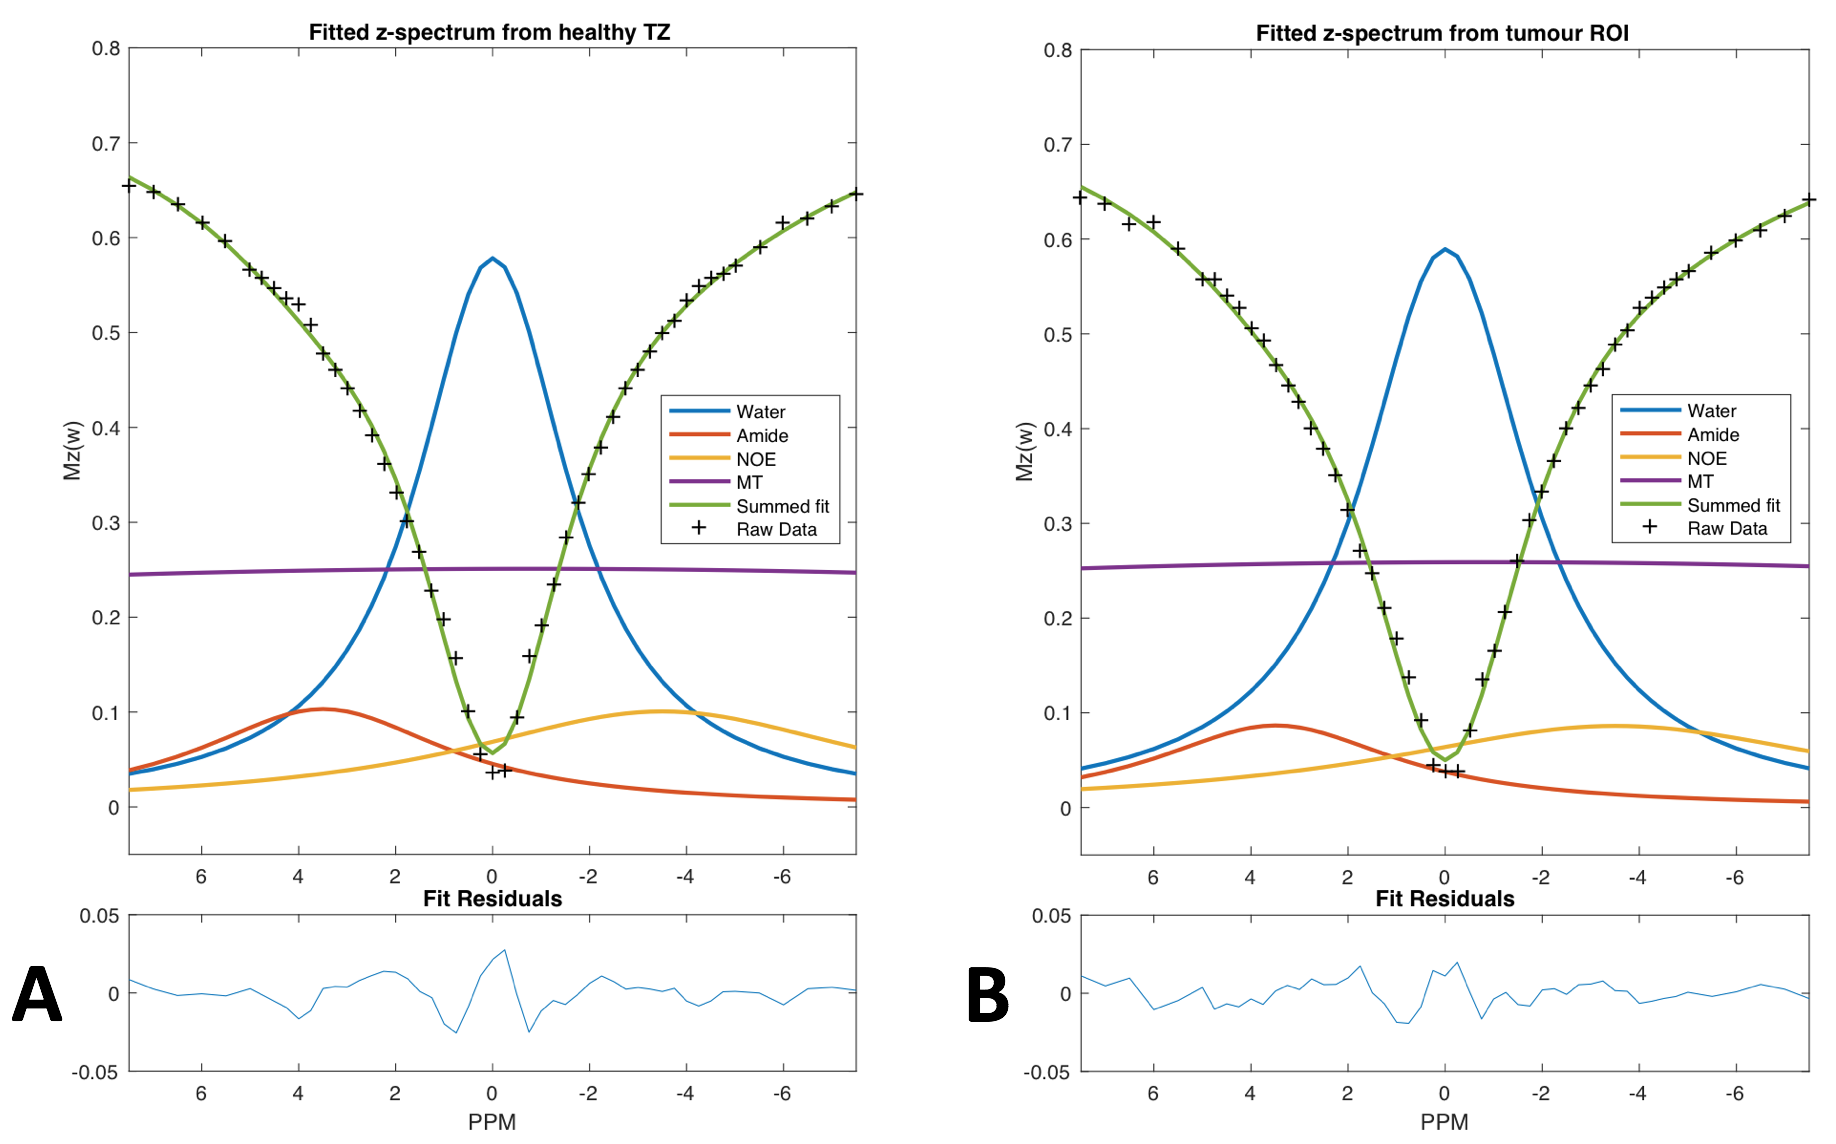
Representative fitted z-spectra from regions of healthy TZ and TZ-tumour in patient 1 are shown in figure 2.
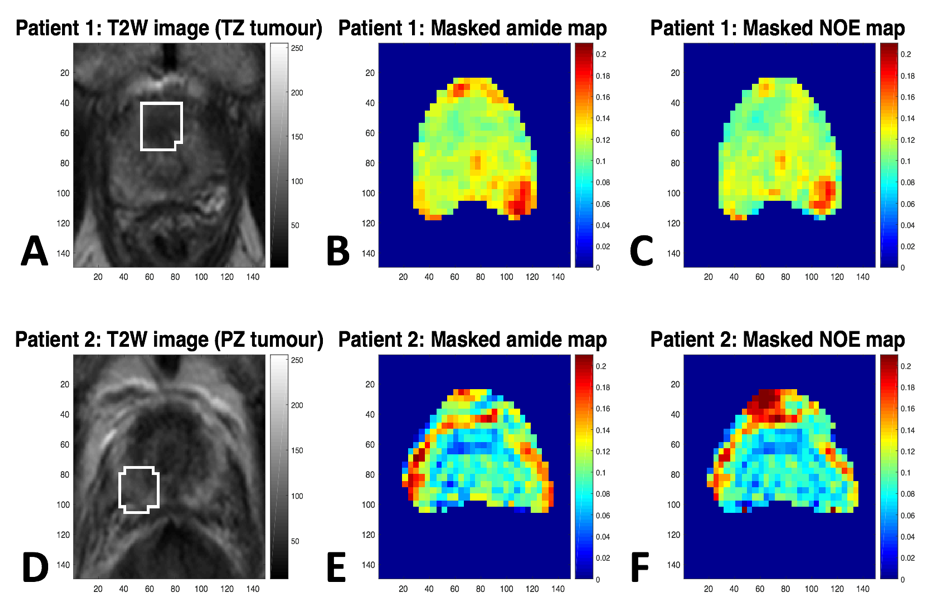
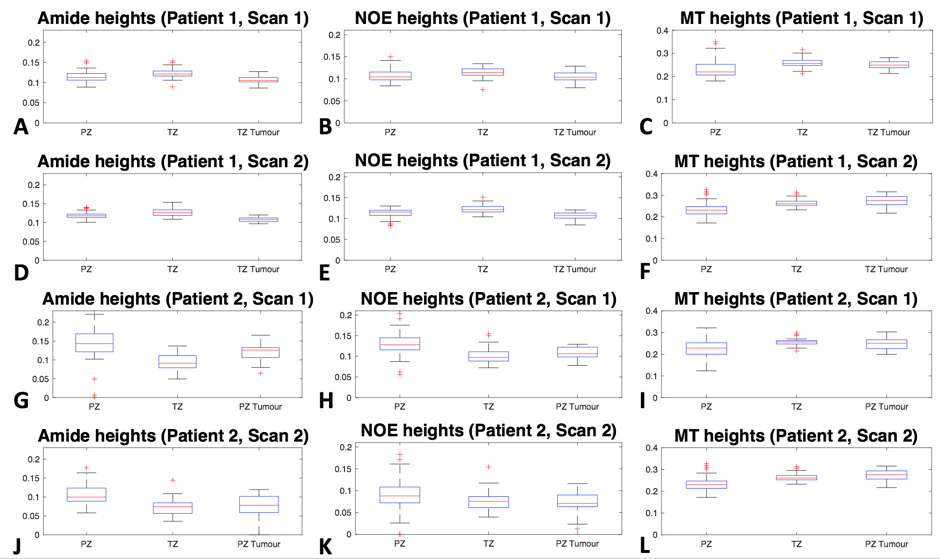
Masked amide and NOE maps are shown in figure 3 and box-plots of the heights of the fitted amide, NOE and MT peaks in different regions are shown in figure 4. It can be seen from the box-plots that the amide and NOE heights in both the TZ- and PZ-tumours show small but significant hypo-intensities when compared to healthy TZ and healthy PZ tissue, respectively.
Discussion
This small study demonstrates a protocol for multi-pool fitting-analysis of CEST data acquired at 3T. The CoV’s of measurements of the absolute peak-heights are acceptable and the contrast between TZ/PZ tumour and healthy TZ/PZ is observable as hypo-intensity in both the amide and NOE signal. The observed signal differences are comparable to the respective inter-session CoV values. The recommendation is to fit no more than 4 peaks (water, amide, NOE and MT) to CEST data acquired at 3T.
Conclusions
A CEST sequence suitable for multi-pool analysis of prostate data at 3T is evaluated in healthy volunteers and patients. The inter-session coefficients of variation for amide, NOE and MT measurements in healthy volunteers are found to be 24%, 19% and 18% respectively. Tissue contrast between healthy TZ/PZ and TZ/PZ tumours is visible in individual maps of peak-height. These findings may be relevant when looking for new metrics in longitudinal prostate cancer imaging, particularly for patients on active surveillance.
The biological interpretation of the observed changes and sensitivity of peak height measurements to water T2 changes require further work.
Acknowledgements
The author acknowledges funding from Cancer Research UK (CRUK) through the Comprehensive Cancer Imaging Centre (CCIC) and the NIHR-funded Biomedical Research Centre at UCLH.References
1. Bomers J G R, Barentz J O, Standardization of Multiparametric Prostate MR Imaging Using PI-RADS. Biomed Research International. 2014;2014;431680
2. Harada T, Abe T, Kato F, et al. Five-point Likert scaling on MRI predicts clinically significant prostate carcinoma. BMC Urology. 2015;15:91
3. Jia G, Abaza R, Williams J, et al. Amide proton transfer MR imaging of prostate cancer: a preliminary study. Journal of Magnetic Resonance Imaging. 2011. 33(3), 647–654
4. Takayama Y, Nishie A, Sugimoto M, et al. Amide proton transfer (APT) magnetic resonance imaging of prostate cancer: comparison with Gleason scores. Magnetic Resonance Materials in Physics, Biology and Medicine. 2016 29(4), 671–679
5. Evans V, Torrealdea F, Rega M, et al. Optimisation of a prostate CEST MRI sequence for multi-pool analysis of z-spectra on a 3T clinical scanner. ESMRMB Congress, Barcelona, 2017, Abstract ID 691
6. Schuenke P, Windschuh J, Roeloffs V, et al. Simultaneous mapping of water shift and B 1 (WASABI)-Application to field-Inhomogeneity correction of CEST MRI data. Magnetic Resonance in Medicine. 201 77(2), 571-580
7. Zhang X-Y, Wang F, Afzal A, et al. A new NOE-mediated MT signal at around −1.6ppm for detecting ischemic stroke in rat brain. Magnetic Resonance Imaging. 2016;34(8), 1100–1106
Figures