5106
Chemical Exchange Rotation Transfer imaging of Phosphocreatine in Muscle1Radiology Department, Vanderbilt University, Nashville, TN, United States
Synopsis
CEST imaging of Creatine has been reported, whereas selective mapping of PCr in vivo has not been implemented. We found that CEST imaging of Creatine may be influenced by other molecules in muscle, but CERT imaging of PCr is more specific and thus should be a better indicator of changes of flux through the CK reaction.
Purpose:
The creatine kinase (CK) reaction plays a vital role in muscle energetics. Creatine (Cr) and phosphocreatine (PCr) are two of the major metabolites involved. Previously 1H MRS has been used to measure total Cr, but it cannot differentiate between Cr and PCr and thus cannot characterize the creatine kinase reaction. 31P MRS can be used to measure PCr, but suffers from low spatial resolution and NMR sensitivity. Recently, chemical exchange saturation transfer (CEST) has been used to provide high-sensitivity Cr imaging through measurements of water signal changes due to chemical exchange between Cr amine and water protons1. However, we have reported that CEST imaging of Cr has contributions from multiple other exchanging protons. In addition, conventional asymmetric analyses (MTRasym) mix signals from CEST and nuclear Overhauser enhancement (NOE) effects. An alternative multiple-pool Lorentzian fit has been used to isolate specific CEST effects, but its application is limited by the long acquisition time needed to obtain whole Z-spectra. Here we modified our previously developed chemical exchange rotation transfer (CERT) method2 to quantify PCr more specifically.Methods:
MTRasym and CERT MTRdouble, cpw are defined as, $$MTR_{asym}=\frac{S_+-S_-}{S_0} (1) $$ $$MTR_{double, cpw}=\frac{S_-(\theta_2=2\pi, dc_2)-S_-(\theta_1=\pi, dc_1)}{S_0}\mid_{Bavgpower} (2) $$ where (-) represents the offset of the exchanging species and (+) is the offset on the opposite side of the water peak. θ of (π) and (2π) represents the individual irradiation pulses making up a long irradiation pulse train; S0 is the signal acquired in the non-irradiated control case; Bavg power is the average irradiation power and is defined to be the root mean square of the amplitude over a pulse repetition period. The duty cycle (dc) in MTRdouble, cpw is set to be 0.72 for π irradiation (dc1) and 0.18 for 2π irradiation (dc2), so that the pulse width for both irradiations are 13 ms at irradiation power = 1 μT. The pulse widths are set to be the same in order to decrease the difference of their direct saturation effects close to water. In addition, the different dc’s used in MTRdouble, cpw expand its exchange filtering effect (from slow-exchange pass to intermediate-exchange pass filter) compared with our previous CERT approach with constant dc of 0.5, Hence, it can quantify both PCr and Cr in slow to intermediate exchange regime. To increase the specificity of our method further, we combined the CERT and AREX3 approaches to define a new metric: $$ AREX_{double, cpw}=R_{1obs}(\frac{S_0}{S_-(\theta_1=\pi, dc_1)}-\frac{S_0}{S_-(\theta_2=2\pi, dc_2)})\mid_{B_{avgpower}} (3) $$ where R1obs is the water longitudinal relaxation rate. To study the ability of CERT to quantify Cr and PCr, 5 samples with metabolites at their physiological concentrations were prepared in 1×PBS and titrated to pH = 7.0. Five healthy rats were also imaged. All measurements were performed on a Varian 9.4T small animal MRI scanner at 37° C.Results:
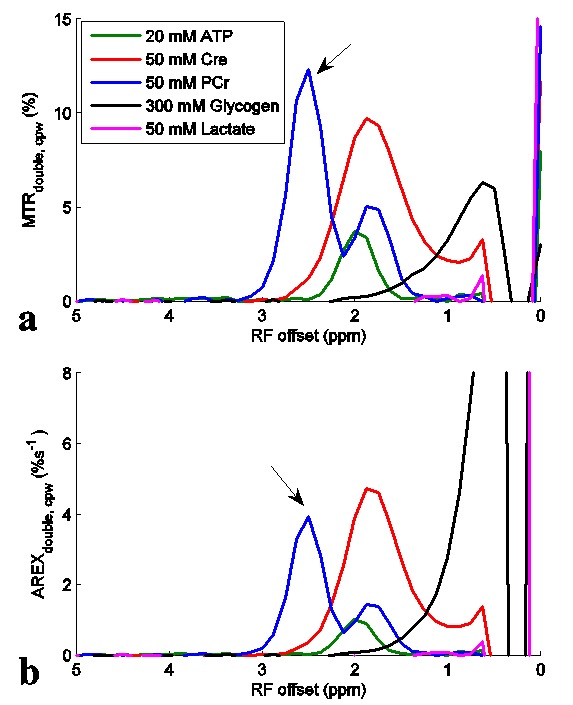
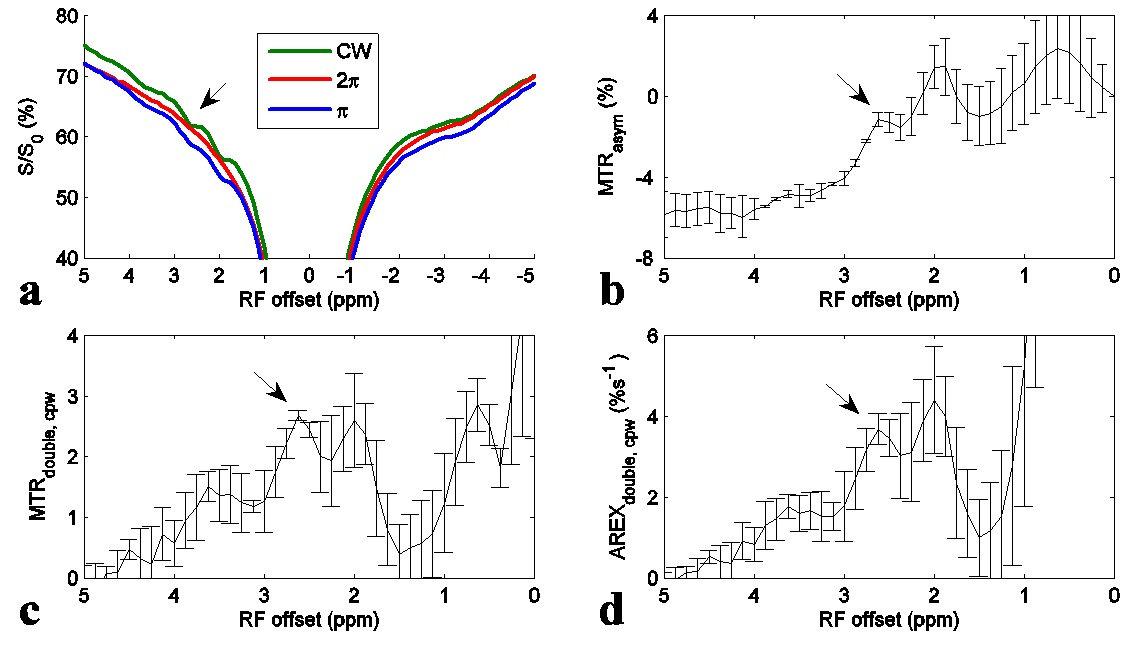
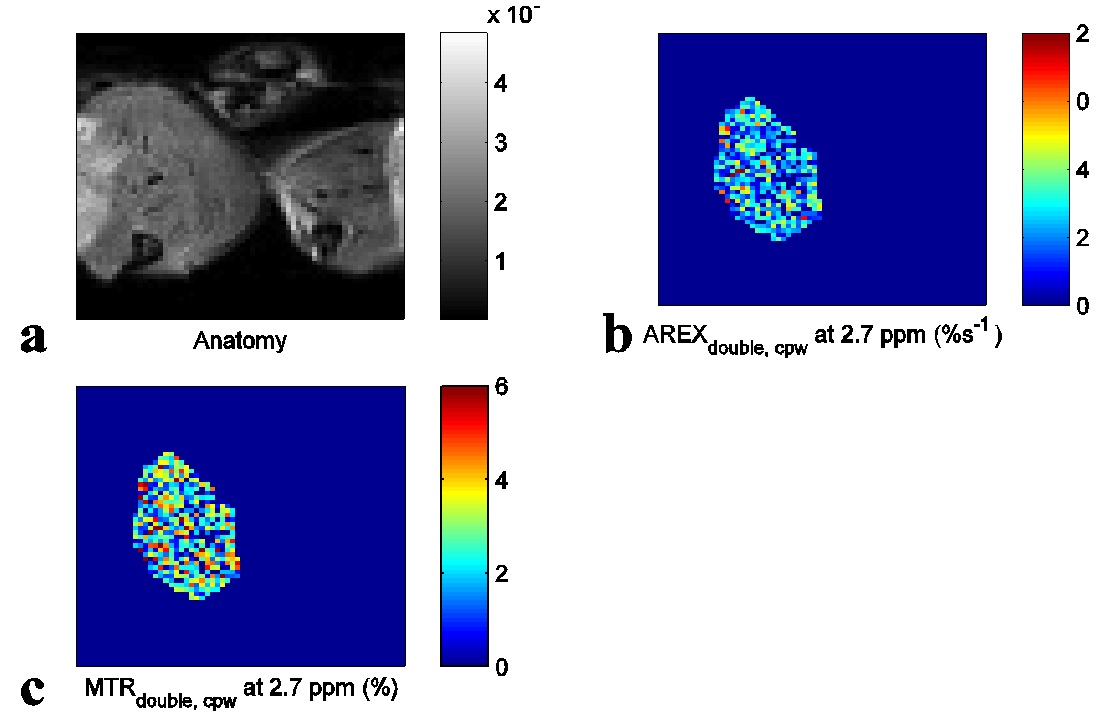
Fig. 1 shows the experimental MTRdouble,cpw and AREXdouble,cpw spectra from solutions containing the main metabolites in muscle. It shows that CERT signals at 2.7 ppm have contributions only from PCr, but CERT signals at 2 ppm have contributions from Cr, PCr, and ATP. Fig. 2 shows results of the CEST experiments on healthy rat legs. Note the negative MTRasym values at large offsets from water (>2 ppm), indicating possible confounding contributions from asymmetric MT or NOE effects originating from the other side of the water peak. In contrast, the MTRdouble,cpw and AREXdouble,cpw metrics specifically measure the CEST effects from PCr without unwanted baseline distortions. Fig. 3 shows anatomic sections and corresponding maps of MTRdouble,cpw and AREXdouble,cpw at 2.7 ppm.Discussion:
The negative MTRasym at 2.7 ppm may explain why CEST imaging of PCr was not reported in vivo previously. Our previous study indicates that the guanidino amine of proteins may make significant contributions to the CEST signal at 2 ppm, but not significant contributions at ≈ 2.7 ppm4. In addition, although fast exchanging amines have broad peaks which may influence CEST signals at 2.7 ppm, their CEST effects can be mostly removed in CERT due to its exchange-rate filtering effect2.Conclusion:
AREXdouble,cpw can provide specific quantification of CEST signals at 2.7 ppm, which can serve as the basis for PCr specific imaging. However, CEST signals at 2 ppm have contributions from Cr, PCr, and ATP, and possibly also from proteins, and thus are much less specific.Acknowledgements
R01 EB017767, R01 CA109106, and R21 EB17873References
1. Kogan F, Haris M, Singh A, et al. Method for high-resolution imaging of creatine in vivo using cheical exchange saturation transfer. Magn Reson Med. 2014;71: 164-172.
2. Zu Z, Janve VA, Xu J, et al. A new method for detecting exchanging amide protons using chemical exchange rotation transfer. Magn Reson Med. 2013;69: 637-647.
3. Zaiss M, Bachert P. Exchange-dependent relaxation in the rotating frame for slow and intermediate exchange - modeling off-resonant spin-lock and chemical exchange saturation transfer. NMR Biomed. 2013;26(5): 507-518.
4. Zu Z, Louie EA, Lin EC, et al. Chemical exchange rotation transfer imaging of intermediate-exchanging amines at 2 ppm. NMR Biomed. 2017. DOI: 10.1002/nbm.3756.
Figures