5105
Spin-lock Imaging of 3-o-Methyl-D Glucose (3oMG) in Brain Tumors1Radiology Department, Vanderbilt University, Nashville, TN, United States
Synopsis
We evaluated the ability of spin-lock imaging to detect the uptake of 3-o-methyl-D-glucose (3oMG) in normal brain and brain tumors in animals. We used $$$\triangle R_{1\rho}^{diff}$$$ to isolate the contribution from only the injected agent. We found that $$$\triangle R_{1\rho}^{diff}$$$ in tumors increased rapidly after injection, whereas intact brain showed a gradual increase up to 1h. $$$\triangle R_{1\rho}^{diff}$$$ was significantly different between tumors and contralateral normal tissues
Purpose:
Measurements of the uptake and kinetics of administered glucose or its analogues can provide information on tissue metabolism and the levels of glucose transporters. Most cancer cells have glycolytic rates and uptake of glucose higher than normal so imaging the uptake of glucose analogues may enhance the detection of tumors. 3-o-methyl-D-glucose (3oMG) is a non-toxic glucose analogue that is taken up by cells through glucose transporters but which is not metabolized and which, unlike 2-deoxy-fluoro-D-glucose (FDG), is not phosphorylated by hexokinase. 3oMG is therefore an ideal candidate of metabolic contrast agent for imaging measurements. 3oMG contains exchanging protons in hydroxyl groups, so chemical exchange saturation transfer (CEST) can be used to detect 3oMG1. However, hydroxyl protons exchange very rapidly in the fast exchange regime, so their CEST effects extend over a broad frequency range and overlap with the water proton resonance. The detection and quantification of by CEST is therefore challenging. Spin-lock imaging is an alternative technique which is also sensitive to chemical exchange, and is more suitable for detecting fast exchanging nuclei. Here we demonstrate the ability of spin-lock imaging to detect the uptake of 3oMG in tumor bearing rat brains.Methods:
Assuming tissue can be modeled as two exchanging pools (solute and water), the longitudinal relaxation rate in the rotating frame ($$$R_{1\rho}$$$) can be expressed as2,$$R_{1\rho}=\frac{f_s\cdot k_{sw}\cdot\triangle\omega^2_s}{\triangle\omega^2_s+\omega^2_1+k^2_{sw}}+R_{2,0} (1) $$ where $$$f_s$$$, $$$k_{sw}$$$, and $$$\triangle\omega_s$$$ are the solute concentration, solute-water exchange rate, and solute resonance frequency offset from water, respectively,$$$ R_{2,0}$$$ is the transverse relaxation rate of water without the chemical exchange contribution, and $$$w_1$$$ is the Larmor frequency associated with the locking field. After the administration and uptake of a contrast agent, not only may the chemical exchange contribution from the agent (e.g. $$$f_s$$$ and $$$k_{sw}$$$) change, but also non-exchange related effects (e.g.$$$R_{2,0}$$$) may change. To remove the non-exchange effects, we define a simple $$$R_{1\rho}$$$-based exchange dispersion contrast as, $$\triangle R_{1\rho}=R_{1\rho}(low)-R_{1\rho}(high) (2)$$ where low and high denote the relative values of $$$w_1$$$ used in the measurements. Here we used 3162 Hz for high $$$w_1$$$ and 100 Hz for low $$$w_1$$$. To further separate the exchange effects of the agent from other endogenous exchanging pools in tissues, we define $$$\triangle R^{diff}_{1\rho}$$$, $$\triangle R^{diff}_{1\rho}=\triangle R_{1\rho}\mid_{after injection} - \triangle R_{1\rho}\mid_{base line} (3)$$ A series of 3oMG solutions were used to evaluate the dependence of $$$\triangle R_{1\rho} $$$ on solute concentration. Five rats bearing 9L gliosarcoma tumors were studied before and after 3oMG injections. Spin-lock images were acquired using a spin-lock preparation cluster ($$$90_x - \tau_y/4 - \tau_{-y}/4 - 180_y - \tau_y/4 - \tau_{-y}/4 - 90_{-x}$$$) followed by a SE-EPI readout. $$$R_{1\rho} $$$ at each locking frequency was derived using different locking intervals. In addition, quantitative magnetization transfer images were acquired to estimate the semi-solid pool size ratio (PSR) using a selective inversion recovery sequence3. Experiments were performed on a Varian DirectDriveTM 9.4T magnet.Results:
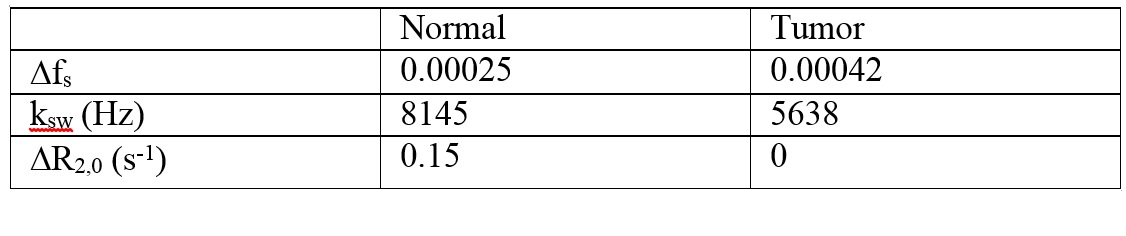
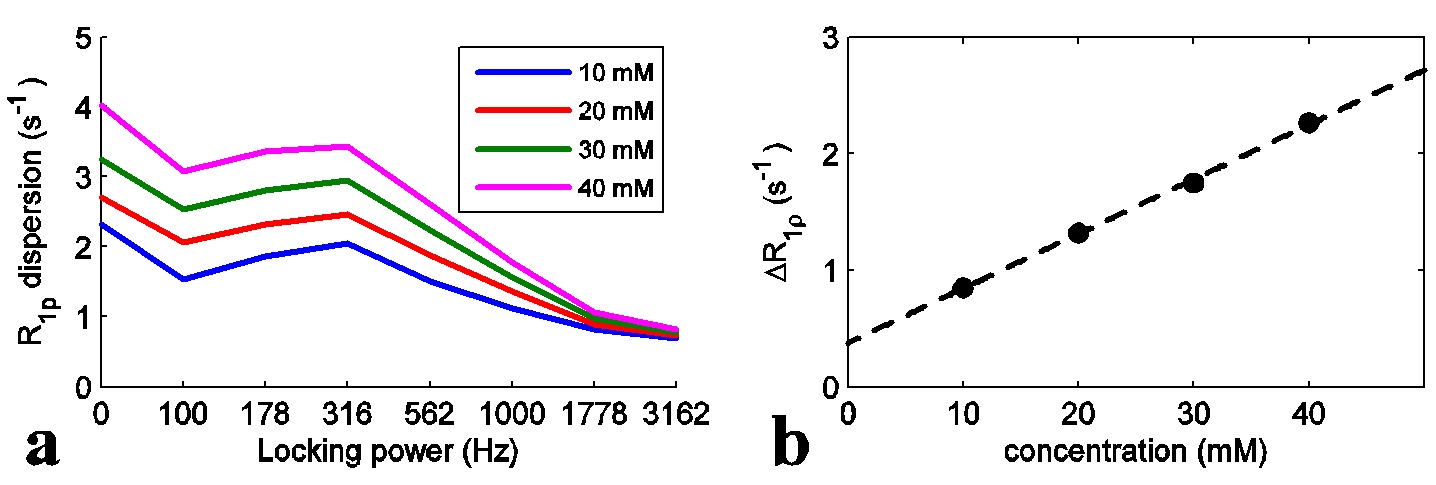
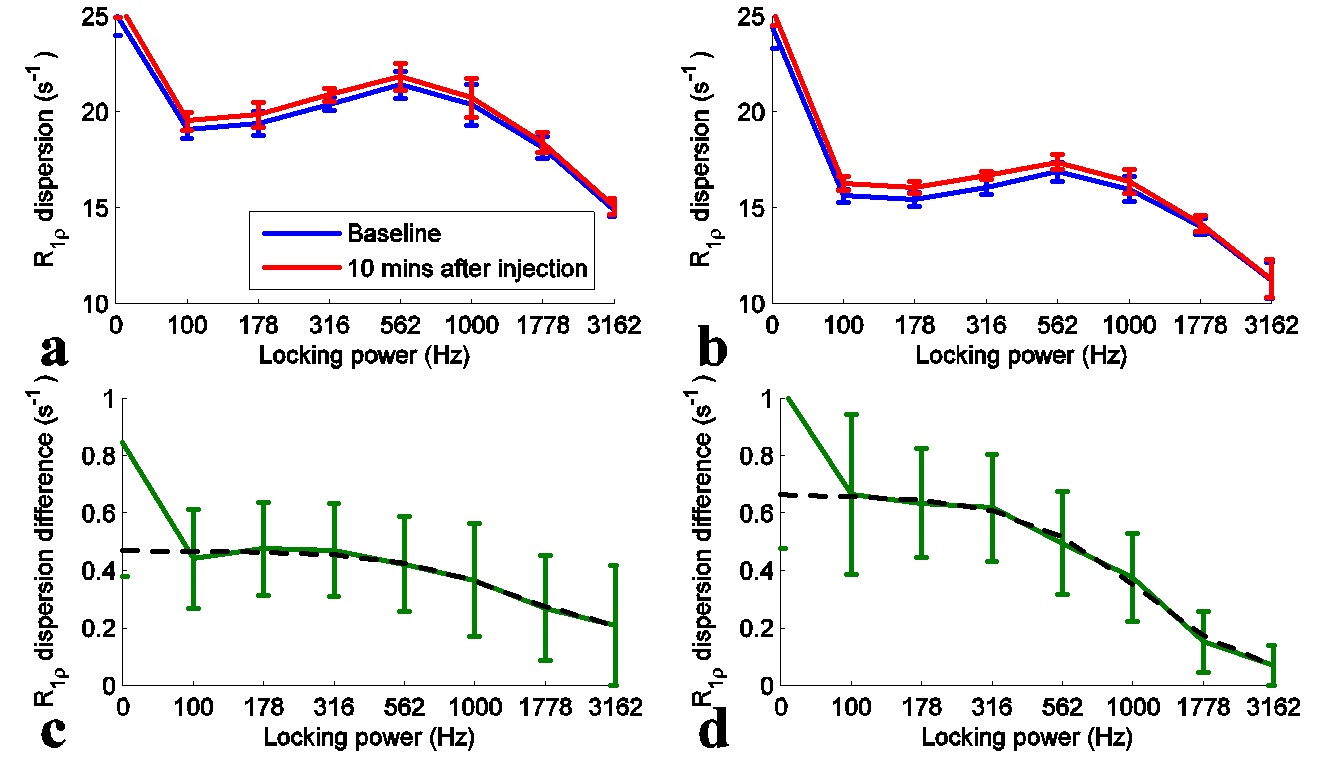
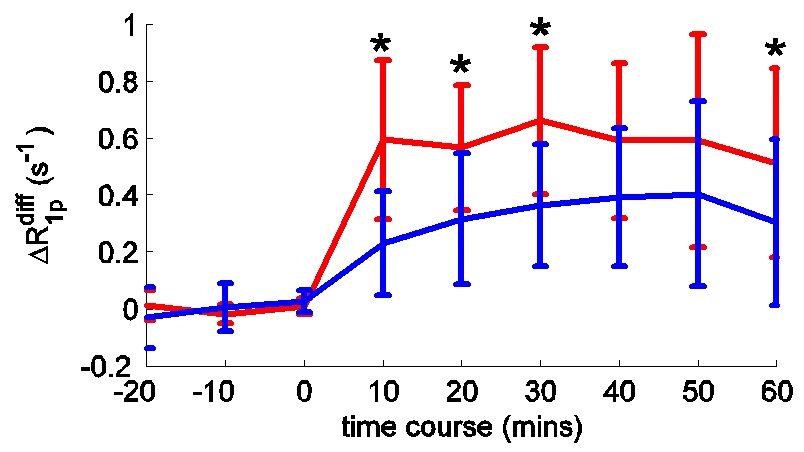
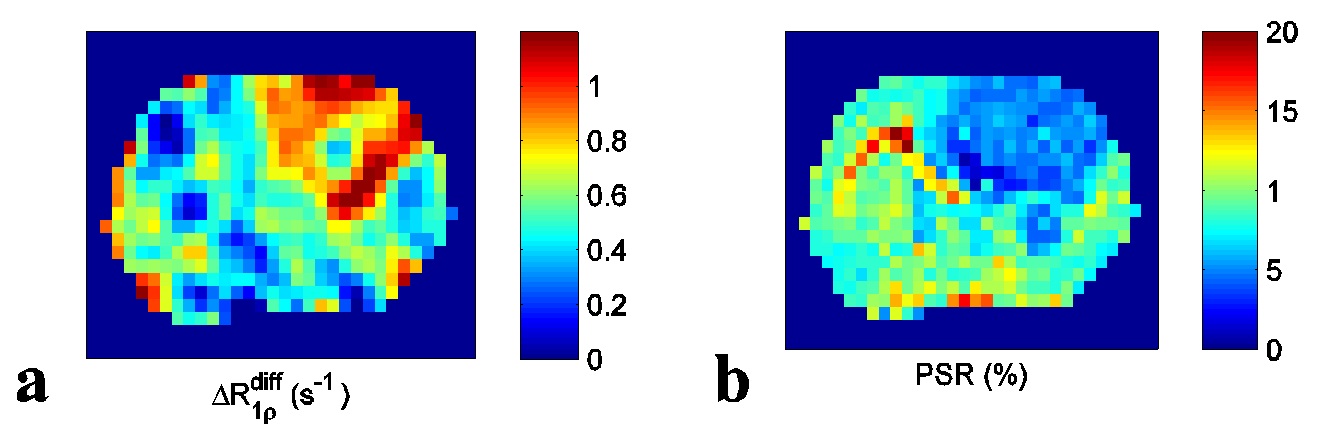
Fig. 1 shows that $$$\triangle R_{1\rho}$$$ in samples is linearly proportional to 3oMG concentration. Fig. 2a and 2b show the$$$R_{1\rho}$$$ dispersion from rat brains before (blue line) and at 10 mins after (red line) injecting 3oMG for both normal tissues and tumors. The $$$R_{1\rho}$$$ dispersion acquired before injection was used as the baseline. We found that $$$R_{1\rho}$$$ values in both tumors and normal tissues acquired 10 mins after injecting 3oMG increased compared with baseline values, especially at lower locking fields. Fig. 2c and 2d show the $$$R_{1\rho}$$$ dispersion difference from normal tissues and tumors, respectively. Note that the $$$R_{1\rho}$$$ dispersion difference isolates only the exchange contribution from only the injected agent. We also fitted the $$$R_{1\rho}$$$ dispersion difference to Eq. (1) (black dashed curve) to obtain the exchange parameters. Table 1 lists the fitting results. Fig. 3 shows the mean time courses of $$$\triangle R_{1\rho}^{diff}$$$ for rat brains. It was found that $$$\triangle R_{1\rho}^{diff}$$$ in tumors increases quickly after injection, whereas intact brain showed a more gradual increase up to 1 h. Fig. 4 shows maps of $$$\triangle R_{1\rho}^{diff}$$$ and PSR from a representative rat brain.Discussion:
We applied spin-lock techniques to detect 3oMG in vivo. The fitted change in $$$f_s$$$ in tumors is roughly two times that in normal tissues, presumably due to the enhanced uptake of 3oMG in tumors. The fitted $$$k_{sw}$$$ in normal tissues is roughly 70% of that in tumors, which may be due to differences in pH. The fitted change in $$$R_{2,0}$$$ in tumors is very small compared with that in normal tissues, which may suggest that the variation of non-exchange effects in tumors due to 3oMG administration is negligible.Conclusion:
We show that spin lock imaging can be applied to detect 3oMG in vivo as a potential contrast agent that is taken up in a fashion similar to glucose.Acknowledgements
R21 EB017873References
1. Rivlin M, Tsarfaty I, Navon G. Functional Molecular Imaging of Tumors by Chemical Exchange Saturation Transfer MRI of 3-O-Methyl-D-Glucose. Magn Reson Med. 2014;72(5):1375-1380.
2. Chopra S, Mcclung RED, Jordan RB. Rotating-Frame Relaxation Rates of Solvent Molecules in Solutions of Paramagnetic-Ions Undergoing Solvent Exchange. Journal of Magnetic Resonance 1984;59(3):361-372.
3. Gochberg DF, Gore JC. Quantitative magnetization transfer imaging via selective inversion recovery with short repetition times. Magn Reson Med. 2007;57(2):437-441.
Figures