5104
Mapping the Brain’s water content and low-frequency electrical properties through T1-weighted MRI imaging1Novocure GmbH, Root, Switzerland, 2Novocure, Haifa, Israel
Synopsis
INTRODUCTION
Measuring electrical properties (EPs) in-vivo is important for understanding the interactions between electromagnetic fields and the body and thus crucial for investigation of MRI safety, antenna research or electromagnetic stimulation and therapeutics1. A number of research efforts have attempted to use MRI techniques to non-invasively image EPs of biological tissues often close to the Larmour frequency2. Water-content electrical properties tomography (wEPT) is a relatively novel approach, in which the EP image is estimated from a water-content (WC) map of brain tissues that is derived from two T1-weighted images with different repetition times (TR)3. This method is attractive as it utilizes relatively fast and simple imaging and analysis sequences. It has been used to map EPs at 128 MHz in the brain2. Typically, when performing computational studies to investigate how externally generated electromagnetic fields distribute in the brain, a head model is created by segmenting structural MRIs into homogeneous tissue types of uniform EPs. For pathologies that are often characterized by highly heterogeneous areas this approach leads to inaccurate models. Utilizing EP maps to assign a conductivity (and permittivity) value to each volume element in the computational model is an attractive approach for overcoming this limitation. One first attempt to do this was to use the anisotropic conductivity tensor distribution derived from Diffusion Tensor Imaging (DTI) to simulate the induced electric field during treatment with Optune™4, an FDA-approved device for the treatment for glioblastoma multiforme 5,6. Optune™ is used to deliver Tumor Treating Field (TTFields), which are electric fields at 200 kHz that disrupts mitotic processes in cancer cells. DTI sequences at the high spatial resolution required for model creation are time consuming and therefore not practical in a clinical setting. wEPT however, utilizes two T1-weighted images, and therefore image acquisition time is short. However, the accuracy of wEPT for mapping EPs in the 100-1000 kHz range remains unclear. Here we describe a first attempt to utilize wEPT to create conductivity maps of the brain in animal models in this frequency range.METHODS & RESULTS
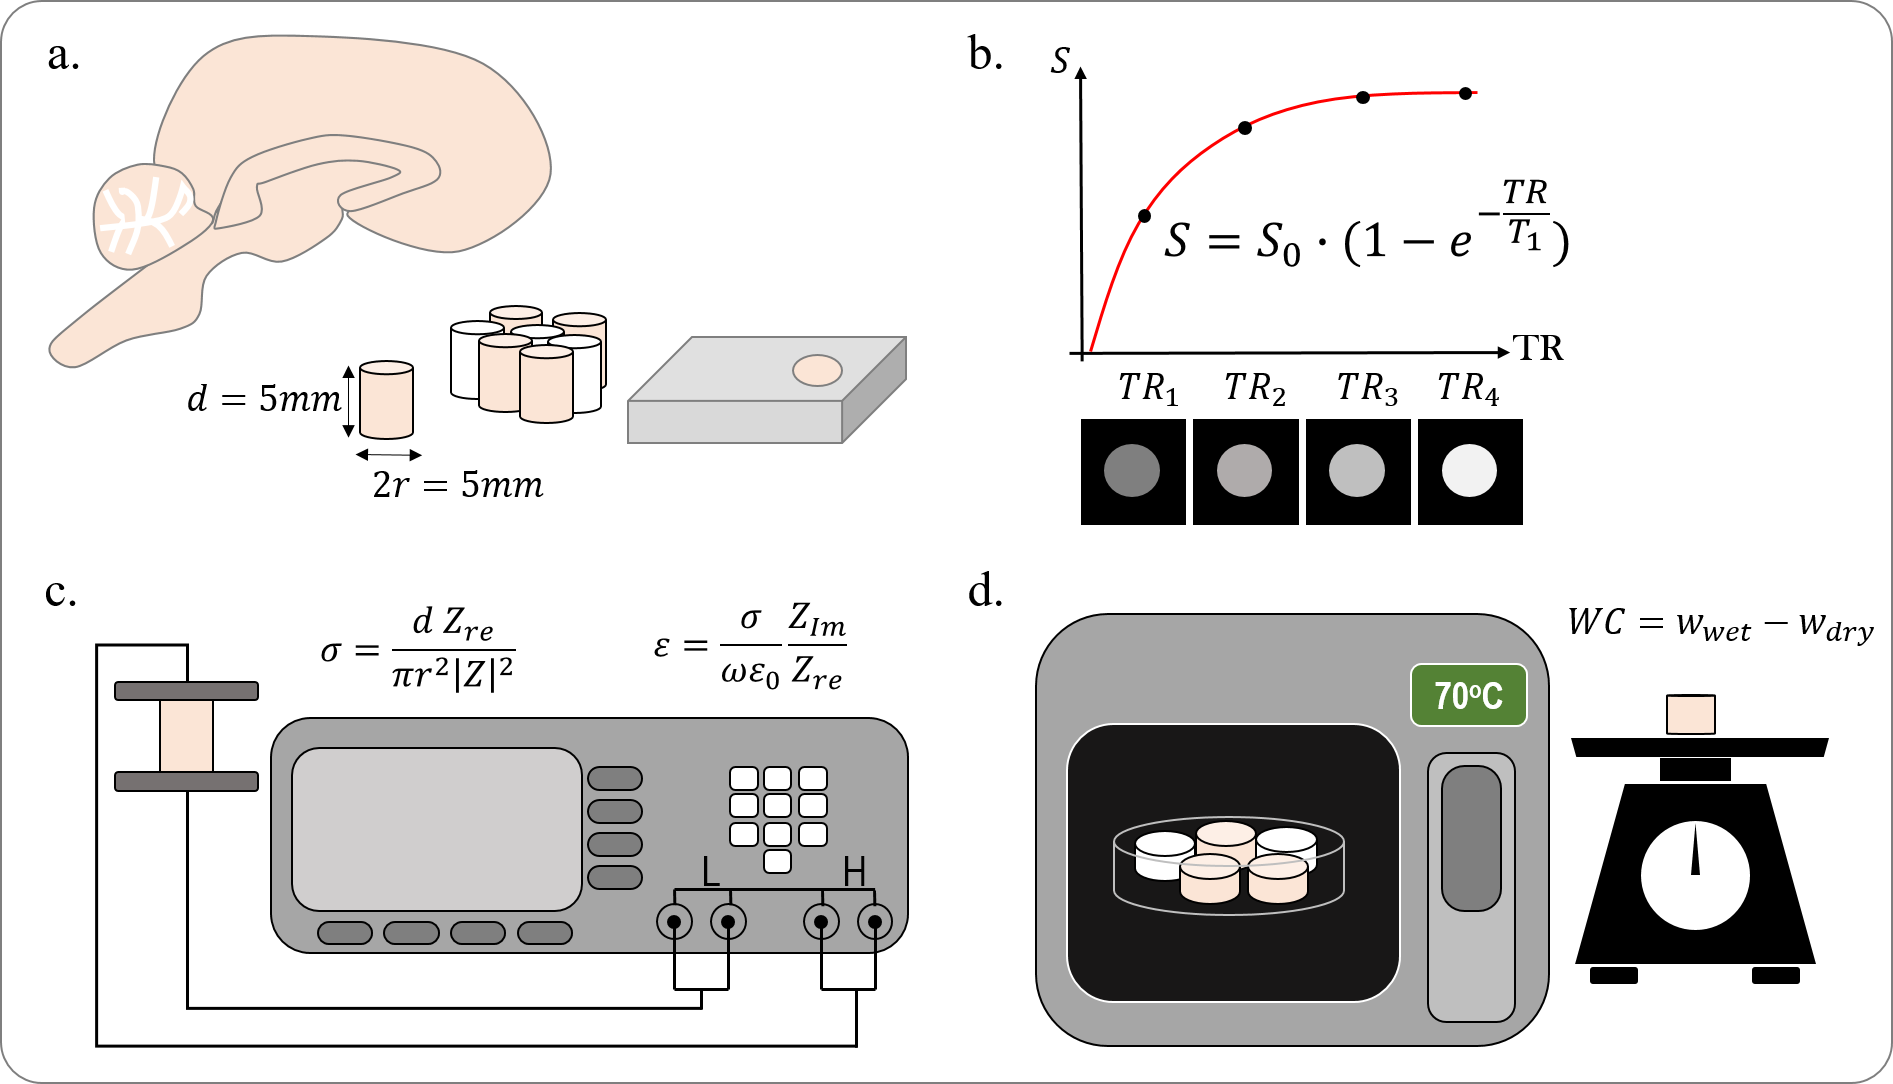
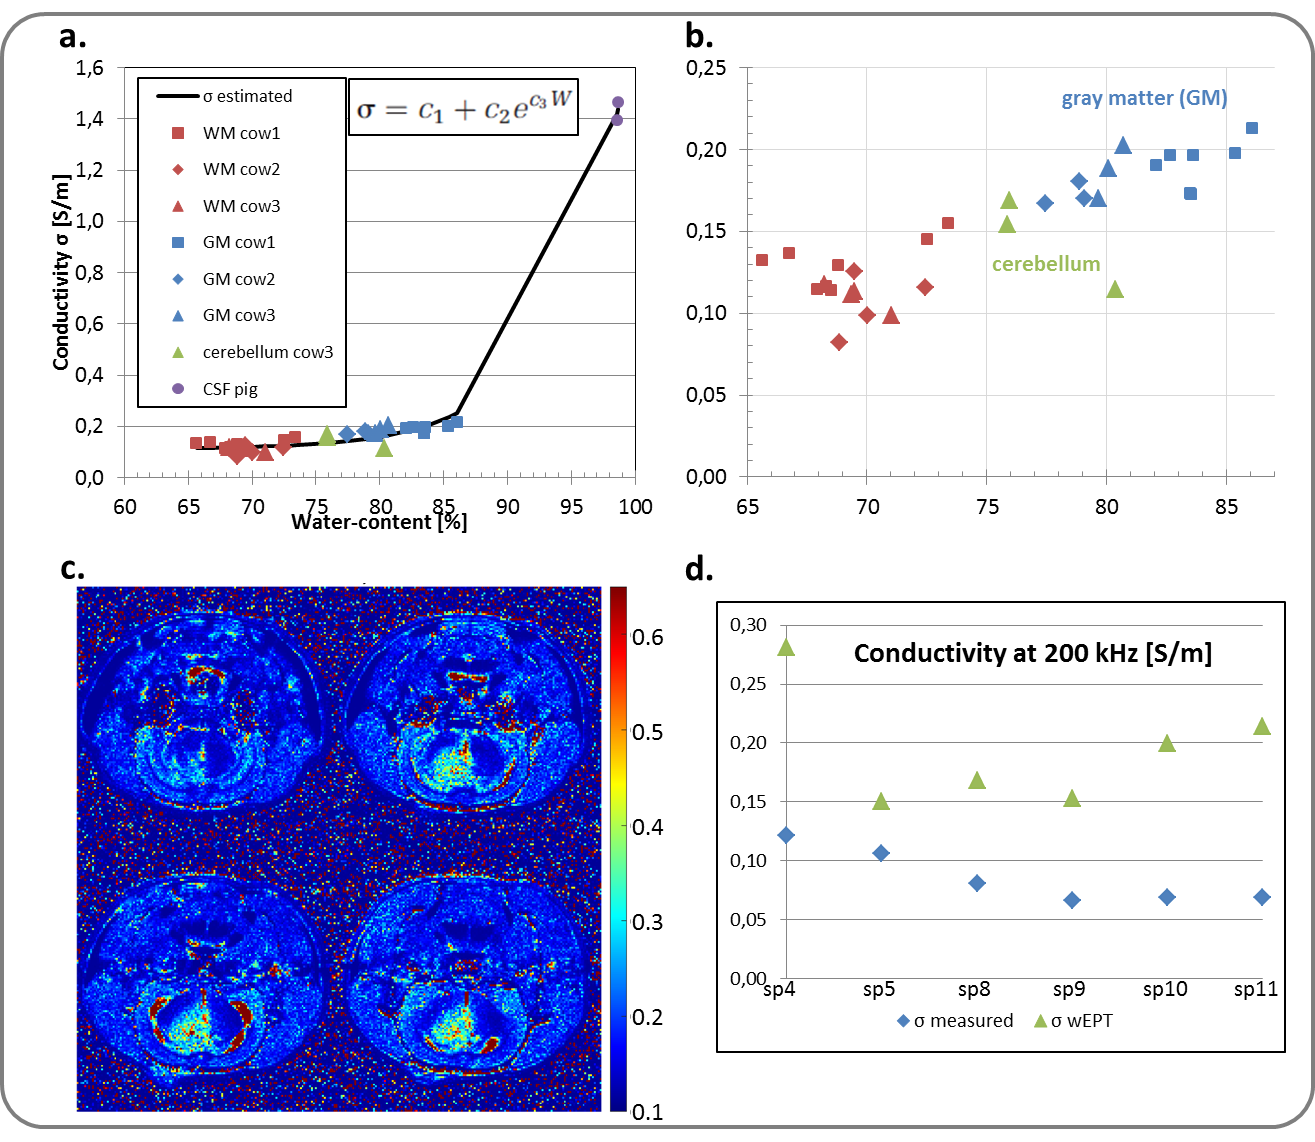
The rational for wEPT is that the T1 relaxation value of tissue is related to its WC by
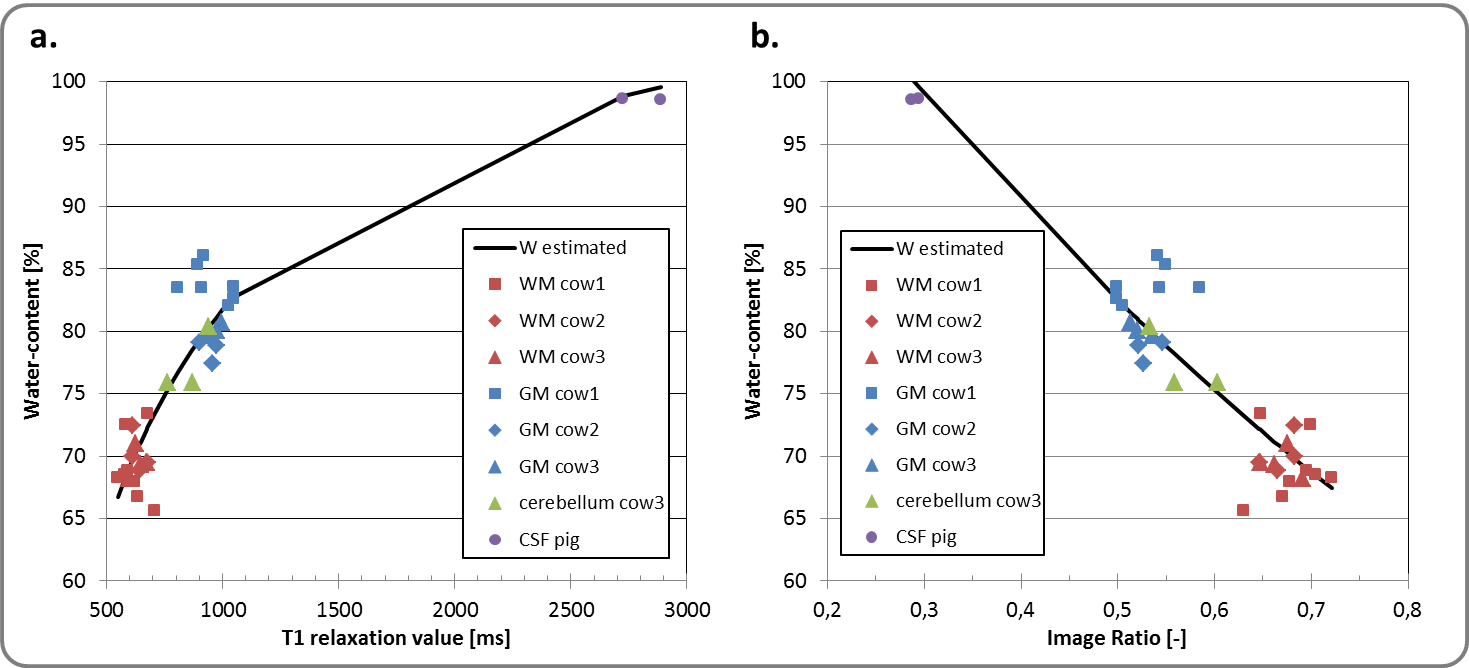
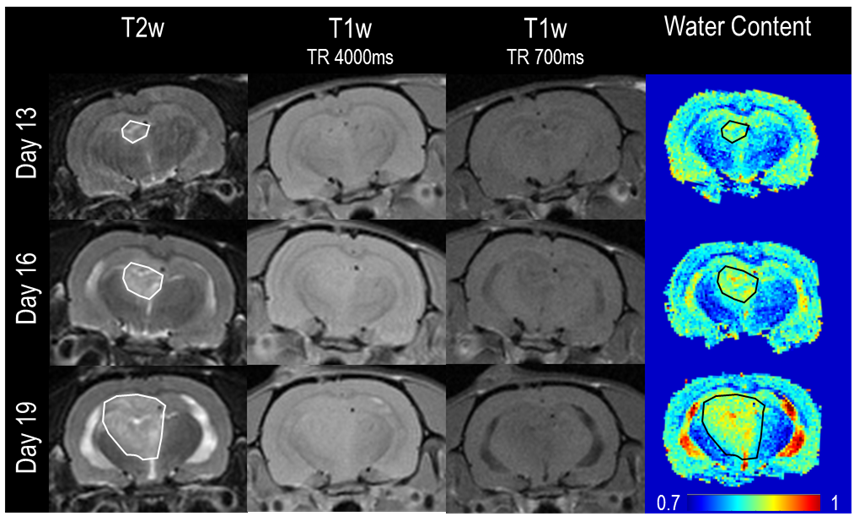
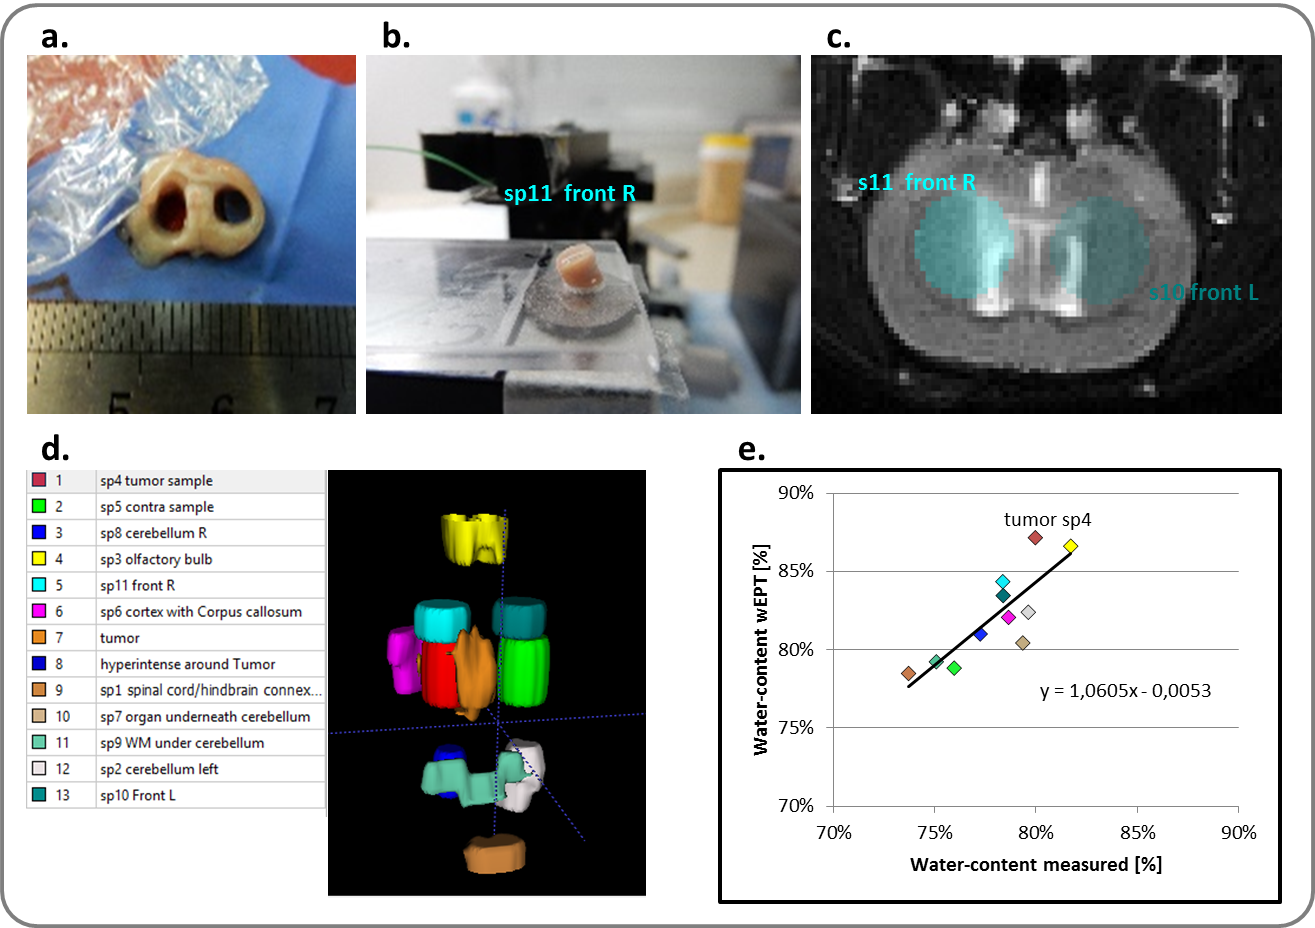
$$$ WC=\frac{1}{A+B/T_1}$$$ (eqn1), where coefficients A and B can be found experimentally. T1 maps can be directly derived through lengthy imaging sequences. However, an alternative is to estimate the WC from the image ratio (IR) of two T1-weighted images with different TRs, $$$WC=w_1e^{-w_2I_r}$$$ (eqn2), where w1 and w2 are coefficients derived by fitting (eqn2) to experimentally measured data3. In order to find accurate coefficients, we analyzed 32 tissue samples from 3 different healthy cow brains, and measured the wet and dry mass of these samples to derive their WC. The corresponding T1 relaxation value of each sample was evaluated through curve fitting of five T1-weighted images. The EPs of the (wet) samples were also measured using parallel-plates (Fig.1). With this data the wEPT coefficients for eqn1 and eqn2 were calculated (Fig.2). The application of wEPT in-vivo was investigated using a F98 rat brain tumor model. Imaging was performed in a Bruker 1T icon scanner. wEPT images were acquired before injection of the tumor cells and 13, 16, and 19 days after injection and corresponding WC maps were estimated (Fig.3). The animal was euthanized 19 days post-injection, the brain was excised and 11 brain samples were punched out, including one sample from the tumor. WC was measured for all samples. The volumes of the samples were manually segmented in the last in-vivo MRIs, and the median WC and conductivity in these regions was derived using wEPT (Fig.4).
DISCUSSION & CONCLUSION
This study shows that the wEPT approach can be used to create WC maps in brain tumor-bearing rats by acquiring two T1-weighted images. Fig.4 illustrates that the same trend in WC values is predicted by in-vivo wEPT and ex-vivo measurements. However, the wEPT estimates of in-vivo WC in the samples are systematically higher than the measured values (Fig.4). This is probably because the T1 relaxation values in-vivo are higher than they are ex-vivo (results not shown). Furthermore, it needs to be clarified if the approach can be used to estimate conductivity maps from the WC maps for a frequency of 200 kHz. In the hundreds of MHz frequency range conductivity of tissue is mainly due to its WC, an assumption that might not hold for lower frequencies, where other factors, i.e. the cell’s membrane, contribute to a tissue’s conductivity3. Our initial tests are promising but still inconclusive (Fig.5.).Acknowledgements
No acknowledgement found.References
[1] S. Makarov et al., “Virtual Human Models for Electromagnetic Studies and Their Applications,” IEEE Rev. Biomed. Eng., vol. PP, no. 99, 2017.
[2] X. Zhang, J. Liu, and B. He, “Magnetic Resonance Based Electrical Properties Tomography: A Review,” IEEE Rev. Biomed. Eng., vol. 7, pp. 87–96, 2014.
[3] E. Michel, D. Hernandez, and S. Y. Lee, “Electrical conductivity and permittivity maps of brain tissues derived from water content based on T 1 -weighted acquisition,” Magn. Reson. Med., vol. 0, p. n/a-n/a, 2016.
[4] C. Wenger, Z. Bomzon, R. Salvador, P. J. Basser, and P. C. Miranda, “Simplified realistic human head model for simulating Tumor Treating Fields (TTFields),” in Engineering in Medicine and Biology Society (EMBC), 2016 38th Annual International Conference of the IEEE, 2016, pp. 5664–5667.
[5] R. Stupp et al., “NovoTTF-100A versus physician’s choice chemotherapy in recurrent glioblastoma: a randomised phase III trial of a novel treatment modality,” Eur. J. Cancer, vol. 48, no. 14, pp. 2192–202, Sep. 2012.
[6] R. Stupp et al., “Prospective, multi-phase III trial of Tumor Treating Fields together with Temozolomide comparted to Temozolomide alone in patients with newly diagnosed glioblastoma,” Neuro-Oncolgoy, vol. 18, no. suppl 6, p. LTBK-01, 2016.
[7] P. Yushkevich, J. Piven, H. Cody, S. Ho, J. C. Gee, and G. Gerig, “User-Guided Level Set Segmentation of Anatomical Structures with ITK-SNAP,” in The Insight Journal - 2005 MICCAI Open-Source Workshop, 2005.
Figures