5102
Dictionary-based Electric Properties Tomography for brain conductivity imaging1Philips Research Europe, Hamburg, Germany
Synopsis
Electric Properties Tomography (EPT) derives tissue conductivity and permittivity according to the Helmholtz equation via the second derivative of the measured complex B1 map, or by iteratively solving the corresponding forward problem. This abstract presents a different type of EPT reconstruction: the measured B1 map is compared locally with entries of a dictionary, which are small B1 maps of a priori known electric properties. This "dictionary-based EPT" (db-EPT) could be able to solve the transceive phase problem as well as the boundary problem of EPT. This study demonstrates the feasibility of db-EPT by measuring brain conductivity of healthy volunteers.
Purpose
Electric conductivity and permittivity can be derived from a measured complex B1 map solving the Helmholtz equation ("Electric Properties Tomography", EPT [1]). Conventional EPT reconstruction methods suffer from two major issues: the treatment of tissue boundaries, where conventional EPT reconstruction methods are prone to artefacts, and the required separation of transmit (TX) and receive (RX) components from the measured transceive (TRX) phase. To handle these problems, this study investigates a recently suggested type of EPT reconstruction [2]: the measured B1 map is compared locally with entries of a dictionary, which are small B1-maps of a priori known electric properties. This "dictionary-based EPT" (db-EPT) could be able to solve the transceive phase problem as well as the boundary problem of EPT.
Dictionary-based EPT is inspired by MR fingerprinting (MRF) [3]. However, while the dictionary of MRF is defined in the time domain, the dictionary in this EPT study is defined in the spatial domain.
Theory / Methods
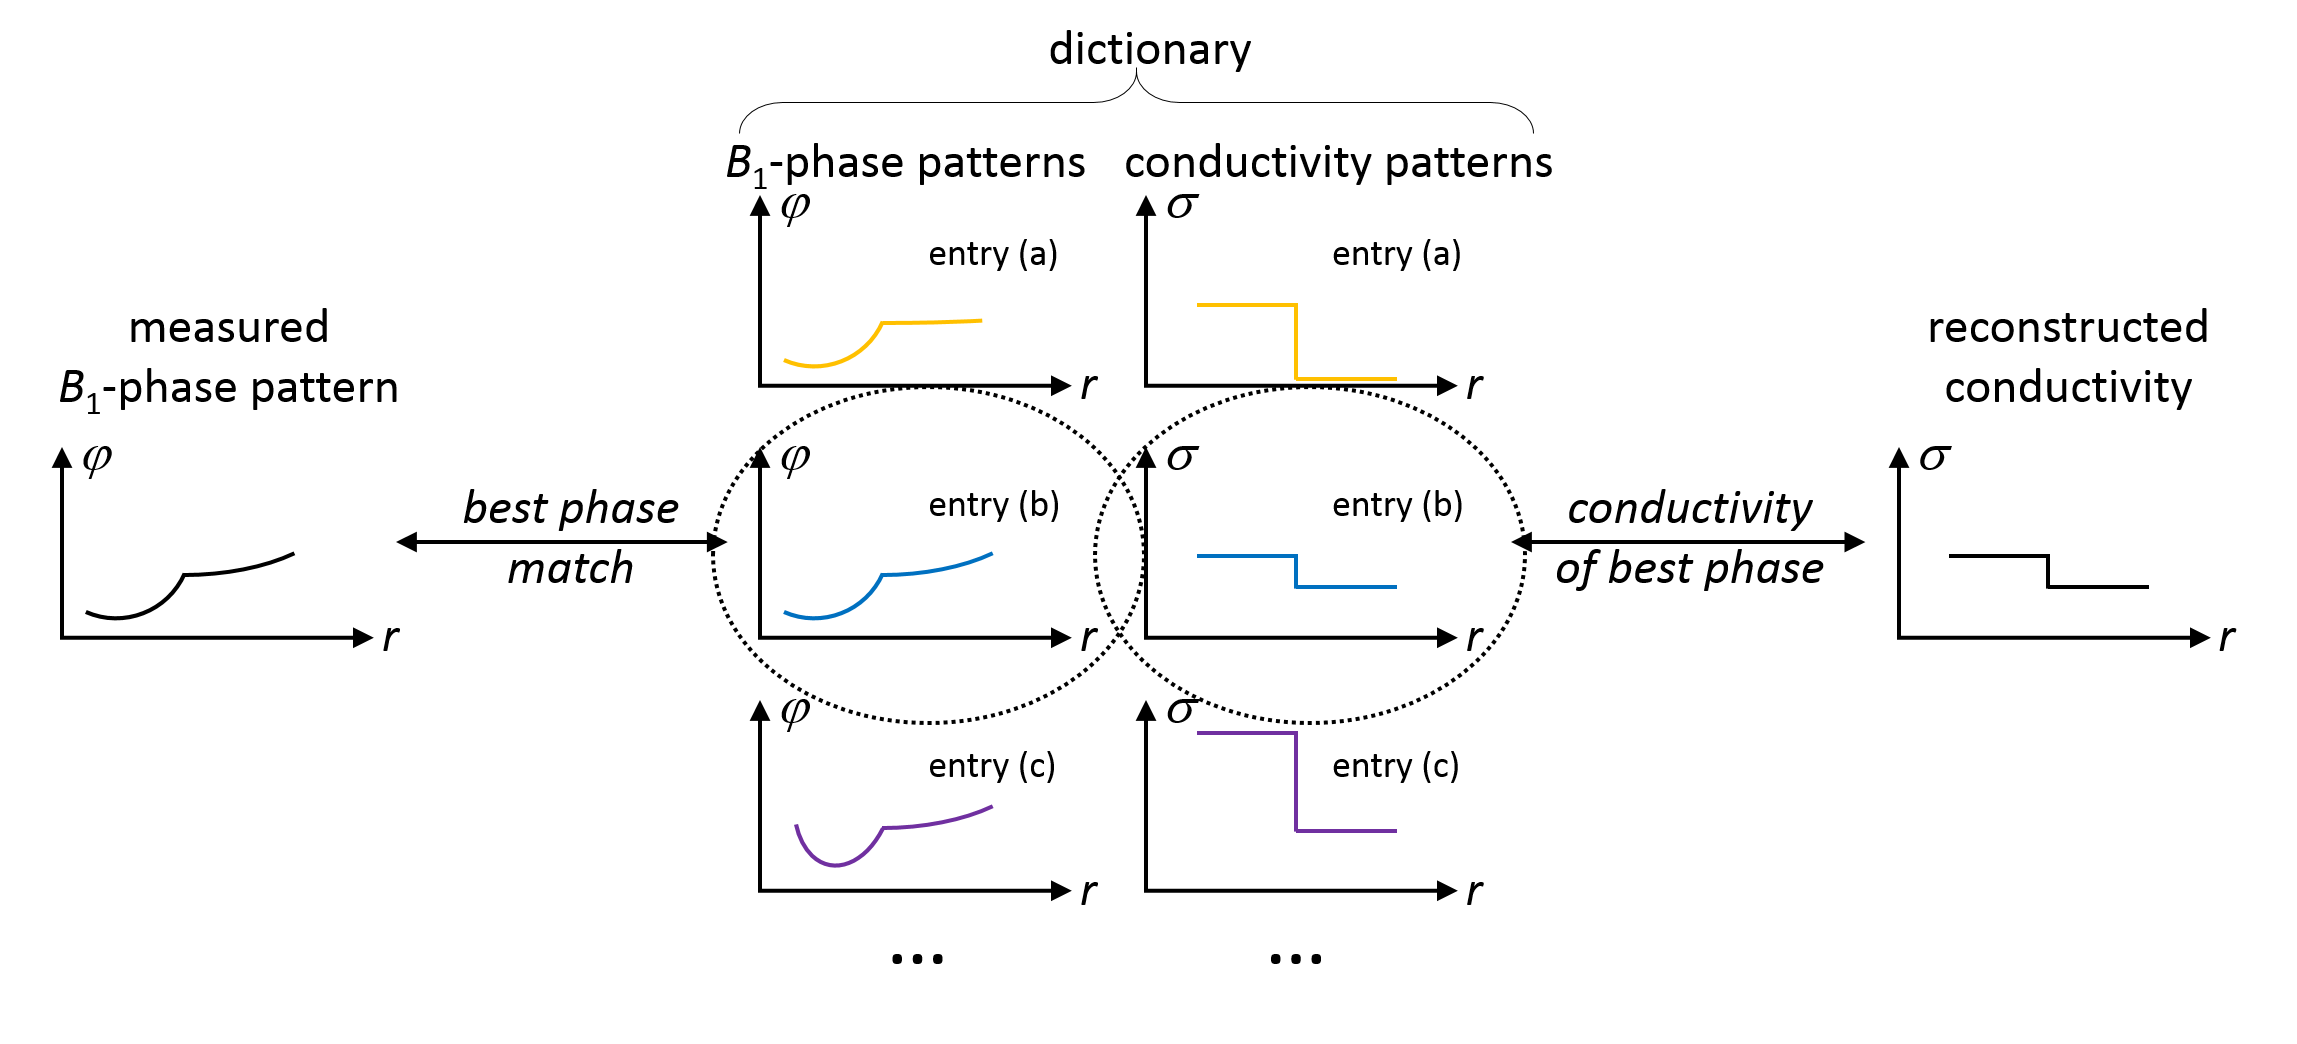
In this study, the entries of the dictionary are local B1 phase maps, having the shape of 3D-crosses with 3×9 voxels. The phase maps are extract from EM simulations (CONCEPT II, TU Hamburg-Harburg, Germany) of homogeneous spheres (Ø=20 cm) using a quadrature RF head coil (128 MHz). To cover the expected physiologic conductivity range, 20 different homogeneous spheres have been simulated with σ = 0.1 / 0.2 / ... / 1.9 / 2.0 S/m (all with relative permittivity εr = 50). The size of the resulting dictionary was roughly 70 MB. In this way, three different dictionaries have been created: (i) based on the TX B1 phase, (ii) based on RX B1 phase, (iii) based on TRX B1 phase (superposition of TX and RX phase corresponding to the experimental situation). The phase crosses stored in the dictionaries are compared locally with crosses of same size taken from the measured B1 phase (as illustrated in Fig. 1). The conductivity corresponding to the entry showing the best match with the measured phase is taken for reconstruction. The local phase matching error between measurement and dictionary serves as reliability map, particularly to compare the reliability of the three different dictionaries.
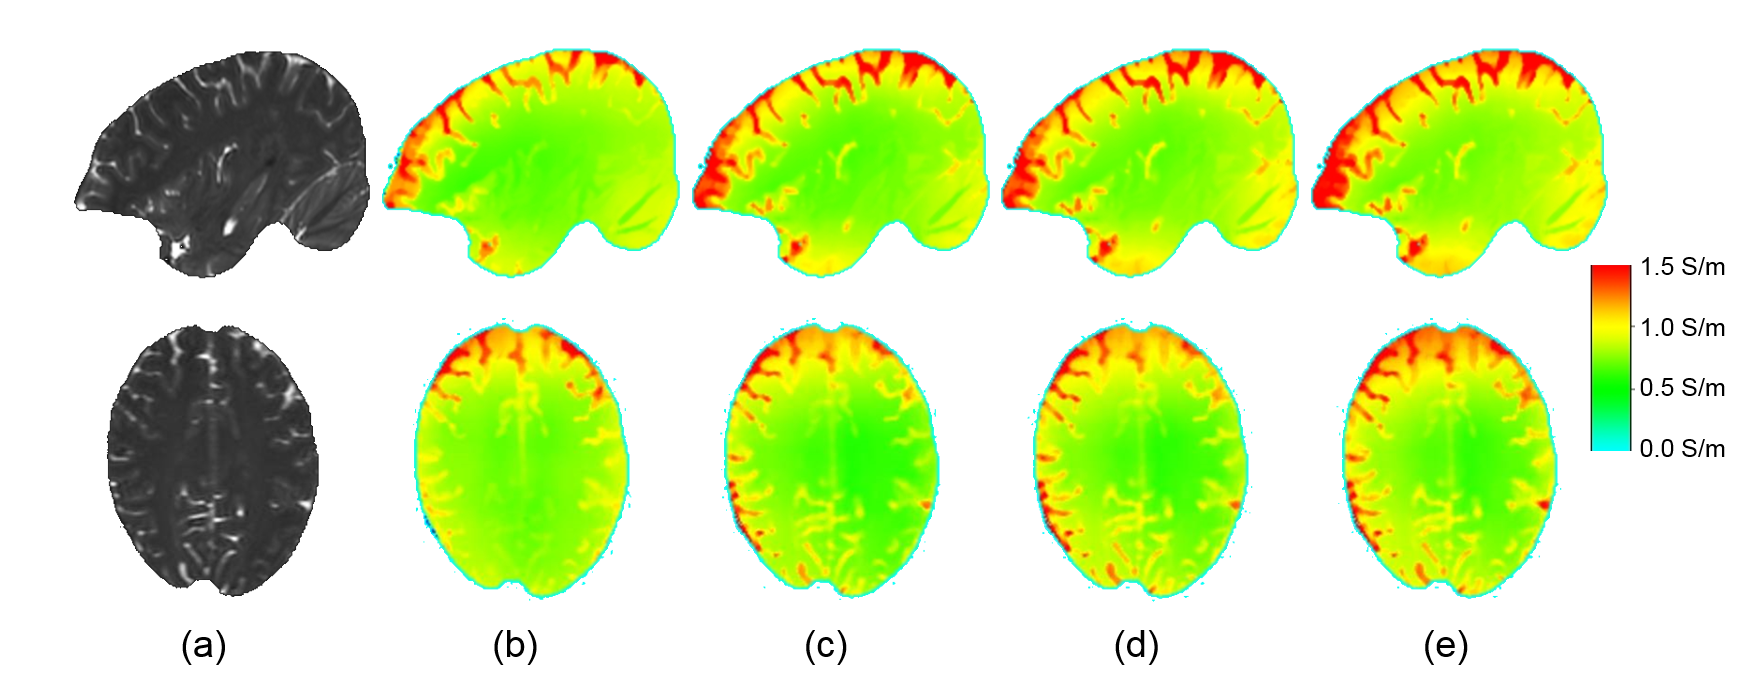
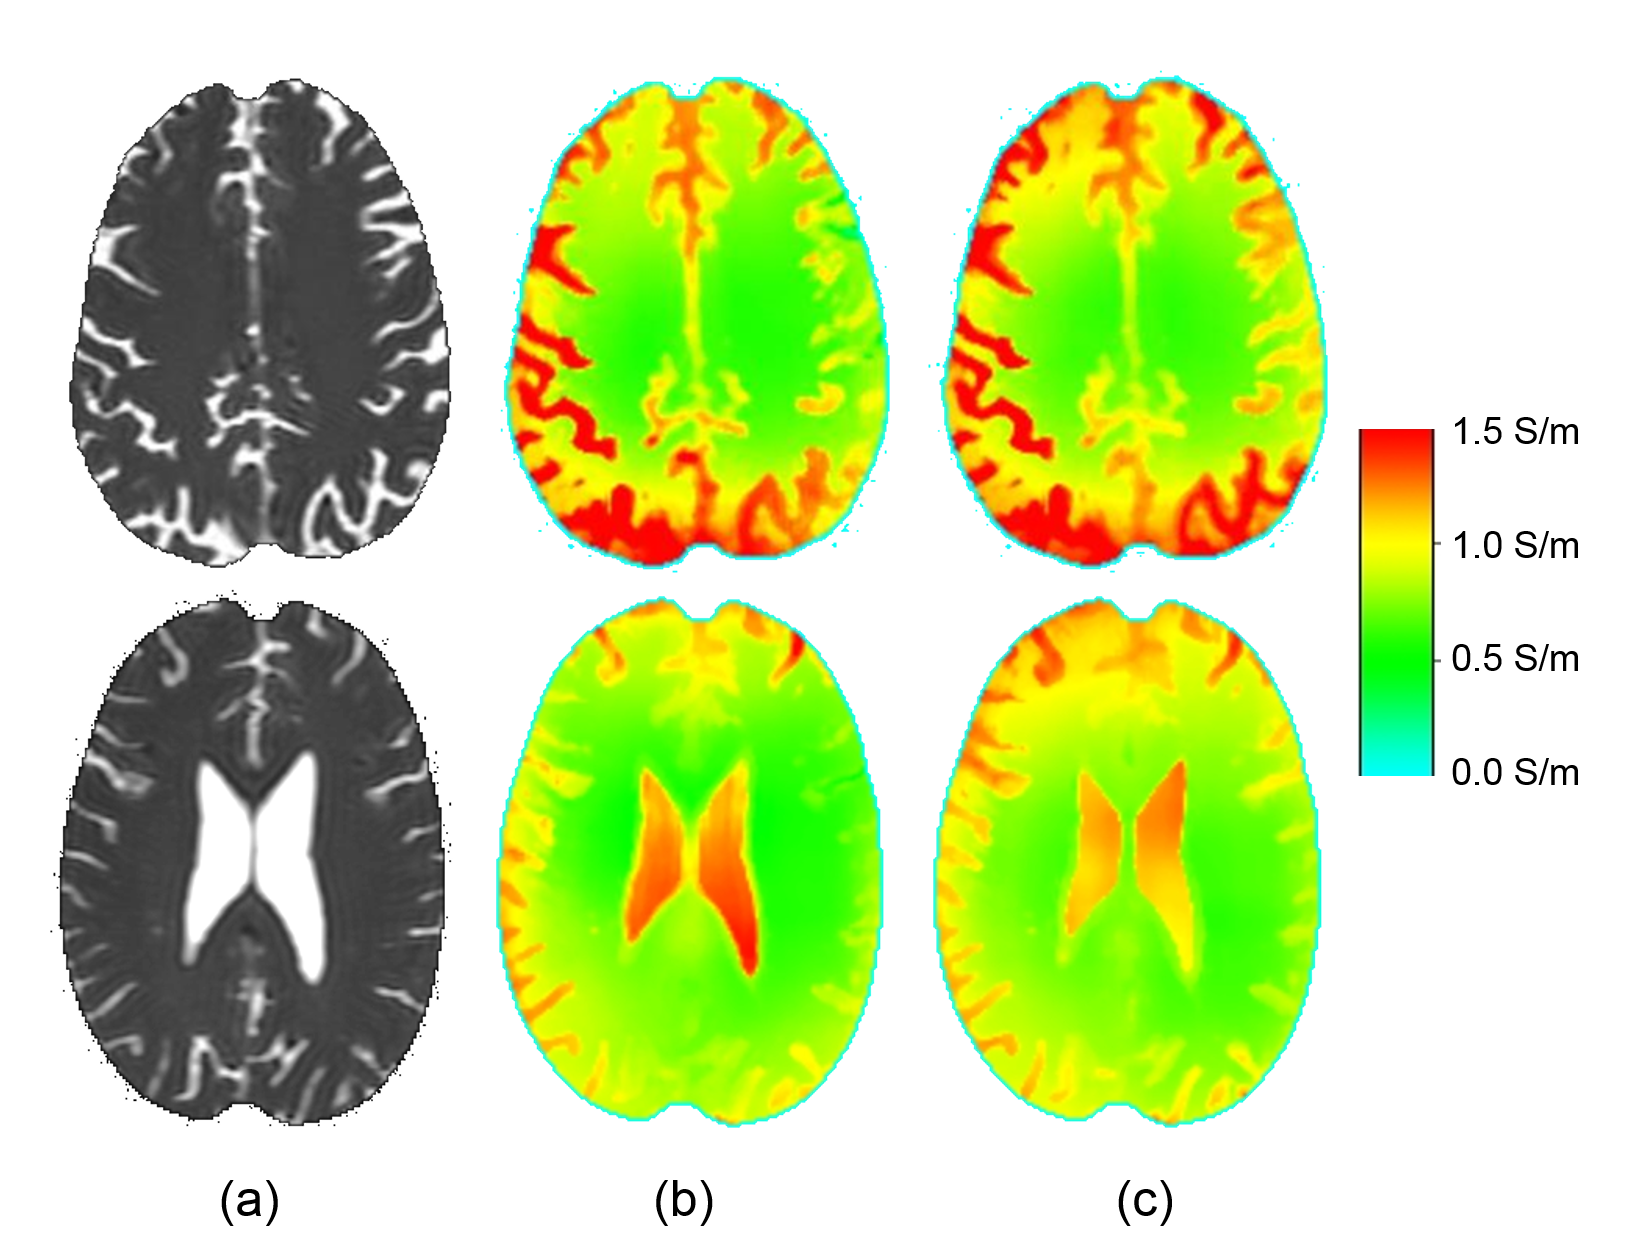
The brain of 3 healthy volunteers (one female, two males, age 48±9 yrs) with informed consent and local ethical approval were measured with a Steady-State-Free-Precession sequence (TR/TE=3.4/1.7ms; voxel=1×1×1 mm ; flip angle=25°, 3T Ingenia, Philips Healthcare, Best, Netherlands). CPU time for reconstructions was 1-2 minutes per slice using a 64-bit Intel processor (2.67 GHz, 12 GB RAM). Reconstruction results are compared with a corresponding, conventional reconstruction using numerical differentiation. For denoising, a bilateral median filter has been applied to the results of both, dictionary-based and conventional EPT.
Results
Fig. 2 shows results of one of the volunteers, comparing conventional EPT with EPT based on the three different dictionaries TX, RX, and TRX. Fig. 3 shows further results of the other two volunteers, comparing conventional EPT with EPT based on the TRX dictionary. It can be observed that
- differences in reconstructed conductivity comparing conventional and db-EPT are small,
- db-EPT tends to depict small brain structures more clearly than conventional EPT,
- differences in reconstructed conductivity comparing TX/RX/TRX-dictionaries are negligible.
In line with the third observation, the matching error did not yield a significant difference between the three dictionaries.
Discussion / Conclusion
This study confirms the feasibility of db-EPT. In contrast to conventional EPT, db-EPT is able to directly handle the measured TRX phase, thus circumventing the need to separate TX and RX contributions of the measured TRX phase. However, it turned out that corresponding differences are not significant, which confirms the usually applied “Transceive Phase Assumption” (i.e., approximate TX phase by halving TRX phase). Furthermore, it is expected that db-EPT is able to solve the boundary problem by using dictionary entries including discontinuous electric properties, representing tissue boundaries. Thus, db-EPT might offer a superior alternative for the B1-based reconstruction of electric properties.
Acknowledgements
References
[1] Haacke EM et al., Extraction of conductivity and permittivity using magnetic resonance imaging, Phys Med Biol 1991; 36: 723–734.
[2] Katscher U et al., Dictionary-based Electric Properties Tomography, ISMRM 2017; 25: 3641.
[3] Ma D et al., Magnetic resonance fingerprinting, Nature 2013;495:187–192.
Figures