5100
In Vitro Imaging of Therapeutic Effect of Curcumin on Liver Cirrhosis using MR-based Electrical Conductivity Imaging MethodBup Kyung Choi1, Nitish Katoch1, In Ok Ko2, Ji Ae Park2, Jin Woong Kim3, Hyung Joong Kim1, Oh In Kwon4, and Eung Je Woo1
1Biomedical Engineering, Kyung Hee University, Seoul, Republic of Korea, 2Korea Institute of Radiological and Medical Sciences, Seoul, Republic of Korea, 3Radiology, Chonnam National University Medical School, Gwangju, Republic of Korea, 4Konkuk University, Seoul, Republic of Korea
Synopsis
Curcumin has been used for the treatment of inflammatory diseases in oriental medicine, and its anti-inflammatory effect was recently reported. In this feasibility study, hepato-protective effect of curcumin was imaged in rat liver cirrhosis model, which was induced with dimethylnitrosamine (DMN). Magnetic resonance (MR)-based electrical conductivity imaging method was applied to evaluate tissue condition associated with protective effect. From electrical conductivity images, damaged liver tissues by DMN showed decreased conductivity than normal liver tissues. In contrast, cirrhotic tissues with curcumin treatment showed increased conductivity which was similar to normal tissue.
PURPOSE
The purpose of this study is to show the clinical feasibility of MR-based conductivity imaging method which can provide new contrast information on tissue condition indicating the therapeutic effect from animal cirrhosis models.METHODS
A total of 16 Sprague-Dawley rats (8 weeks old, weighing 260~280 g) were used for this study. All were healthy and without history of any known diseases. Liver cirrhosis was induced by an intraperitoneal injection of dimethylnitrosamine (DMN) in dose of 1 ml per 100g body weight.1 Rats were divided into 4 groups: normal control, DMN-only, DMN with lactulose, DMN with curcumin. After 6 weeks of treatment, we sacrificed the rats and obtained the liver blocks for both in vitro tissue phantom imaging and immunohistochemical examination. A cylindrical acrylic phantom with 13 cm in diameter and 16 cm in height was used for imaging experiment. The resected liver blocks containing the cirrhotic lesion (Fig. 1a and d) were positioned inside the center of the phantom. The phantom was filled with conductive material (agarose gel of 0.01 S/m conductivity) for supporting the position of the liver block (Fig. 1a and d). Four electrodes were attached on the sides of the phantom to inject imaging current. Following phantom preparation time of over 30 minutes, the phantom was placed inside the bore of 3T MRI scanner (Magnetom Trio A Tim, Siemens Medical Solutions, Erlangen, Germany). Using a current source, we injected a current of amplitude 1 mA and a pulse width of 81 ms. A multi-spin-echo ICNE pulse sequence was used to obtain the magnetic flux density (Bz) data.2 The imaging parameters were as follows: TR/TE = 1000/10, 20, 30 msec (3 echoes), FOV = 160 × 160 mm2, matrix size = 128 × 128, slice thickness = 3 mm (8 slices), NEX = 6, and total imaging time of 25 min. We used the single-step harmonic Bz algorithm implemented in CoReHA (conductivity reconstructor using harmonic algorithms) for multi-slice conductivity image reconstructions.3RESULTS AND DISCUSSION
In order to visualize the hepato-protective effect, the MREIT conductivity imaging experiment using two liver tissue phantoms was performed (Fig. 1). We can confirm the morphological information in MR magnitude images (Fig. 1b and e). There was no significant contrast among the experimental groups. But in the conductivity images (Fig. 1c and f), the contrast was highest in normal liver tissue and was lowest in DMN-only tissue. The conductivity contrast in both the treatment groups were significantly higher than that of DMN-only tissue. Specifically, the conductivity of DMN with curcumin was slightly higher than that of lactulose. The results of both two phantoms showed a similar pattern. For quantitative analysis, we measured the conductivity values of all liver tissues corresponding to experimental groups (Fig. 2). The conductivity value was highest in normal control and was lower in the order of DMN with curcumin, DMN with lactulose, and DMN-only groups. The conductivity of treatment groups were significantly higher than those of DMN-only group. Therefore, it is possible to explain that curcumin has the hepato-protective effect from the bioelectromagnetic standpoint.CONCLUSION
In this feasibility study, we applied MR-based electrical conductivity imaging method to image the therapeutic effect of herbal medicine. By comparing the electrical tissue conductivity, the experimental results of curcumin were comparable to those of lactulose which is a positive effector on liver cirrhosis. Conductivity images shown in this study indicated that conductivity contrast between the treatment groups are distinguishable in a different way compared with conventional MR image techniques.Acknowledgements
This work was supported by the National Research Foundation of Korea (NRF) and Korea Institute of Radiological and Medical Sciences (KIRAMS) grants funded by the Korea government (No. 2015R1D1A1A09058104, 2016R1A2B4014534, 2017R1A2A1A05001330 and 1711045539;1711045541/50461-2017)References
- George J et al. Dimethylnitrosamine-induced liver injury in rats: the early deposition off collagen. Toxicology 2001;156:129-138.
- Minhas AS et al. Experimental performance evaluation of multi-echo ICNE pulse sequence in magnetic resonance electrical impedance tomography. Magn. Reson. Med. 2011:66;957-965.
- Oh TI et al. Feasibility of magnetic resonance electrical impedance tomography (MREIT) conductivity imaging to evaluate brain abscess lesion: In vivo canine model. J Magn. Reson. Imaging 2013;38:189-197.
Figures
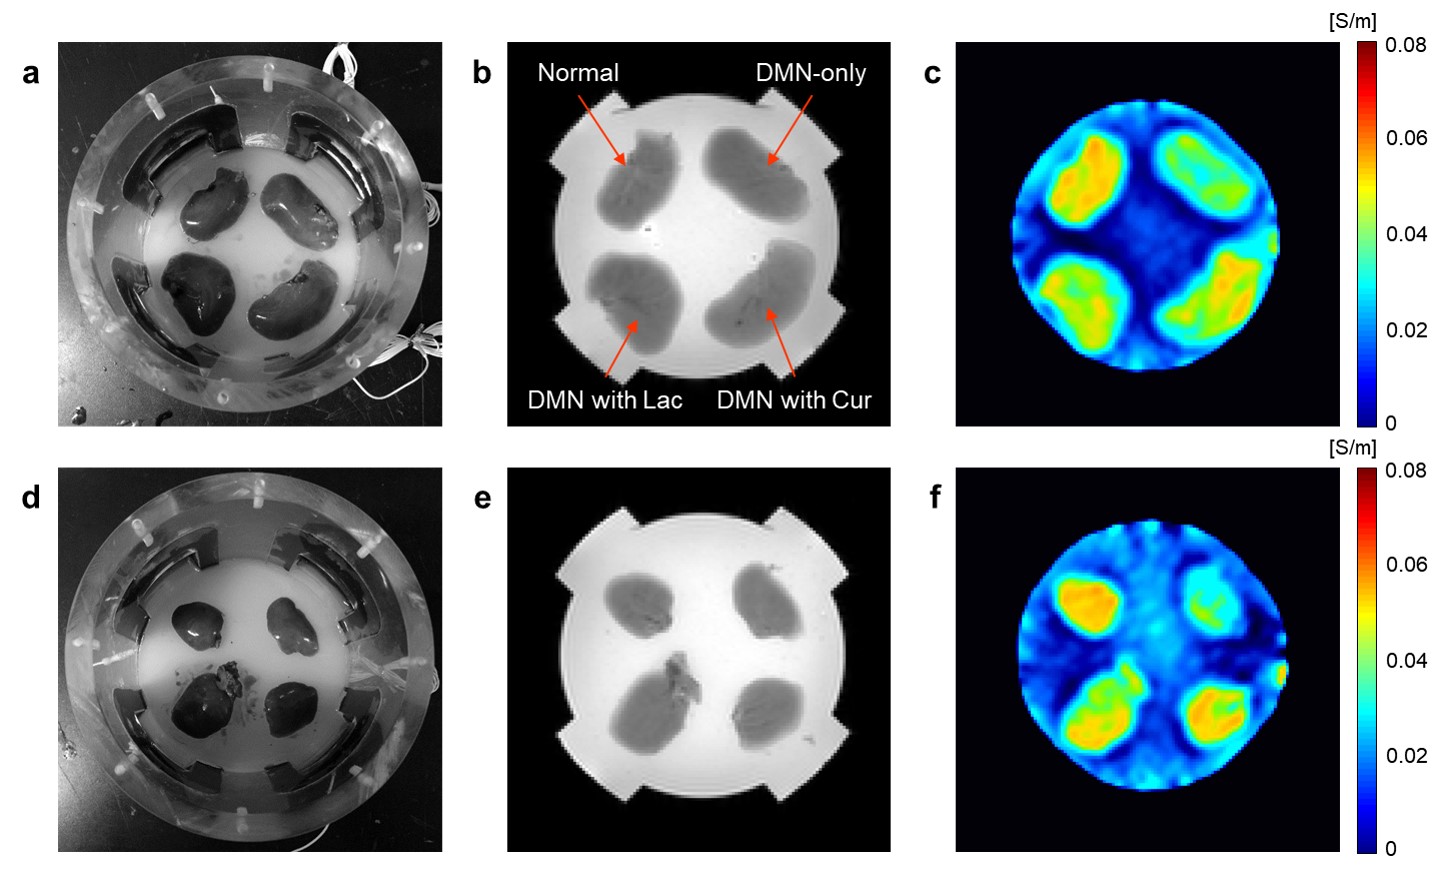
Fig. 1. In vitro
MREIT images of two liver tissue phantoms. (a and d) Phantom consisted of 4
liver blocks including normal control, DMN-only, DMN with lactulose, and DMN
with curcumin. (b and e) MR magnitude images provide morphological information
on liver tissue phantom. (c and f) Electrical conductivity images of liver
tissues indicate contrast information depending on their tissue condition.
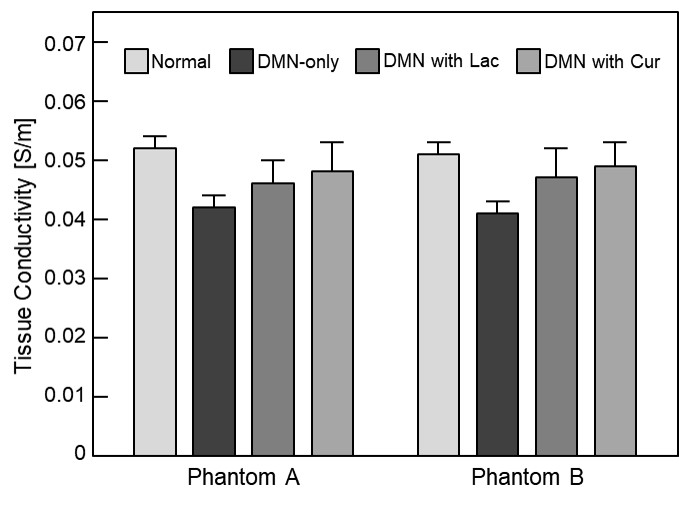
Fig. 2. Bar
graph showing quantitative analysis of conductivity contrast at 4 different
experimental groups.