5096
In-vivo validation of water content Electrical Properties Tomography reconstructions in white matter using independent MR-EPT measurements1Center for Image Sciences, UMC Utrecht, Utrecht, Netherlands, 2Rudolf Magnus Institute for Neuroscience, UMC Utrecht, Utrecht, Netherlands
Synopsis
MR-Electrical Properties Tomography (MR-EPT) can provide accurate mean conductivity values in large homogeneous tissues such as the white matter, provided sufficient erosion to avoid boundary regions. Water-content-EPT (wEPT) has been recently proposed to reconstruct EPs on a voxel-to-voxel basis. However, wEPT uses an empirical model calibrated with literature EPs values, assumed correct, obtained from ex-vivo probe measurements. In this work, the validity of the model employed in wEPT is verified for white matter conductivity reconstructions by using in the wEPT model calibration the mean white matter conductivity value obtained from in-vivo MR-EPT reconstructions as an independent modality.
Introduction
MR-Electrical Properties Tomography (MR-EPT) aims to reconstruct tissue Electrical Properties (EPs: conductivity σ, permittivity εr) from complex $$$B_1^+$$$ field maps. However, MR-EPT reconstructions can only be used to compute mean EPs values in large volumetric areas1, since they suffer from noise amplification and errors at tissue boundaries.
In parallel, water-content-EPT (wEPT) has been recently proposed to reconstruct EPs on a voxel-to-voxel basis from water-content maps. However, wEPT uses an empirical model2 calibrated with literature EPs values, assumed correct, obtained from ex-vivo probe measurements. Here, the validity of wEPT is verified for white matter conductivity reconstructions (σWM) using in the wEPT model calibration the mean σWM value obtained from in-vivo MR-EPT reconstructions as an independent modality.
Methods
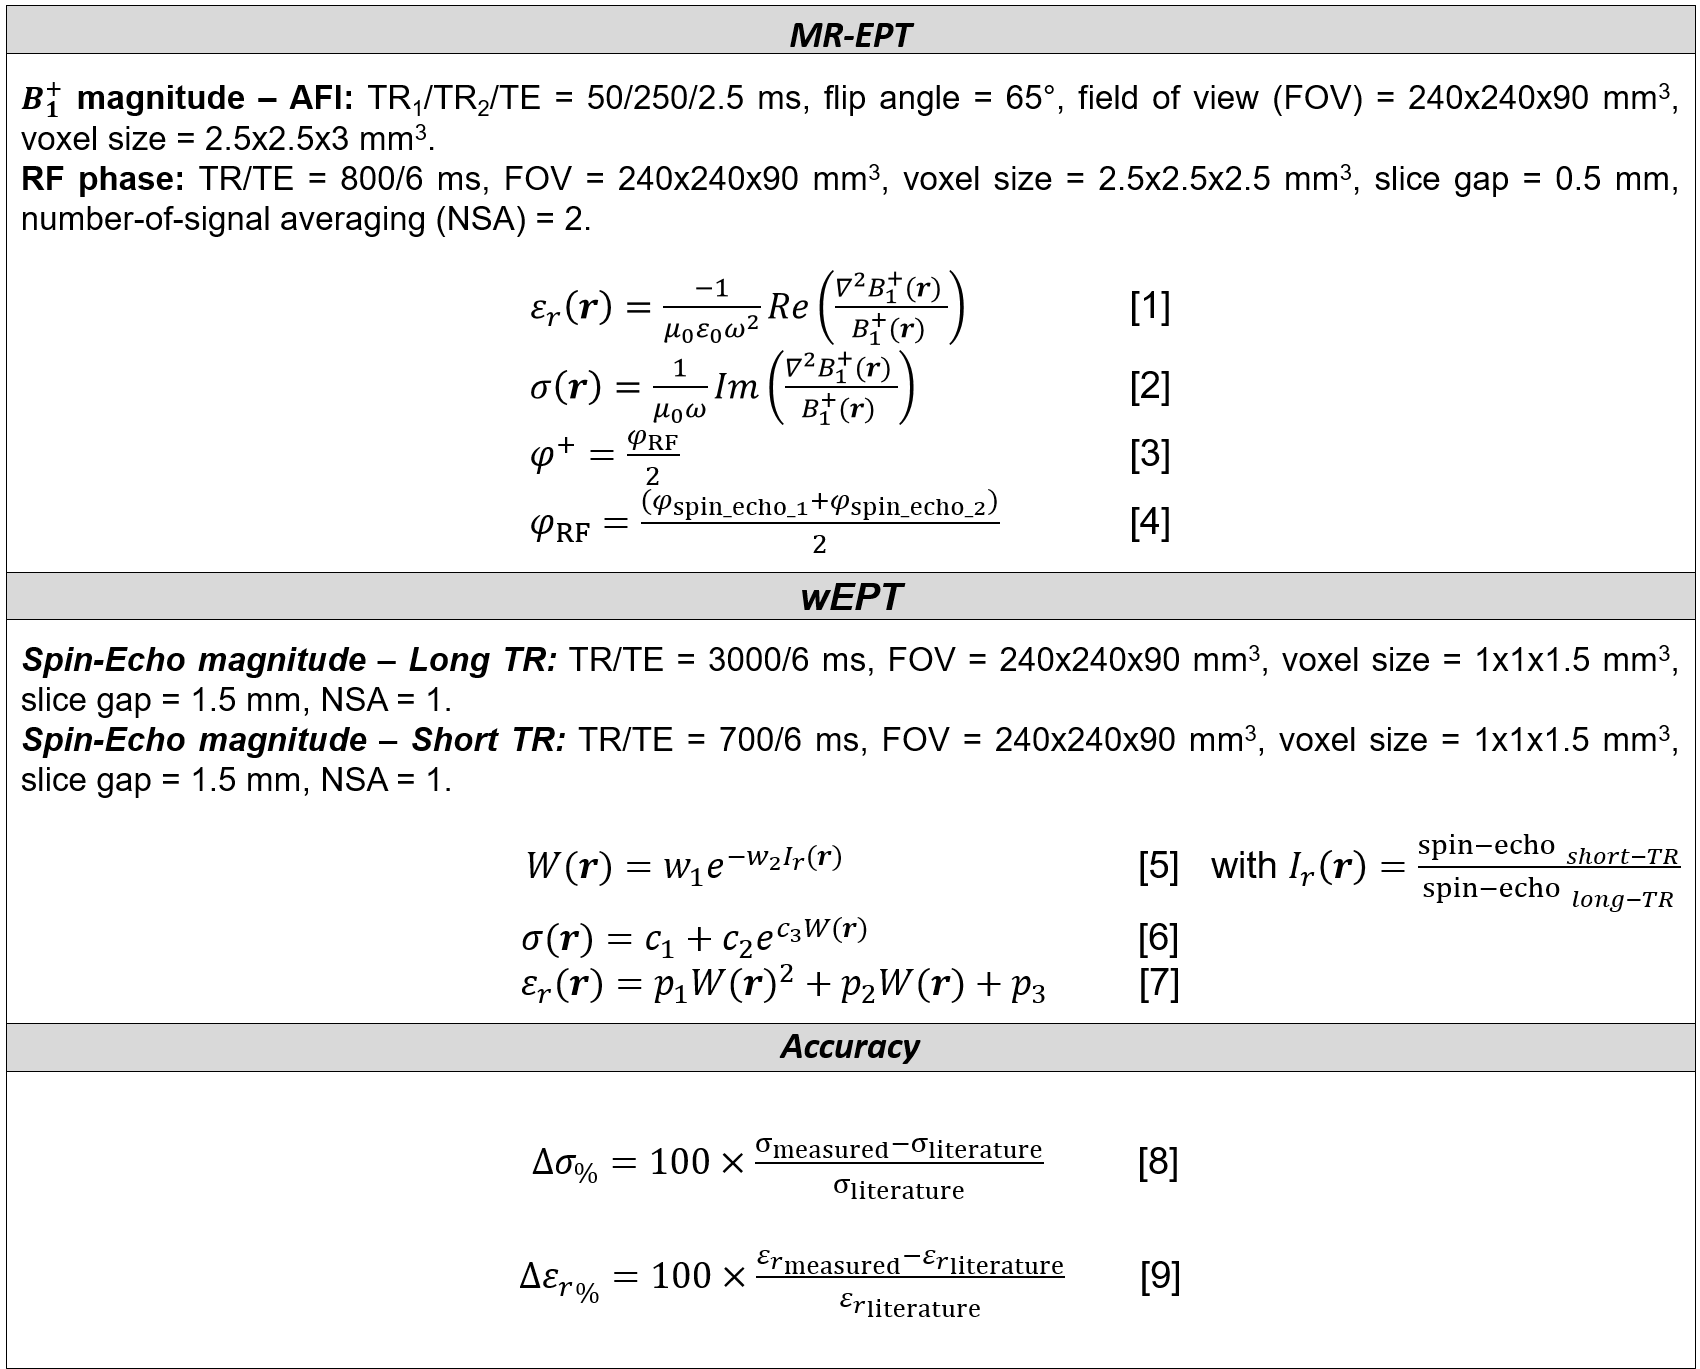
MR-measurements (3T, Achieva, Philips, NL) were performed on eight healthy volunteers using an 8-channel transmit/receive head coil (Fig.1: sequence parameters and equations).
MR-EPT reconstructions3 were performed according to eqs.[1-2]. The $$$B_1^+$$$ magnitude was measured with the AFI sequence4. For the $$$B_1^+$$$ phase, the transceive phase assumption5 was adopted (eq.[3]). RF phase maps were obtained by combining two phase maps acquired using two Spin-Echo sequences with opposite readout gradient polarities (eq.[4]). Gibbs ringing correction and k-space Gaussian apodization were also performed6.
wEPT reconstructions were performed as in ref.(2). Eq.[5] was used to compute water-content maps (W) from image-ratio maps (Ir: division of two T1-weighted Spin-Echo maps with different TRs). Then, EPs maps were derived from water-content maps according to eqs.[6-7]. The parameters c1/2/3/p1/2/3 were calibrated using literature EPs values (first analysis), or the mean σWM value among subjects obtained from independent MR-EPT reconstructions (second analysis).
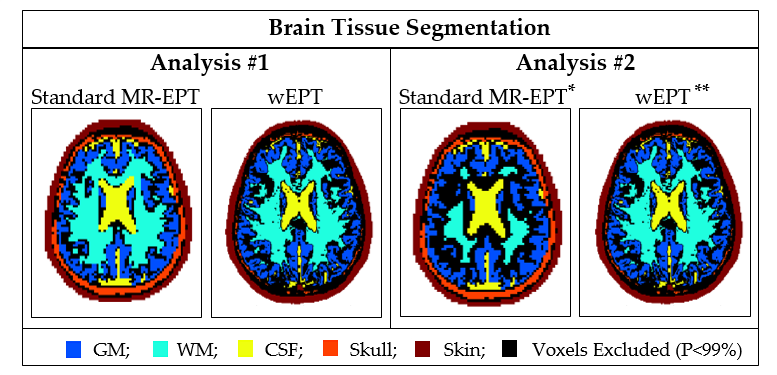
First analysis: the accuracy (eqs.[8-9]) of MR-EPT and wEPT reconstructions was assessed for WM, GM, and CSF (Fig.2) with respect to literature values. For MR-EPT reconstructions, a 2D-derivative kernel (K7: 7×7 voxels) was used6. wEPT reconstructions were performed according to eqs.[6-7], whose parameters were calibrated using literature EPs values2.
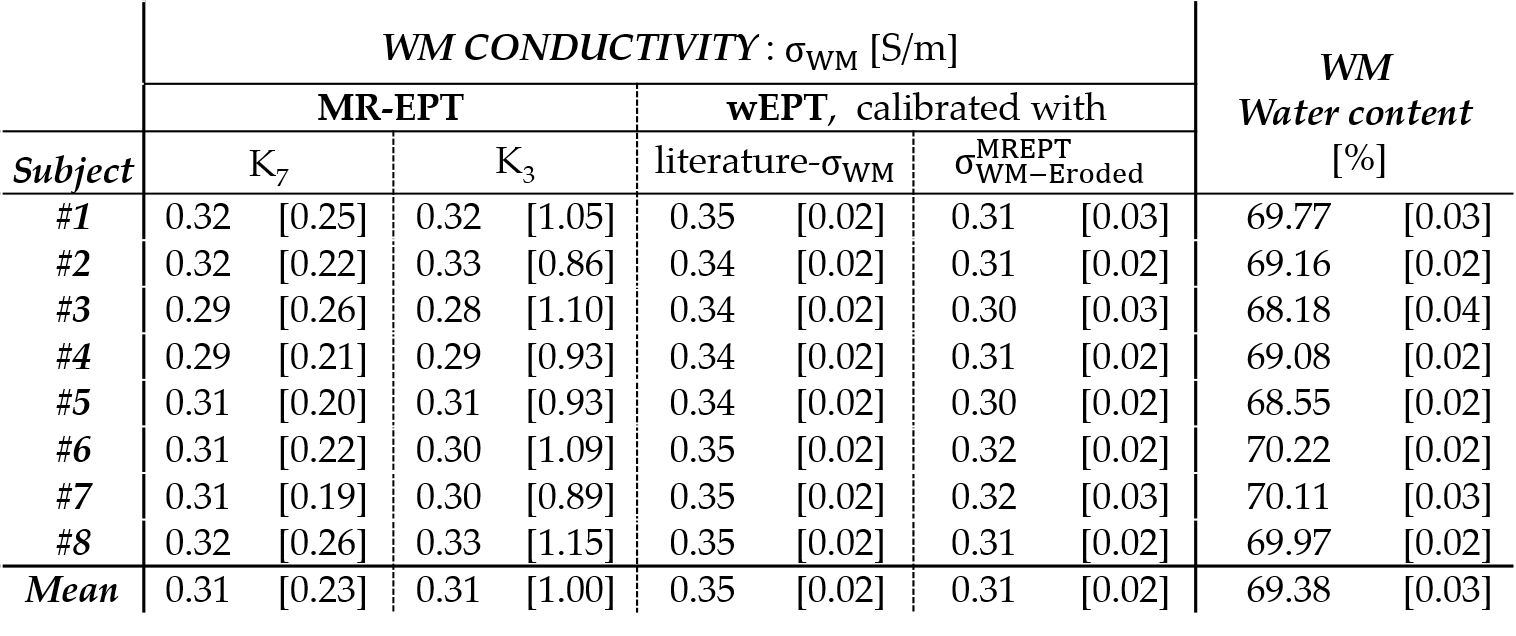
Second analysis: we verified eq.[6] of wEPT for the WM using independent MR-EPT reconstructions. First, MR-EPT reconstructions were performed using both K7 and a smaller kernel (K3, del2 Matlab function). Then, WM erosion of 2 voxels was performed to avoid regions affected by boundary errors (Fig.2). The mean MR-EPT-σWM value was therefore computed among the subjects ($$$σ_{WM-Eroded}^{MREPT}$$$). Finally, this $$$σ_{WM-Eroded}^{MREPT}$$$ value (average among subjects) was used to recalibrate the wEPT model parameters c1/2/3. Mean wEPT-σWM values were recomputed for all subjects and compared with the values previously obtained from the wEPT model calibrated with the literature-σWM value.
Results and Discussion
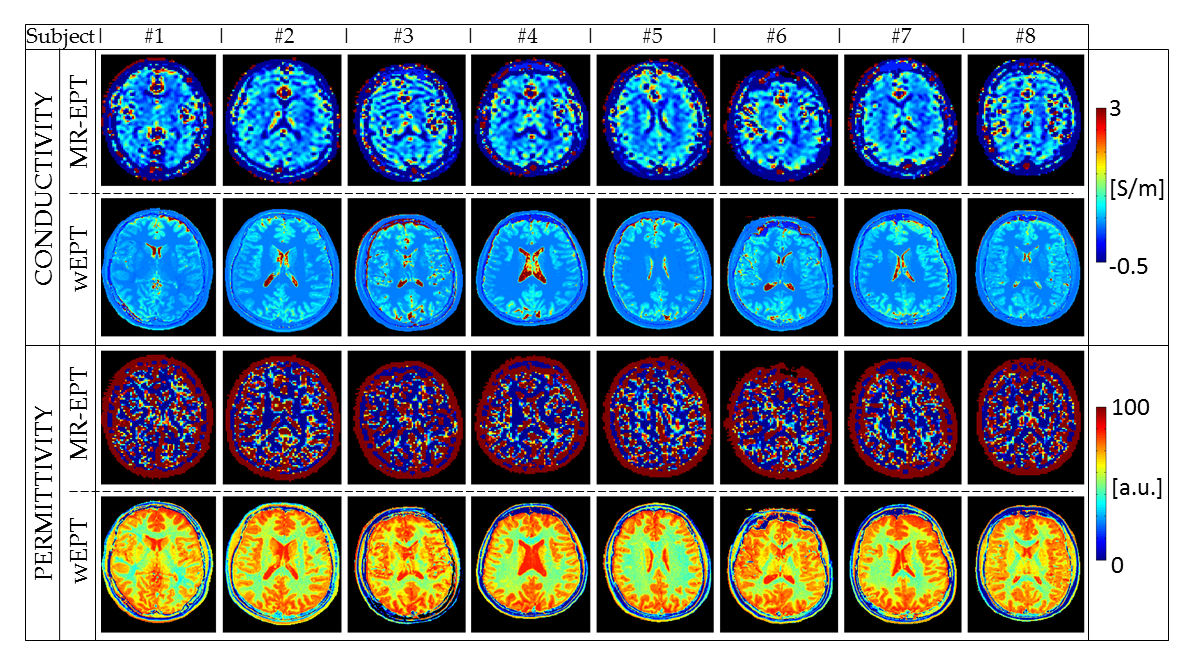
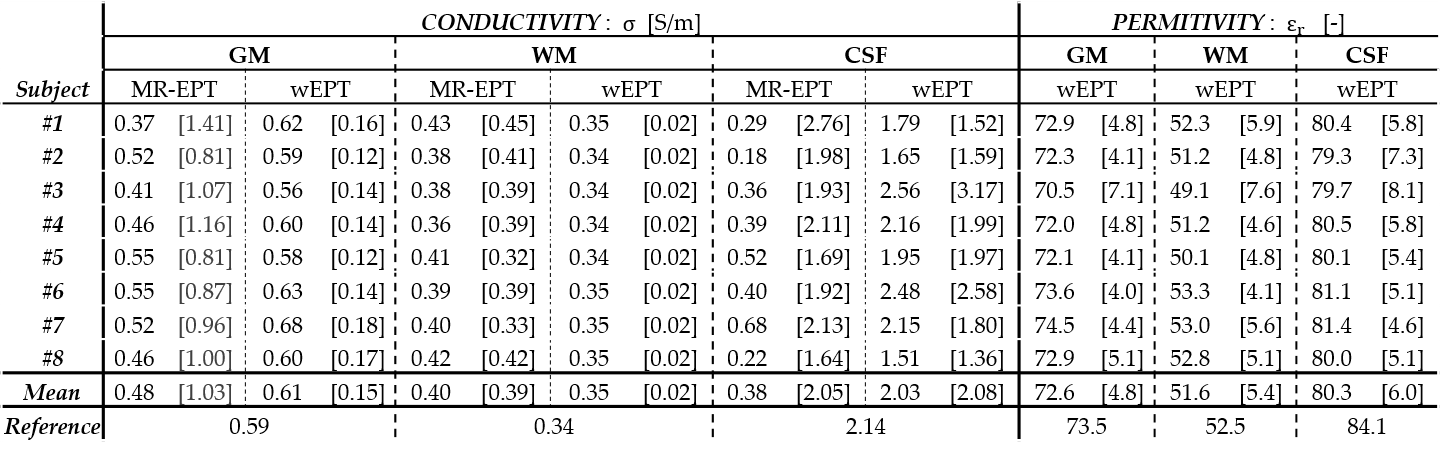
First analysis: Fig.3 shows MR-EPT and wEPT reconstructions. Tab.1 reports mean EPs and standard deviations values for the GM, WM, and CSF tissue. MR-EPT conductivity reconstructions are not accurate on a voxel-to-voxel basis, as shown in ref.(6). The mean MR-EPT-σWM value among subjects is 0.4 S/m (~20% overestimation compared to the literature value). MR-EPT-σGM and MR-EPT-σCSF values are underestimated due to severe boundary errors. MR-EPT permittivity reconstructions are not feasible.
wEPT allows more spatial details than MR-EPT in less scan time, and the reconstructed EPs values agree with literature values (∆σ%,∆ε%<5%).
Second analysis: after WM erosion, $$$σ_{WM-Eroded}^{MREPT}$$$ values are: 0.31±0.23 and 0.31±1.00 S/m for K7 and K3, respectively (Tab.2). K3 reconstructions are less noise-robust than K7 reconstructions, but allow less boundary error extension. The good agreement between K7 and K3 reconstructions indicates that the performed erosion was sufficient to avoid boundary errors. Still, the reconstructed $$$σ_{WM-Eroded}^{MREPT}$$$ values show ~10% underestimation compared to the literature-σWM value. This can be attributed to the use of 2D derivative kernels. Additionally, the observed high standard deviations indicate low precision. Thus, the observed variability in mean MR-EPT-σWM values can not be linked to inter-subject variations.
Mean wEPT-σWM values reconstructed using $$$σ_{WM-Eroded}^{MREPT}$$$ in the calibration of eq.[6] show an underestimation of ~10% with respect to the mean wEPT-σWM values reconstructed in the first analysis (wEPT model calibrated with literature EPs values). The ~10% underestimation in the mean wEPT-σWM values is, however, just a consequence of the bias introduced by the use of 2D kernels in the $$$σ_{WM-Eroded}^{MREPT}$$$ reconstructions. This verifies the validity of the wEPT model calibrated using literature EPs values for the WM region. Unfortunately, since this erosion can not be applied for the GM and CSF due to their limited spatial extension, this verification can not be performed in these regions.
Conclusions
MR-EPT can provide accurate mean conductivity values in large homogeneous regions (WM), provided sufficient erosion. The wEPT model has been verified for σWM reconstructions in healthy subjects. Care has to be taken for pathological cases, since the wEPT model is calibrated using healthy brain tissues EPs values.Acknowledgements
No acknowledgement found.References
1. Shin J, Kim MJ, Lee J, Nam Y, Kim M, Choi N, Kim S, Kim D-H. Initial study on in vivo conductivity mapping of breast cancer using MRI. J. Magn. Reson. Imaging 2014:371–378. doi: 10.1002/jmri.24803.
2. Michel E, Hernandez D, Lee SY. Electrical conductivity and permittivity maps of brain tissues derived from water content based on T 1 -weighted acquisition. Magn. Reson. Med. 201; 77:1094-1103. doi: 10.1002/mrm.26193.
3. Katscher U, van den Berg C a. T. Electric properties tomography: Biochemical, physical and technical background, evaluation and clinical applications. NMR Biomed. 2017: early view. doi: 10.1002/nbm.3729.
4. Yarnykh VL. Actual flip-angle imaging in the pulsed steady state: A method for rapid three-dimensional mapping of the transmitted radiofrequency field. Magn. Reson. Med. 2007;57:192–200. doi: 10.1002/mrm.21120.
5. Van Lier ALHMW, Brunner DO, Pruessmann KP, Klomp DWJ, Luijten PR, Lagendijk JJW, Van Den Berg CAT. B1+ phase mapping at 7 T and its application for in vivo electrical conductivity mapping. Magn. Reson. Med. 2012;67:552–561. doi: 10.1002/mrm.22995.
6. Mandija S, Sbrizzi A, Katscher U, Luijten PR, van den Berg CAT. Error Analysis of Helmholtz-based MR-Electrical Properties Tomography. Magn. Reson. Med. 2017;early view. doi: 10.1002/mrm.27004.
Figures