5093
LCF Artifact Elimination in cr-MREPT using Phased-Array Receive Coil1Electrical and Electronics Engineering Department, Bilkent University, Ankara, Turkey
Synopsis
Convection-reaction equation based MREPT (cr-MREPT)1 conductivity images suffer from LCF artifact at low convective field (LCF) regions. Padding2 method has been proposed to overcome this issue but it requires additional acquisition, prolonging the total time. In this paper, we propose using data from different channels of phased-array receive coil to eliminate LCF artifact without requiring extra acquisitions.
Introduction
Convection-reaction equation based MREPT (cr-MREPT), which uses transmit field (B1+) only, has been developed by Hafalir et.al.1 and the corresponding partial differential equation (PDE) for 2D reconstruction is as follows: $$$\it F\cdot\overline{\triangledown}u+\triangledown^{2}H^{+}u-i\omega\mu_{0}H^{+}=0$$$, where $$$u=1/(\sigma+iw\epsilon_{0}\epsilon_{r})$$$ is the unknown admittance, $$$H^{+}$$$ is transmit magnetic field, $$$F=\begin{bmatrix}F_{x} \\F_{y} \end{bmatrix} = \begin{bmatrix} \frac{\partial H^{+}}{\partial x}-i\frac{\partial H^{+}}{\partial y} \\i\frac{\partial H^{+}}{\partial x}+\frac{\partial H^{+}}{\partial y} \end{bmatrix}$$$ is the convective field. Since $$$F_{y}=iF_{x}$$$, it suffices to display $$$F_{x}$$$ in order to observe the behaviour of the convective field. Using cr-MREPT, an artifact occurs in reconstructed images where convective field is low. Use of high dielectric pads to eliminate Low Convective Field (LCF) artifact has been proposed as a solution2; however, it extends the acquisition time. Also, B1- based cr-MREPT has been proposed by Gurler et.al.3, but it fails to remove the LCF artifact in some cases.
It is a common practice to use quadrature birdcage body coil (QBC) as the transmit coil since it provides homogeneous B1+ field, e.g. at 3T, and to use multichannel phased-array head coil (PA) as the receive coil due to its better SNR characteristics. Application of cr-MREPT in such coil combination may result in erroneous reconstructions due to failure of the Transceive Phase Approximation (TPA)4. In addition, using data from a single channel of a phased-array results in LCF artifacts. In this paper, we propose combining multichannel data in order to get rid of LCF artifacts and we compare the results with B1+ based padding method in which TPA holds.
Methods
Phantom experiments have been conducted with Siemens Tim Trio 3T MR Scanner (Erlangen, Germany). Using a z-independent phantom, conductivities are reconstructed in 2D. There will be three different data acquisition methods that are going to be compared.
To make use of the above PDE, one needs a data set that consists of H+ magnitude and H+ phase. In all methods, H+ magnitude is obtained with double-angle (DA) method. In the classic method, QBC is used for both transmit and receive. In this case, since TPA is valid, half of the transceive phase, obtained by SSFP, is taken as the transmit phase and one data set is obtained. In the padding method, a BaTiO3 pad is used to eliminate LCF artifact2. Two consequtive experiments with the pad located on the left or on the right side of the object are conducted using the same acquisiton technique as in classic method. To combine these two data sets with different pad locations, cr-MREPT PDE is converted into a linear algebraic system for each set and the systems of equations are solved simultaneously. The proposed method uses QBC for transmit and PA for receive. For each channel, H+ phase is taken as half of the transceive phase. One experiment is conducted for this method but four data sets are obtained from four channels. Data of all channels are combined in a similar way as in padding.
Results
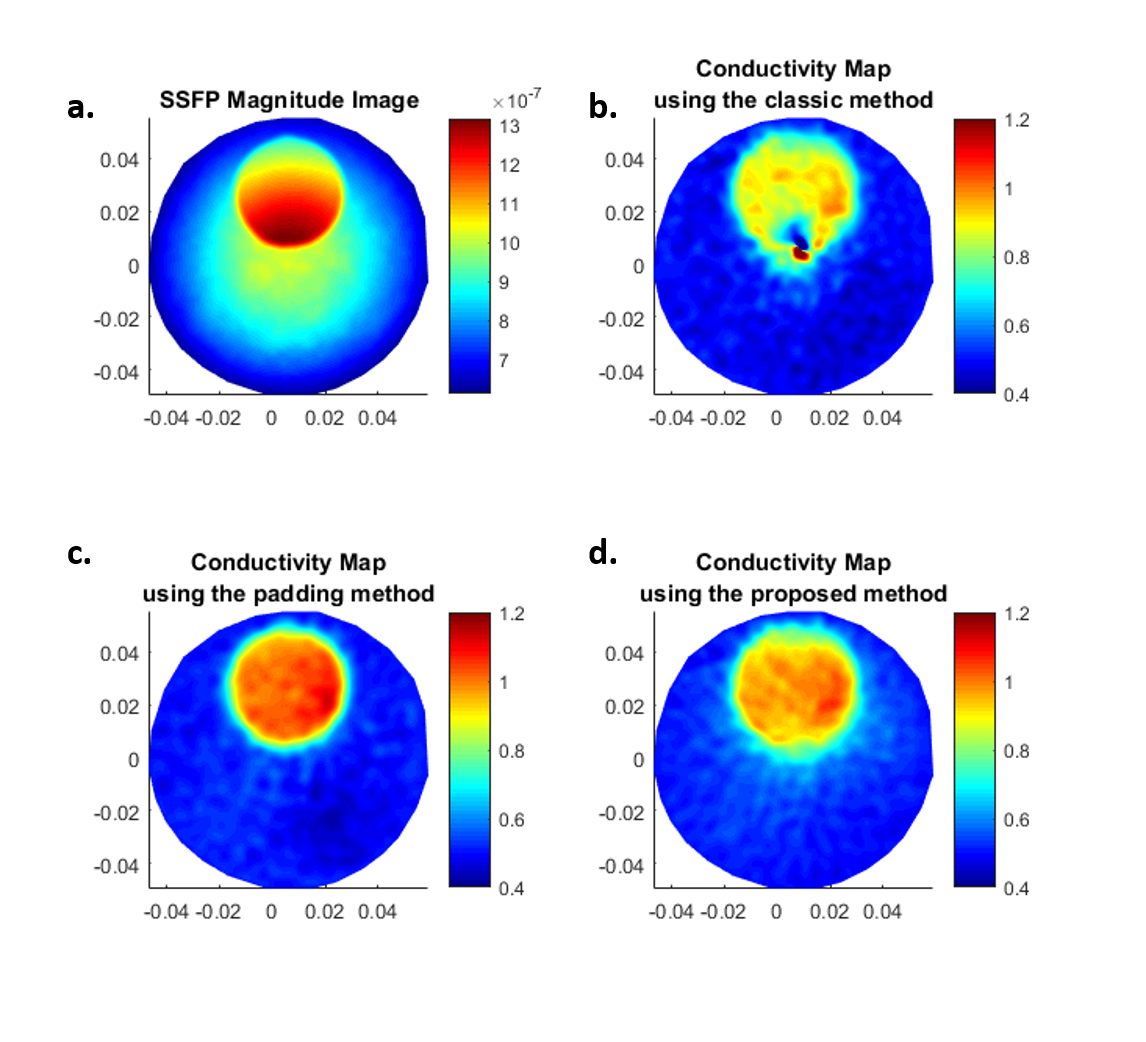
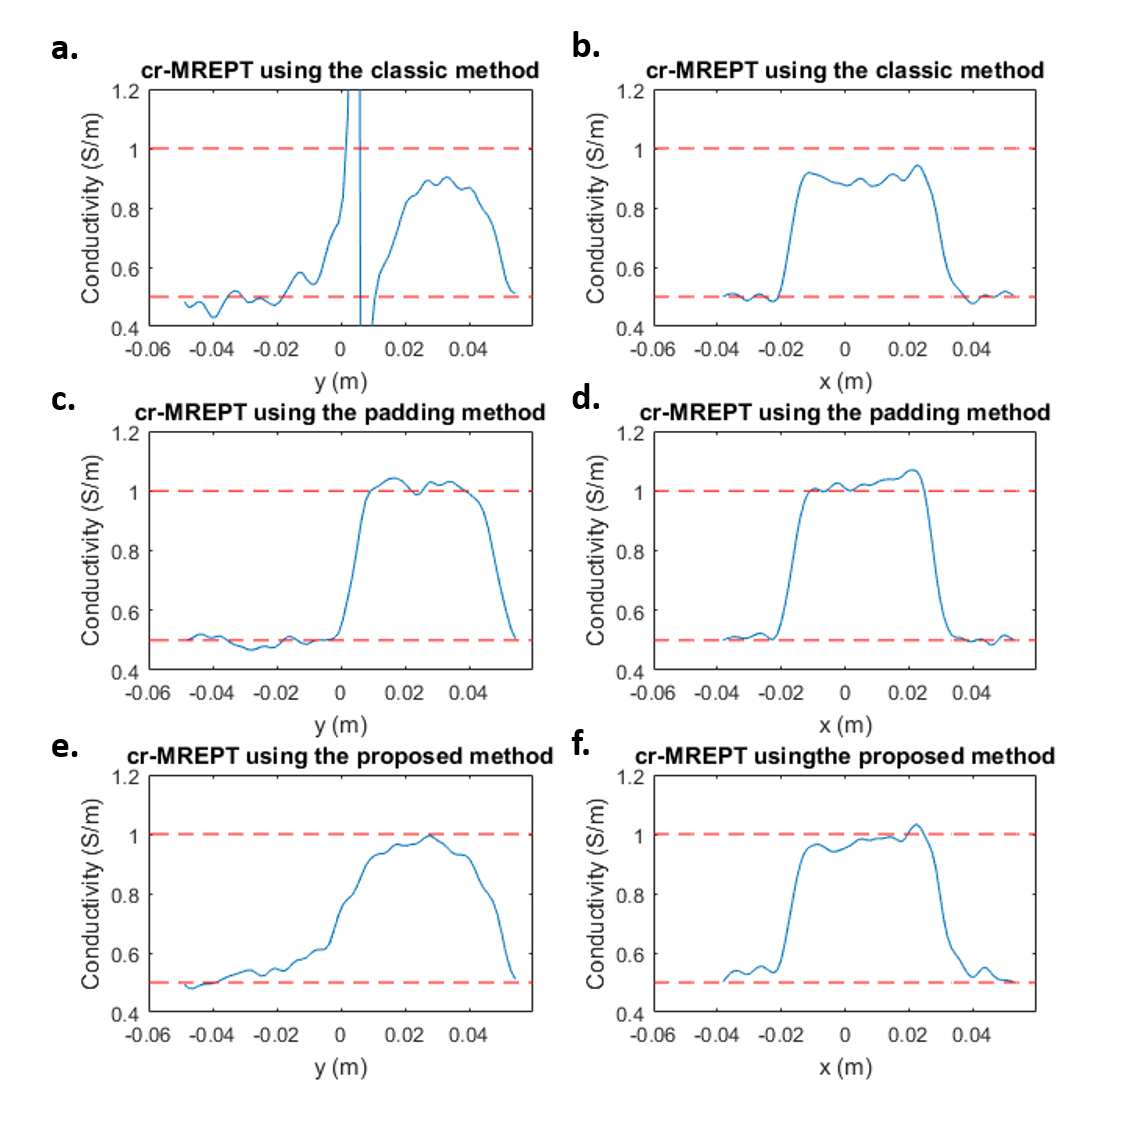
Figure-1 shows the obtained magnitude and phase values for each method. Figure-2 shows the conductivity images and the corresponding convective fields of individual channels which are obtained using the proposed method. Low convective regions are in different positions for different channels and therefore in the conductivity images LCF artifacts appear in vicinity of this low convective regions. Combining the data from all channels, we obtain the conductivity map in Figure-3.d, where the LCF artifact is eliminated. cr-MREPT using the classic method is shown in Figure-3.b in which we can see LCF artifact. In Figure-3.c, the conductivity image obtained by the padding method is shown, in which there is no LCF artifact. Figure-4 gives the profiles of the conductivity maps given in Figure-2 and red dashed lines indicate the expected values.
Using the proposed method, we get rid of the LCF artifact in the conductivity map, however the conductivity values do not match perfectly with the expected values and the sharpness of the object boundary is not recovered as well as in the padding method.
Discussion and Conclusion
While cr-MREPT suffers from LCF artifact and the padding method which removes LCF artifact requires additional acquisitions, the proposed method is advantageous in both aspects, namely elimination of LCF artifact and not requiring additional acquisition. However, padding method gives numerically closer results to the expected values than the proposed method. First reason is that TPA does not hold in individual channel data sets and the second reason is the fact that the LCF regions are not sufficiently far from each other, in contrast to the padding method.
Although the proposed method lacks accuracy to some degree, it is time-saving and artifact-free, which makes it a good choice to use especially for portraying contrast variations in conductivity.
Acknowledgements
This study was supported by TUBITAK 114E522 research grant. Experimental data were acquired using the facilities of UMRAM, Bilkent University, Ankara.References
[1] Hafalir, F., Oran, O., Gurler, N. and Ider, Y. (2014). Convection-Reaction Equation Based Magnetic Resonance Electrical Properties Tomography (cr-MREPT). IEEE Transactions on Medical Imaging, 33(3), pp.777-793.
[2] Yildiz, G., Ariturk, G. and Ider, Y. (2017). Use of Padding to Eliminate Low Convective Field Artifact in Conductivity Maps Obtained by cr-MREPT. In: 25th Annual Meeting of ISMRM. p.1949.
[3] Gurler, N., Oran, O. and Ider, Y. (2014). cr-MREPT Using Multichannel Receive Coil. In: 22nd Annual Meeting of ISMRM. p.3247.
[4] Katscher, U., Voigt, T., Findeklee, C., Vernickel, P., Nehrke, K. and Dossel, O. (2009). Determination of Electric Conductivity and Local SAR Via B1 Mapping. IEEE Transactions on Medical Imaging, 28(9), pp.1365-1374.
[5] Reykowski, A. and Blasche, M. (2004). Mode Matrix - A Generalized Signal Combiner For Parallel Imaging Arrays. In: ISMRM 12th Scientific Meeting & Exhibition. p.1587.
Figures

Figure1: a. B1+ (Transmit field) magnitude for all methods, b. B1+ phase for the classic method, c-d. B1+ phases for the paddind method, e-h. Half of the transceive phases for the proposed method. Axes are in meters.
SSFP sequence (FOV=170mm, voxel size=1.3mmx1.3mmx3mm, FA=40, TE/TR=2.23/4.46ms, average=32, duration=20seconds) is used to obtain the phase data and DA method with GRE sequences (FOV=170mm, voxel size=1.3mmx1.3mmx3mm, FA=60/120, TE/TR=5/1500ms, average=4, duration=26minutes) is used to obtain B1+ magnitude.
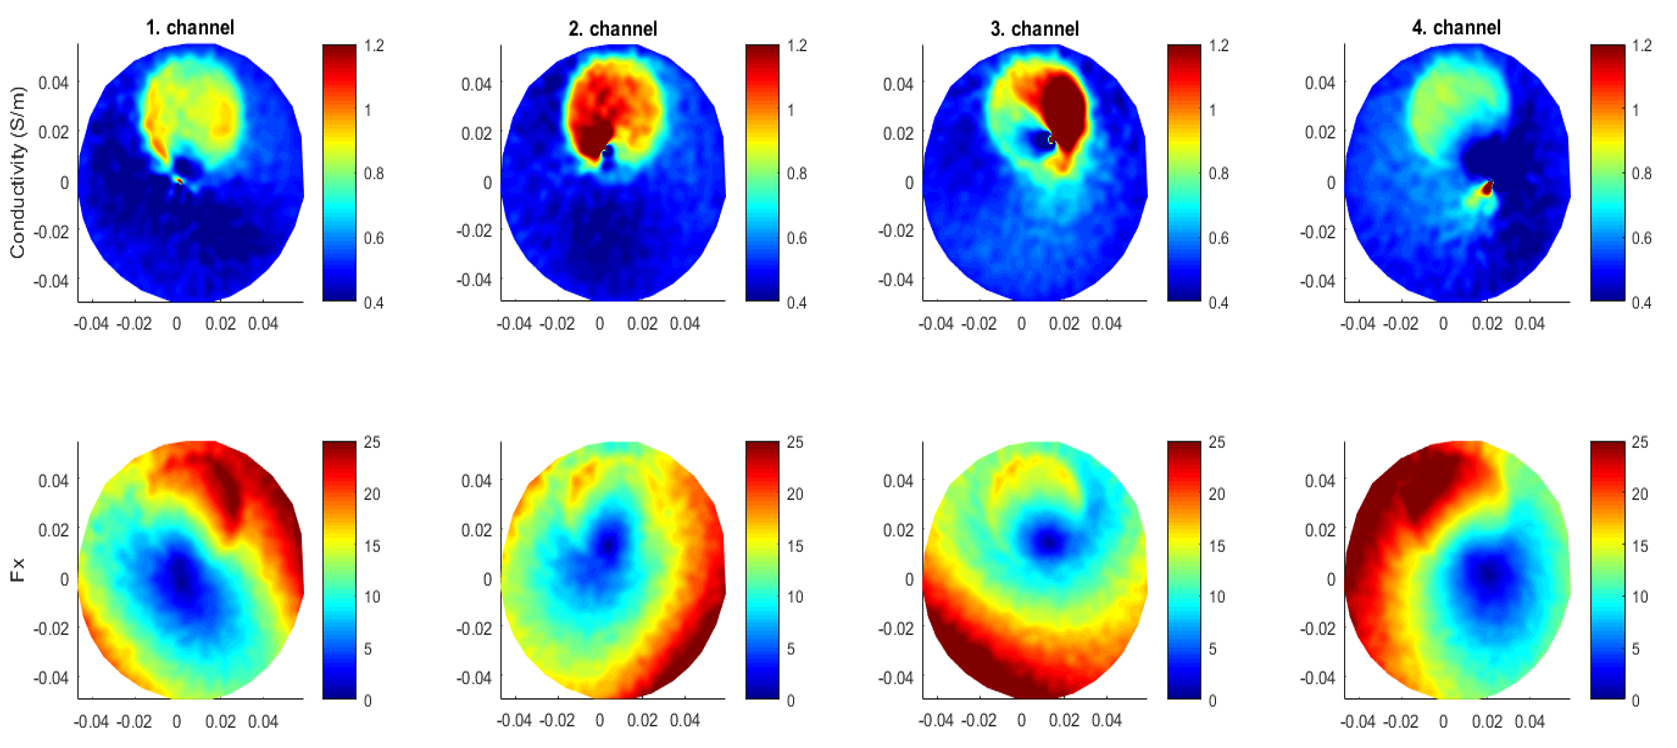
Figure2: 12-channel head coil is used in CP mode5 which combines 3 single coils and provides 4 data sets but these are called as 4-channels through the paper for ease. First row shows the conductivity reconstructions of individual channels using the proposed method. Second row shows the convective field of individual channels. Axes are in meters.
Background of the experiment phantom is prepared using an agar/saline solution (20gr/L Agar,2gr/L NaCl, 1.5gr/L CuSO4) and the higher conductive region is prepared using a saline solution (20gr/L Agar,6gr/L NaCl, 1.5gr/L CuSO4 ). Background is expected to have 0.5S/m conductivity where the anomaly region is expected to have 1S/m.