5090
Implementation of Conductivity Tensor Imaging (CTI) using MRI1Biomedical Engineering, Kyung Hee University, Seoul, Republic of Korea, 2Konkuk University, Seoul, Republic of Korea
Synopsis
Electrical conductivity is a passive material property primarily determined by concentrations of charge carriers and their mobility. The macroscopic conductivity of biological tissue at low frequency may exhibit anisotropy related with its structural directionality. When expressed as a tensor and properly quantified, the conductivity tensor can provide diagnostic information of numerous diseases. Imaging of conductivity distributions inside the human body requires probing it by externally injecting conduction currents or inducing eddy currents. Here we propose a novel method to reconstruct conductivity tensor images using an MRI scanner without any current injection.
PURPOSE
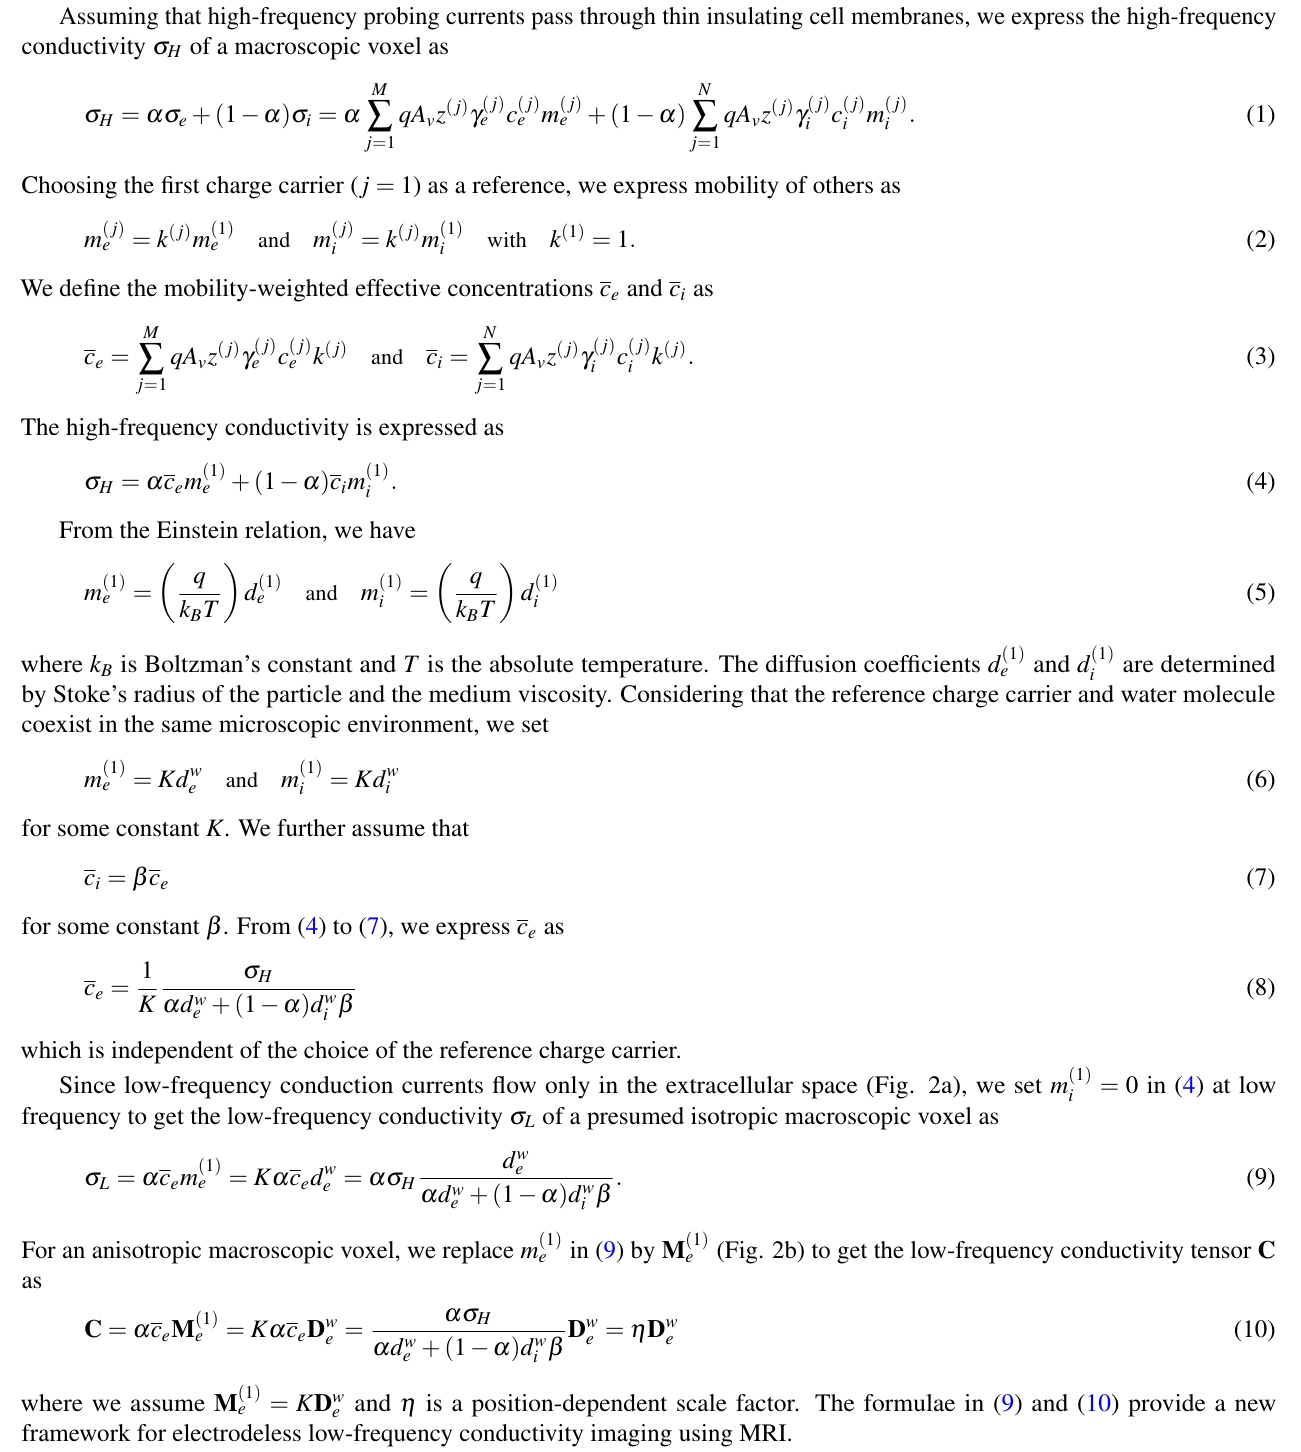
In this study, a new electrodeless low-frequency conductivity tensor imaging (CTI) method is proposed based on the following two observations. Information about the concentration of a charge carrier is embedded in the high-frequency conductivity and the concentration is independent of frequency. Mobility of a charge carrier is proportional to that of a water molecule when they exist in the same microscopic environment.METHODS
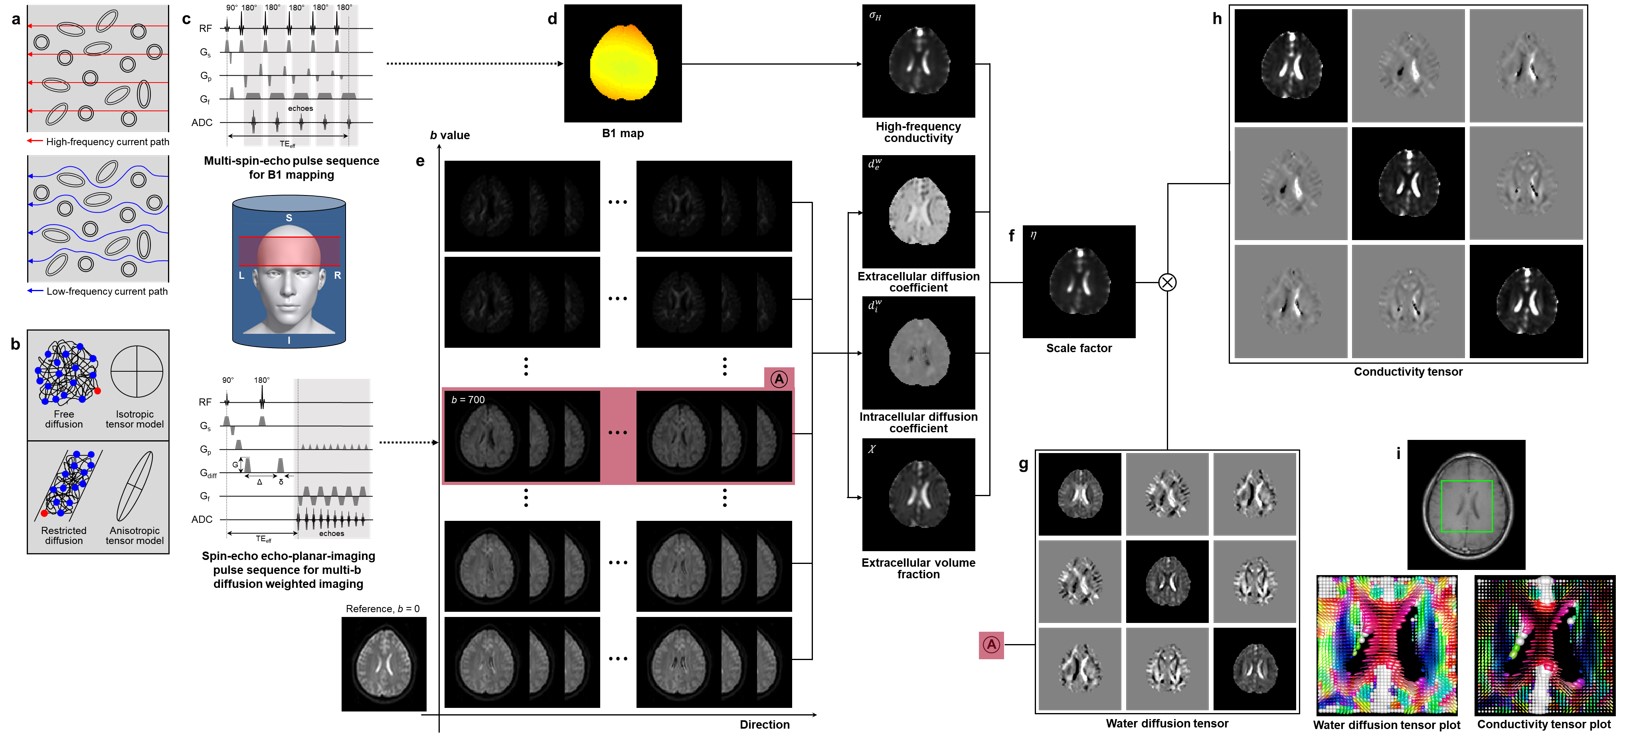
The key idea of electrodeless conductivity tensor imaging (CTI) is utilizes B1 mapping to recover a high-frequency isotropic conductivity image which is influenced by contents in both extracellular and intracellular spaces.1 Multi-b diffusion weighted imaging is then utilized to extract the effects of the extracellular space and incorporate the directional structural property.2 We defined the physical quantities of CTI in Table 1 and summarized CTI formula in figure 1.
RESULTS AND DISCUSSION
Figure 2 depicts the image reconstruction process of the proposed CTI method. Motions of charge carriers contributing to low-frequency conduction currents are restricted in the extracellular space and hindered by cells and extracellular matrix materials. This results in σL that is smaller than σH (Fig. 2a). Structural directionality of a tissue gives rise to an anisotropic conductivity that can be expressed as a tensor C (Fig. 2b).3 The electrodeless CTI method requires two separate MRI scans. One is the multi-b diffusion weighted imaging method to estimate dew, diw, χ, Dew. The other is the B1 mapping method to estimate σH (Fig. 2c). Since we did not know how to measure β, we assumed that β was constant for all pixels. We used the diffusion weighted image data with b = 700 s/mm2 to compute the estimate of Dew. From these, we reconstructed C images by computing η using equation 10.CONCLUSION
CTI can provide conductivity tensor or conductivity weighted images using a clinical MRI scanner without any added hardware. Since the image contrast is based on ensemble averages of microscopic motions of charge carriers in a structured tissue, macroscopic CTI image parameters may lead to new methods to extract quantitative information about the tissue microstructure and its functions. Future study will focus on providing not only imaging of tumor, ischemia, inflammation, cirrhosis, but also patient-specific models for source imaging and electrical stimulations.Acknowledgements
This work was supported by the National Research Foundation of Korea (NRF) grants funded by the Korea government (No. 2015R1D1A1A09058104, 2016R1A2B4014534, 2017R1A2A1A05001330)References
- Katscher U et al. Determination of electrical conductivity and local SAR via B1 mapping. IEEE Trans. Med. Imaging 2009;28:1365-1374.
- Zhang H et al. NODDI: practical in vivo neurite orientation dispersion and density imaging of the human brain. NeuroImage 2012:61;1000-1016.
- Tuch DS et al. Conductivity tensor mapping of the human brain using diffusion tensor MRI. Proc. Nat. Acad. Sci. 2001;98:11697-11701.
Figures