5089
bSSFP Phase Correction and its use in MREPT1Electrical and Electronics Engineering, Bilkent University, Ankara, Turkey
Synopsis
Balanced steady state free precision (bSSFP) has various advantages, namely high speed, high SNR, motion insensitivity and eddy current compensation. However, due to the B0 inhomogeneity, the so called "banding artifact" occurs at certain frequency regions. In this paper, phase correction method for the bSSFP sequence is proposed utilizing B0 and T2 maps. As an application, acquired B0 insensitive phase maps are used to obtain artifact-free conductivity maps.
Introduction
bSSFP sequence is a widely used MR sequence since it has high speed, high SNR, motion insensitivity and eddy current compensation due to balanced gradients.1 Although bSSFP has these invaluable advantages; however, it suffers greatly from B0 inhomogeneity and the so called "banding artifact" occurs in certain off-frequency regions. Banding artifact correction methods described in the literature aim at correcting the nulls which occur in magnitude images. However there is also severe undesired variation in the phase of the image in such regions which need to be corrected for applications using phase images.2,3 One of these applications is MREPT which uses B1+ phase as input.
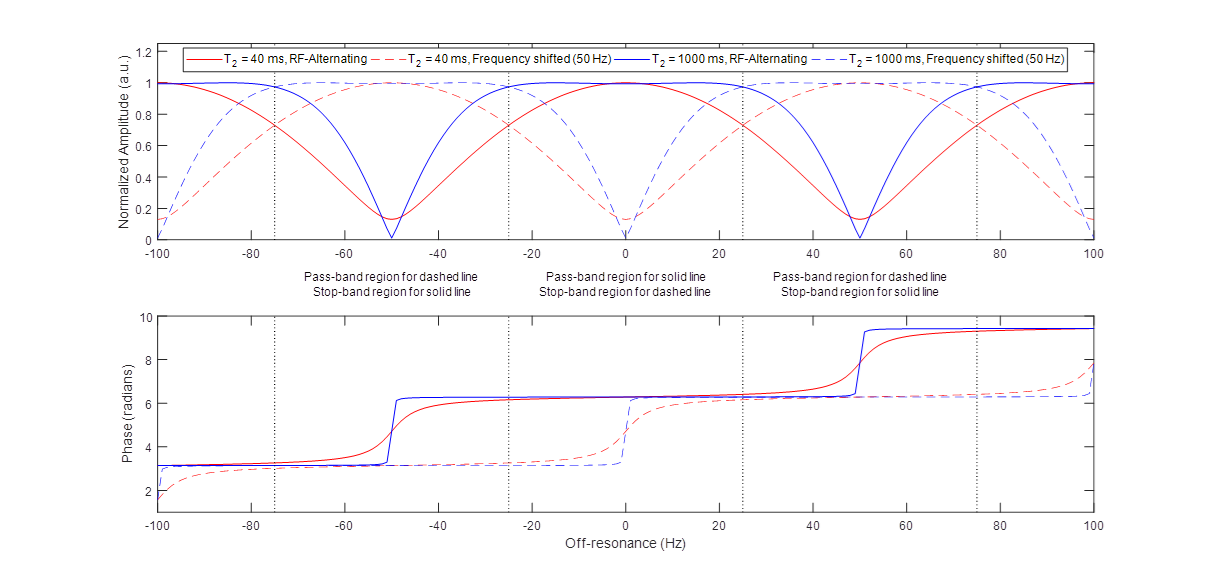
In bSSFP, using sign alternated RF pulses, steady state transverse magnetization at $$$T_E=\frac{T_R}{2}$$$, as a function of T1, T2, flip angle ($$$\alpha$$$), and phase advance in one TR due to off-resonance ($$$\phi$$$), is as follows (not considering the contribution of the RF transmit field, B1+)4:$$M_{ss,xy}=\frac{M_0sin(\alpha)(1-E_1)(1+E_2e^{-i\phi})}{(1-E_1cos(\alpha))(1+E_2cos(\phi))+(cos(\alpha)-E_1)(E_2+cos(\phi))E_2}e^{-TE/T_2}e^{i\phi/2}$$where$$E_{1,2}=e^{-T_R/T_{1,2}}\\\phi=\gamma{\Delta}B_0T_R$$Therefore, phase of the magnetization, which in fact adds up to the RF transmit phase, becomes:$$\angle(M_{ss,xy})=\angle((1+E_2e^{-i\phi})e^{i\phi/2})$$Figure 1 displays magnitude and phase of the $$$M_{ss,xy}$$$, with respect to off-resonance. In reference to Figure 1, high signal regions are called “pass-band regions” and the low signal regions are called “stop-band regions” which contain the banding artifacts. In this work, pass-band regions are taken as the region for $$$\phi\in(-90^{\circ},90^{\circ})$$$. As seen in Figure 1, there is severe phase variation in the stop-band region, whereas in the pass-band region phase does not vary much and yet its variation becomes more significant for low T2 values. We call this the "non-constant plateau" in the pass-band region. The purpose of this study is to correct bSSFP phase errors by making use of B0, T2 maps and two bSSFP runs with $$$\frac{1}{2T_R}$$$ difference in excitation frequencies.
Method
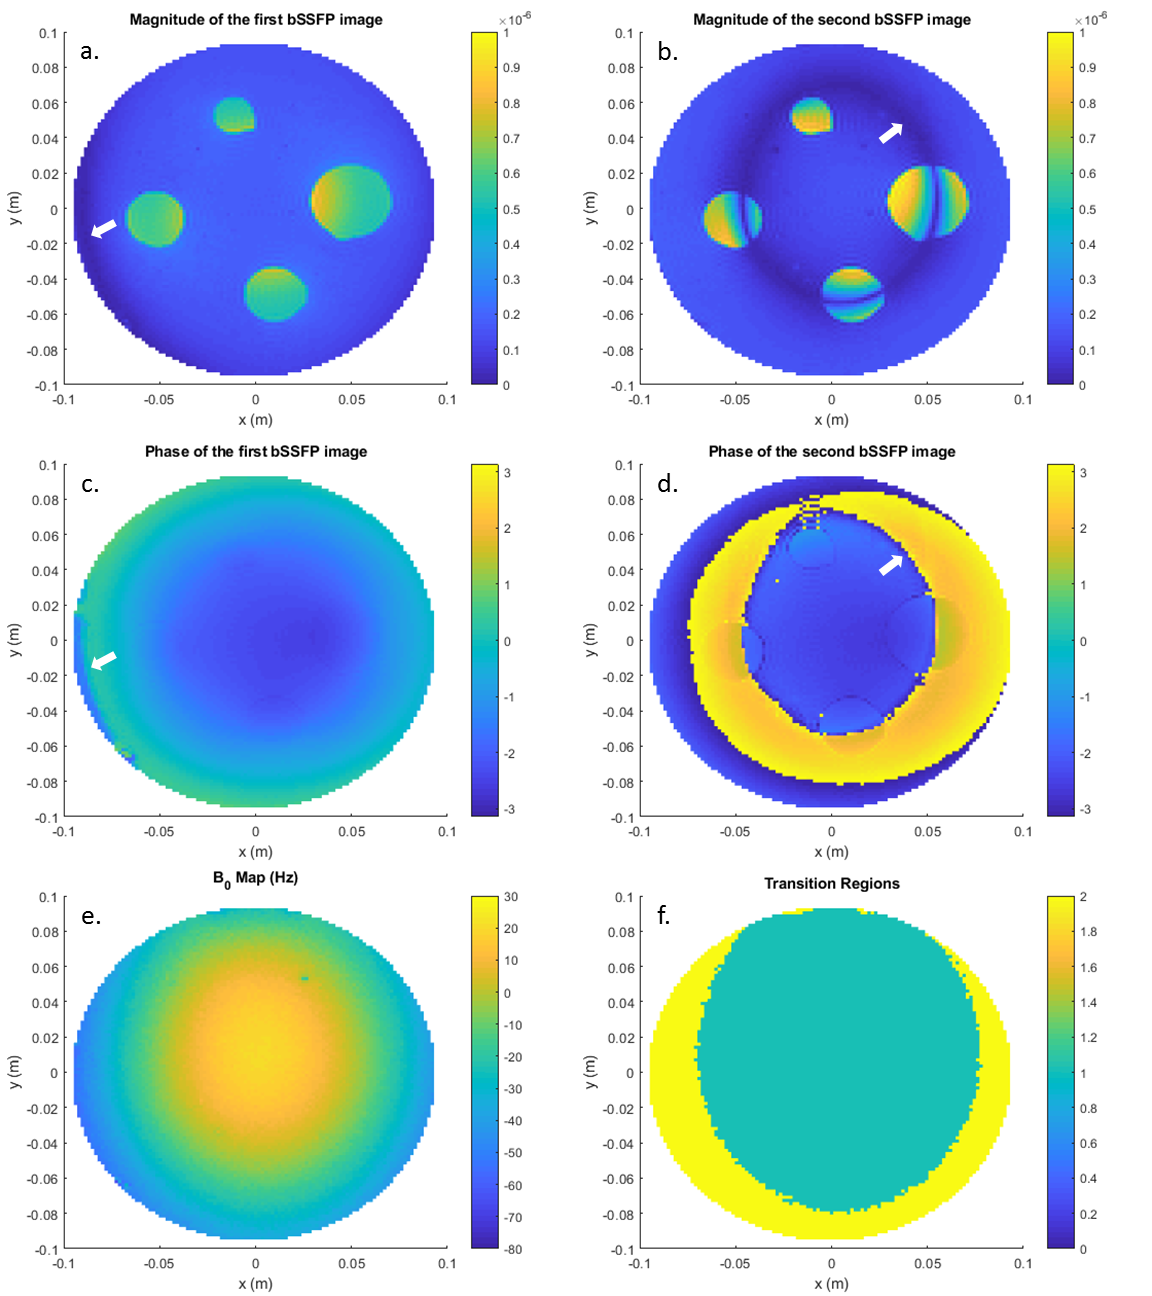
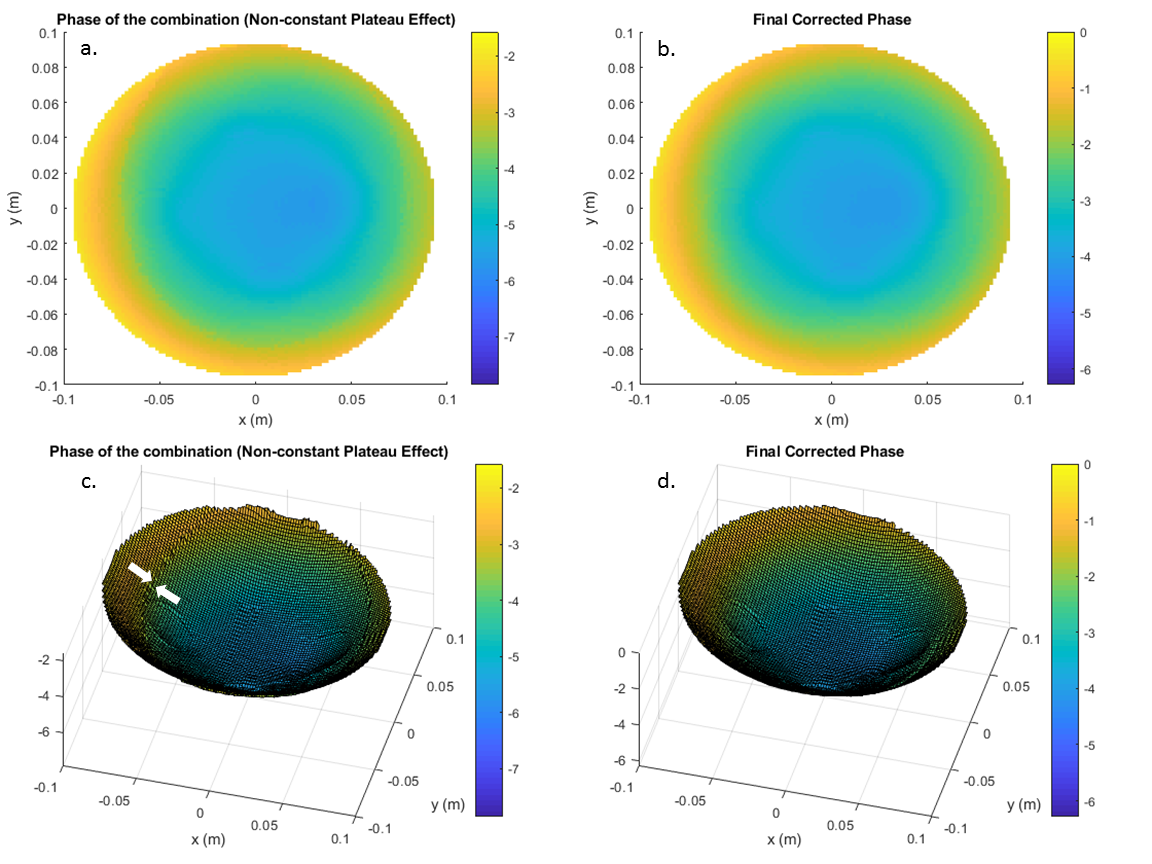
Two bSSFP images with different excitation frequencies were obtained. Since periodicity of occurrence of the stop-band region is $$$\frac{1}{T_R}$$$, difference between excitation frequencies is selected as $$$\frac{1}{2T_R}$$$. Additionally, B0 and T2 maps of the same object are obtained. Using the B0 map, pass-band and stop-band regions of each of the bSSFP images are determined. If a certain pixel lies in the stop-band region in one of the bSSFP images, then the same pixel will lie in the pass-band region in the other bSSFP image (Figure 1). For any pixel, the phase value of the bSSFP image, which contains that pixel in the pass-band region, is assigned to that pixel. By doing so, a third phase image is obtained which only contains pass-band values. However, this procedure does not yet fully compensate for the T2 and ΔB0 based phase errors. Phase error is calculated for any pixel by $$$\angle{M_{ss,xy}}$$$ as given above, for the T2 and ΔB0 values of that pixel. This value is subtracted from the aforementioned third image to obtain ΔB0 and T2 insensitive phase maps.
A cylindrical z-independent experimental phantom with diameter of 20cm and height of 25cm was constructed as follows: For background, agar-saline solution (20g/L agar, 2g/L NaCl, 0.2g/L CuSO4) was used, and for anomalies, saline solution (6g/L NaCl, 0.2g/L CuSO4) was prepared. Anomaly regions have diameters as 0.5, 1.5 and 2.5cm. Experiments were conducted on 3T Siemens Tim Trio MR scanner using a quadrature body coil. Generalized phase-based MREPT is used to obtain conductivity mapping5.
Results
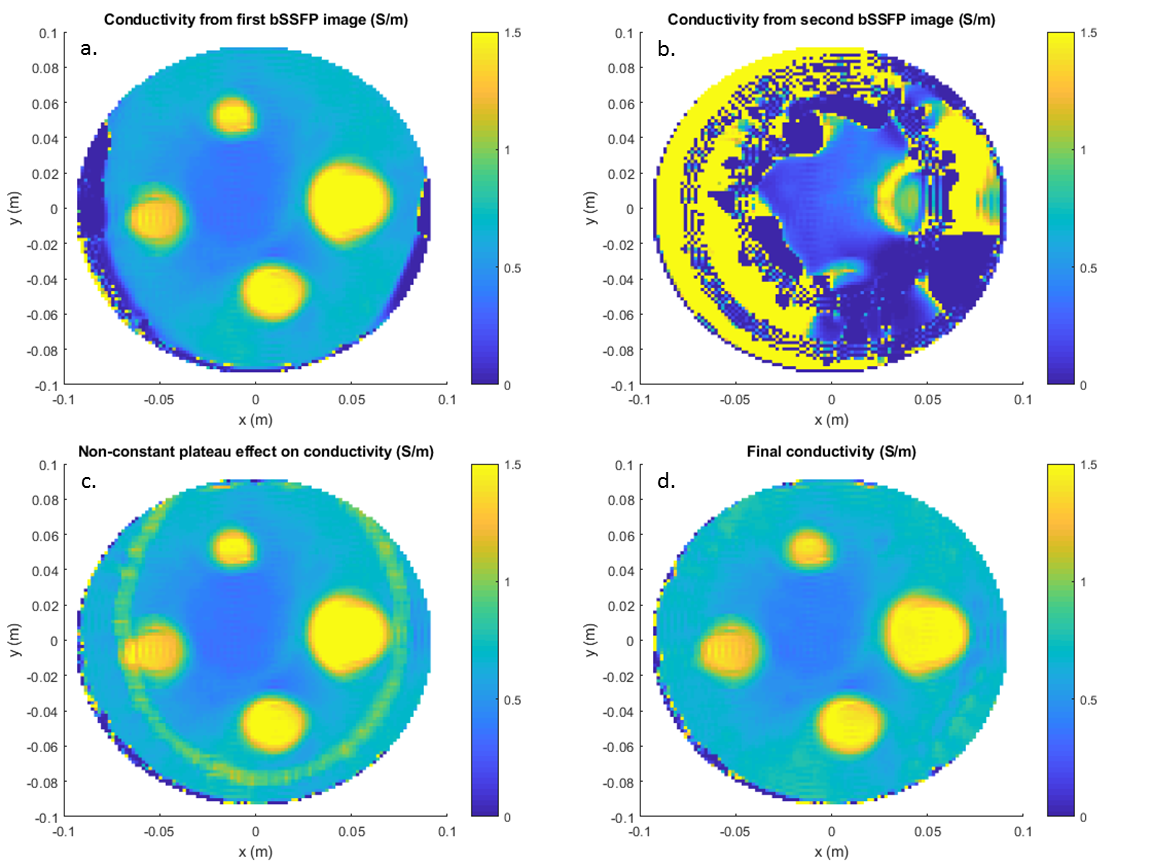
In Figure 2, bSSFP images, B0 map and selection of pixels are shown. Both bSSFP images suffered from banding artifact. Note that, when ΔB0 increases, tissue boundaries become clear due to the T2 dependence of the phase (Figure 2d with comparison to Figure 2c). Combined phase of pass-band regions and final corrected phase are shown in Figure 3. Small phase jump is observed at the boundary of the pass-band regions (Figure 3c). By subtracting the calculated phase from the combined phase, phase jumps are eliminated and seamless transmit phase can be obtained (Figure 3d). Finally, conductivity maps are obtained for the phantom experiment shown in Figure 4. Banding artifact disturbs the conductivity images greatly (Figure 4a-b) and boundary of the pass-band regions is clearly visible in conductivity image (Figure 4c). Final conductivity map is free from such artifacts (Figure 4d).
Discussion and Conclusion
While keeping most of the advantages (motion insensitivity, eddy current compensation and high SNR), we can obtain phase map, which is free from B0 and T2 distortion. Obtained phase map can be used in many phase-based MRI applications such as conductivity imaging as shown in this work.
Total measurement time could be an issue for this method. However, by implementing multi-spin-echo sequence followed by stimulated echo compensation6, scanning time to obtain T2 map can be reduced significantly.
Acknowledgements
This study was supported by TUBITAK 114E522 research grant. Experimental data were acquired using the facilities of UMRAM, Bilkent University, Ankara.References
1. U. Katscher, D. Kim and J. Seo, "Recent Progress and Future Challenges in MR Electric Properties Tomography", Computational and Mathematical Methods in Medicine, vol. 2013, pp. 1-11, 2013.
2. N. Gurler and Y. Ider, "Gradient-based electrical conductivity imaging using MR phase", Magnetic Resonance in Medicine, vol. 77, no. 1, pp. 137-150, 2016.
3. O. Bieri, S. Maderwald, M. Ladd and K. Scheffler, "Balanced alternating steady-state elastography", Magnetic Resonance in Medicine, vol. 55, no. 2, pp. 233-241, 2006.
4. C. Ganter, "Static susceptibility effects in balanced SSFP sequences", Magnetic Resonance in Medicine, vol. 56, no. 3, pp. 687-691, 2006.
5. N. Gurler and Y. Ider, "Generalized Phase based Electrical Conductivity Imaging". In Proceedings of the 24th Annual Meeting of ISMRM, Singapore, Singapore, 2016.
6. N. Ben-Eliezer, D. Sodickson and K. Block, "Rapid and accurate T2 mapping from multi-spin-echo data using Bloch-simulation-based reconstruction", Magnetic Resonance in Medicine, vol. 73, no. 2, pp. 809-817, 2014.
Figures