5088
Evaluating Validity of MREPT Assumptions for 21.1 T1Physics, Florida State University, Tallahassee, FL, United States, 2Center for Interdisciplinary MR, National High Magnetic Field Laboratory, Tallahassee, FL, United States, 3Chemical & Biomedical Engineering, Florida State University, Tallahassee, FL, United States
Synopsis
This study examines conductivity mapping using MR Electrical Properties Tomography (MREPT) at ultra-high field (21.1 T). The accuracy of reconstructing conductivity using the complex B1+ field (Full-form) versus only the B1+ phase (Phase-based) is evaluated. Phantoms containing different NaCl concentrations were tested to compare these reconstructions with actual conductivities measured by dielectric probe at 900 MHz. Also, these methods were evaluated for experiments acquired with volume and surface coil configurations operated in either linear or quadrature transceiver. Conductivity maps of Full-form versus Phase-based MREPT from in vivo MCAO rats were acquired, with both providing similar variations across the ischemic brain.
Introduction
MREPT can be used to map electrical properties of body tissues using conventional MRI equipment [1]. Based on the impact of electrical properties of a sample on RF propagation, MREPT relates changes in phase and magnitude of the B1+ field (Full-form) to estimate electrical properties by judicious application of Helmholtz’s equations: $$\sigma=\frac{\nabla^2 \phi_1^+}{\omega \mu_0}+\frac{(2\,∇|B_1^+ |\,.∇\phi_1^+)}{\omega \mu_0} \qquad\left(1\right)$$ where $$$\mu_0$$$ is free space magnetic permeability, $$$\omega$$$ is the angular frequency (rad/s) and $$$ \phi_1^+$$$ (transmit phase) will be substituted by half of the transceive phase $$$ (\phi_t) $$$ using the conventional transceive phase assumption. In the Phase-based approximation, only the Laplacian of image phase is used under the assumption that the variation in the magnitude is negligible [2]: $$ \sigma\approx\frac{\nabla^2 \phi^+}{\omega \mu_0}\qquad\left(2\right)$$ Although MREPT benefits from higher fields by means of increased signal-to-noise ratio (SNR), these underlying assumptions, namely the transceive phase and phase-only, may no longer hold [3]. This work examines these assumptions for linear and quadrature operation of volume and surface coils at the ultra-high field of 21.1 T for application to ischemic stroke.Materials and Methods
A phantom was made with four different sodium (NaCl) concentrations and 1.5 g/L CuSO4: 0 g/L, 4.7 g/L, 11.7 g/L and 25.6 g/L called tube 1 to 4, respectively. The actual conductivity measured with an HP dielectric probe were 0.2, 1.01, 2.04 and 4.08 S/m, respectively. Data were acquired at the National High Magnetic Field Laboratory using a 21.1-T vertical magnet. Both built on a 33-mm diameter former, double-tuned 1H/23Na birdcage RF and 1H saddle coils operating at 900 MHz were used. For the phantom study, 2D spin echo (SE) sequences were acquired with a TE/TR=15/2000 ms, resolution of 133x133x1000 mm3 and 9 slices. For in vivo study, four 150-g Sprague-Dawley rats were imaged following ischemia induced by transient middle cerebral artery occlusion (MCAO) for 1 h. MCAO rats were imaged 24 h following occlusion. In vivo axial images were acquired with fast SE (FSE) sequences with TE/TR=13/2500 ms, RARE factor=4, resolution of (117x117x500) mm3 and 9 slices. For both phantom and in vivo scans, B1+ phase was measured from the SE image phase with a 90° flip while the magnitude B1+ map was constructed using Double Angle Method [4]. MATLAB scripts were implemented for conductivity reconstruction from time domain data. Phase unwrapping (Goldstein’s method [5]) and smoothing were included in post-processing of the phase while the sizes of noise robust Laplacian kernels implemented to solve Eqs. 1 and 2 were optimized based on the image matrix. A moving average filter was applied to all conductivity maps. Mean conductivity and standard deviation were calculated from regions of interest (ROI) for both phantom and in vivo data.Results and Discussion
Figure 1 shows 1H SE magnitude, 23Na and conductivity maps from Phase-based and Full-form reconstructions of the phantom. Figure 2 demonstrates means and SD for ROI inside each tube as impacted by the different reconstructions and coil types. The percent difference between Phase-based and Full-form were 72%, 27%, 47% and 10%, respectively for tube 1 to 4 from the linear birdcage coil and -7% and -13% for tube 2 and 3 from quadrature saddle coil. Overall, it was found that the Full-form solution is superior with 9% average error from the target for the linear birdcage coil compared to the Phase-based solution with 65% average error. On the other hand, the quadrature coil, which provides higher SNR but a decreasing B1 field from the surface of the saddle, yielded a reduced error for the Phase-based (40%) compared to the Full-form solution (55%). Figure 3 shows the 1H FSE magnitude, 23Na and conductivity maps for an MCAO rat. Conductivity maps of the MCAO brain reconstructed with Full-Form and Phase-based approximation were similar and both visibly show higher conductivity in stroke, in correlation with the higher sodium concentration in the 23Na image (Fig. 3e).Conclusions and future work
Measured conductivity values for the phantom are in close agreement from both reconstructions with those from the dielectric probe. Phase-based error becomes smaller for σ >1 S/m. Although B1 homogeneity decreases at higher frequencies due wave interferences (λ=36 mm in pure water at 900 MHz), reducing the sample size to less than 33 mm minimizes these inhomogeneities. For the coils and operational modes studied, the more regular B1 field of the volume coil with the full-form solution is preferable for accurate reconstruction of conductivity at 900 MHz. For in vivo study, the lack of piecewise constant conductivity at tissue interferences has led to negative values but a measurable difference between ischemic and contralateral regions.Acknowledgements
This work was supported by the National Science Foundation (DMR-1157490) and the National High Magnetic Field Laboratory through the User Collaboration Grants Program as well as the NIH (R01-NS102395).References
[1] Katscher U. and van den Berg CAT., “Electric properties tomography: Biochemical, physical and technical background, evaluation and clinical applications,” NMR Biomed., no. March, pp. 1–15, 2017.
[2] Van Lier ALHMW., Brunner DO. , Pruessmann KP, Klomp DWJ., Luijten PR, Lagendijk JJW., and Van Den Berg CAT., “B 1+ phase mapping at 7 T and its application for in vivo electrical conductivity mapping,” Magn. Reson. Med., vol. 67, no. 2, pp. 552–561, 2012.
[3] Van Lier ALHMW. , Raaijmakers A., Voigt T., Lagendijk JJW. , Luijten PR., Katscher U., and Van Den Berg CAT., “Electrical properties tomography in the human brain at 1.5, 3, and 7T: A comparison study,” Magn. Reson. Med., vol. 71, no. 1, pp. 354–363, 2014.
[4] Cunningham CH., PaulyJM., and Nayak KS, “Saturated double-angle method for rapid B1+ mapping,” Magn. Reson. Med., vol. 55, no. 6, pp. 1326–1333, 2006.
[5] Goldstein RM., Zebker RA., and Werner CL., “Satellite radar interferometry: Two-dimensional phase unwrapping,” Radio Sci., vol. 23, no. 4, pp. 713–720, Jul. 1988.
Figures
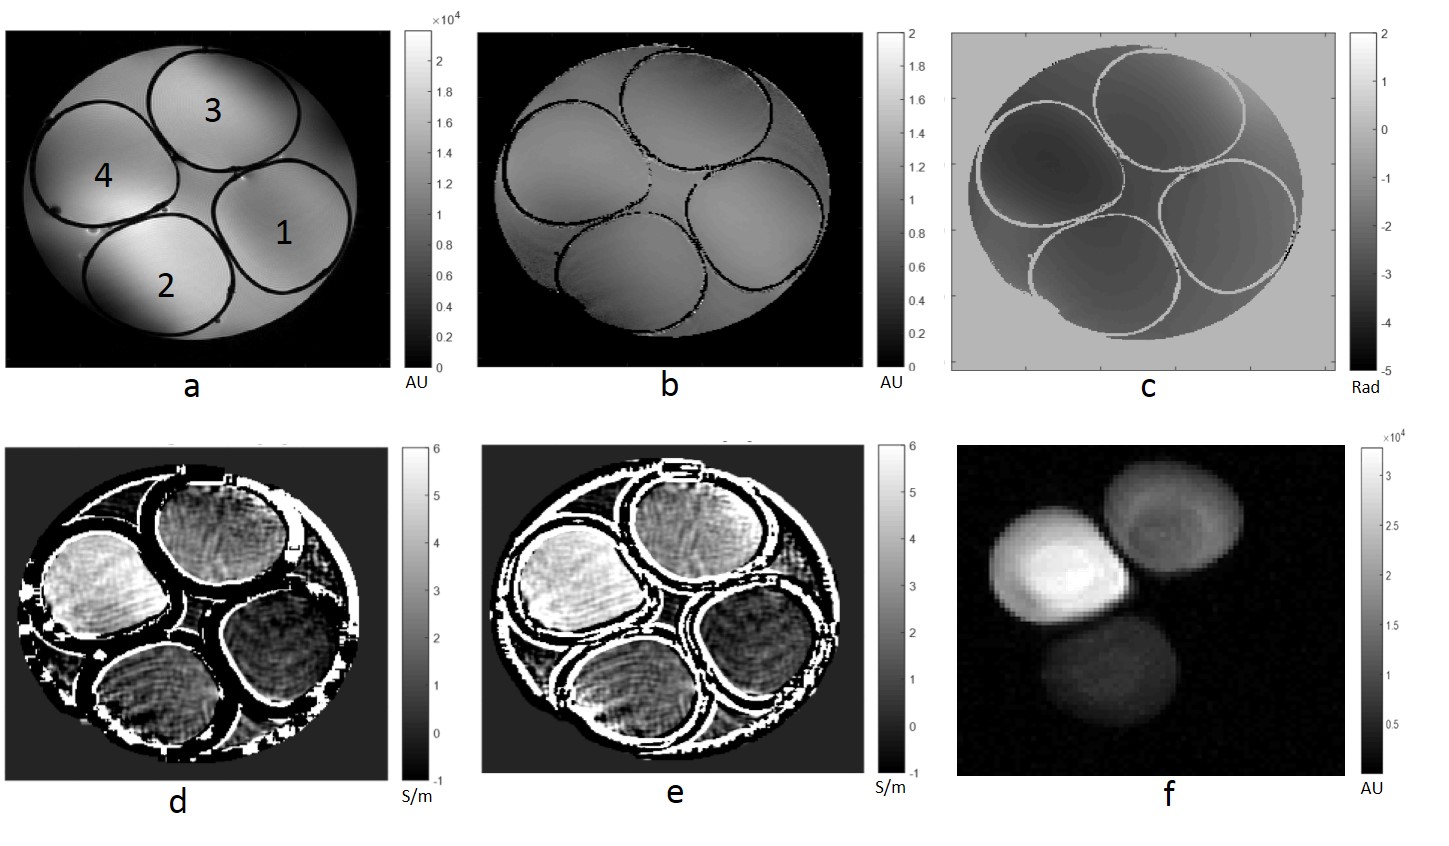
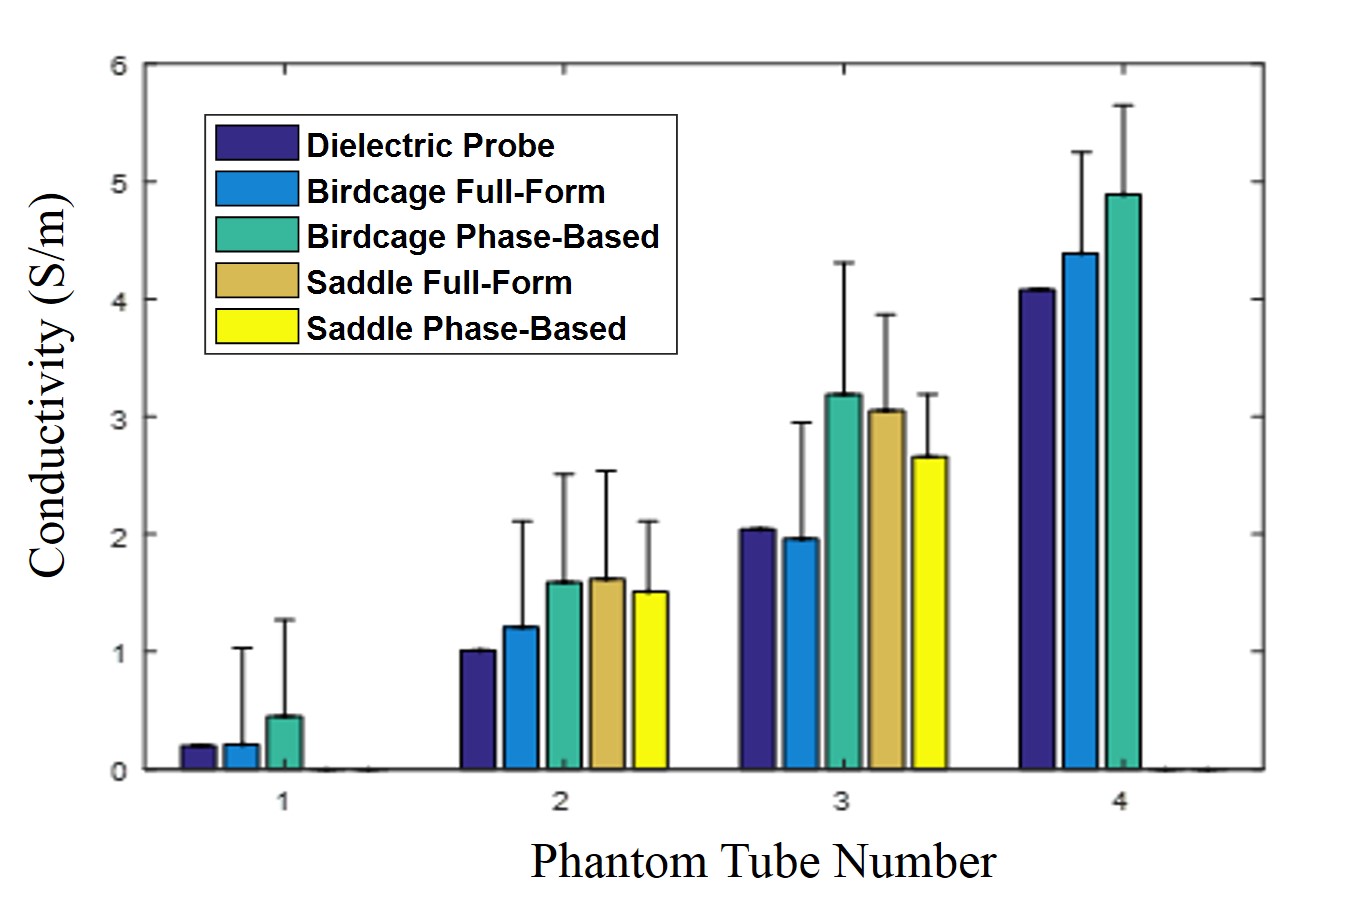
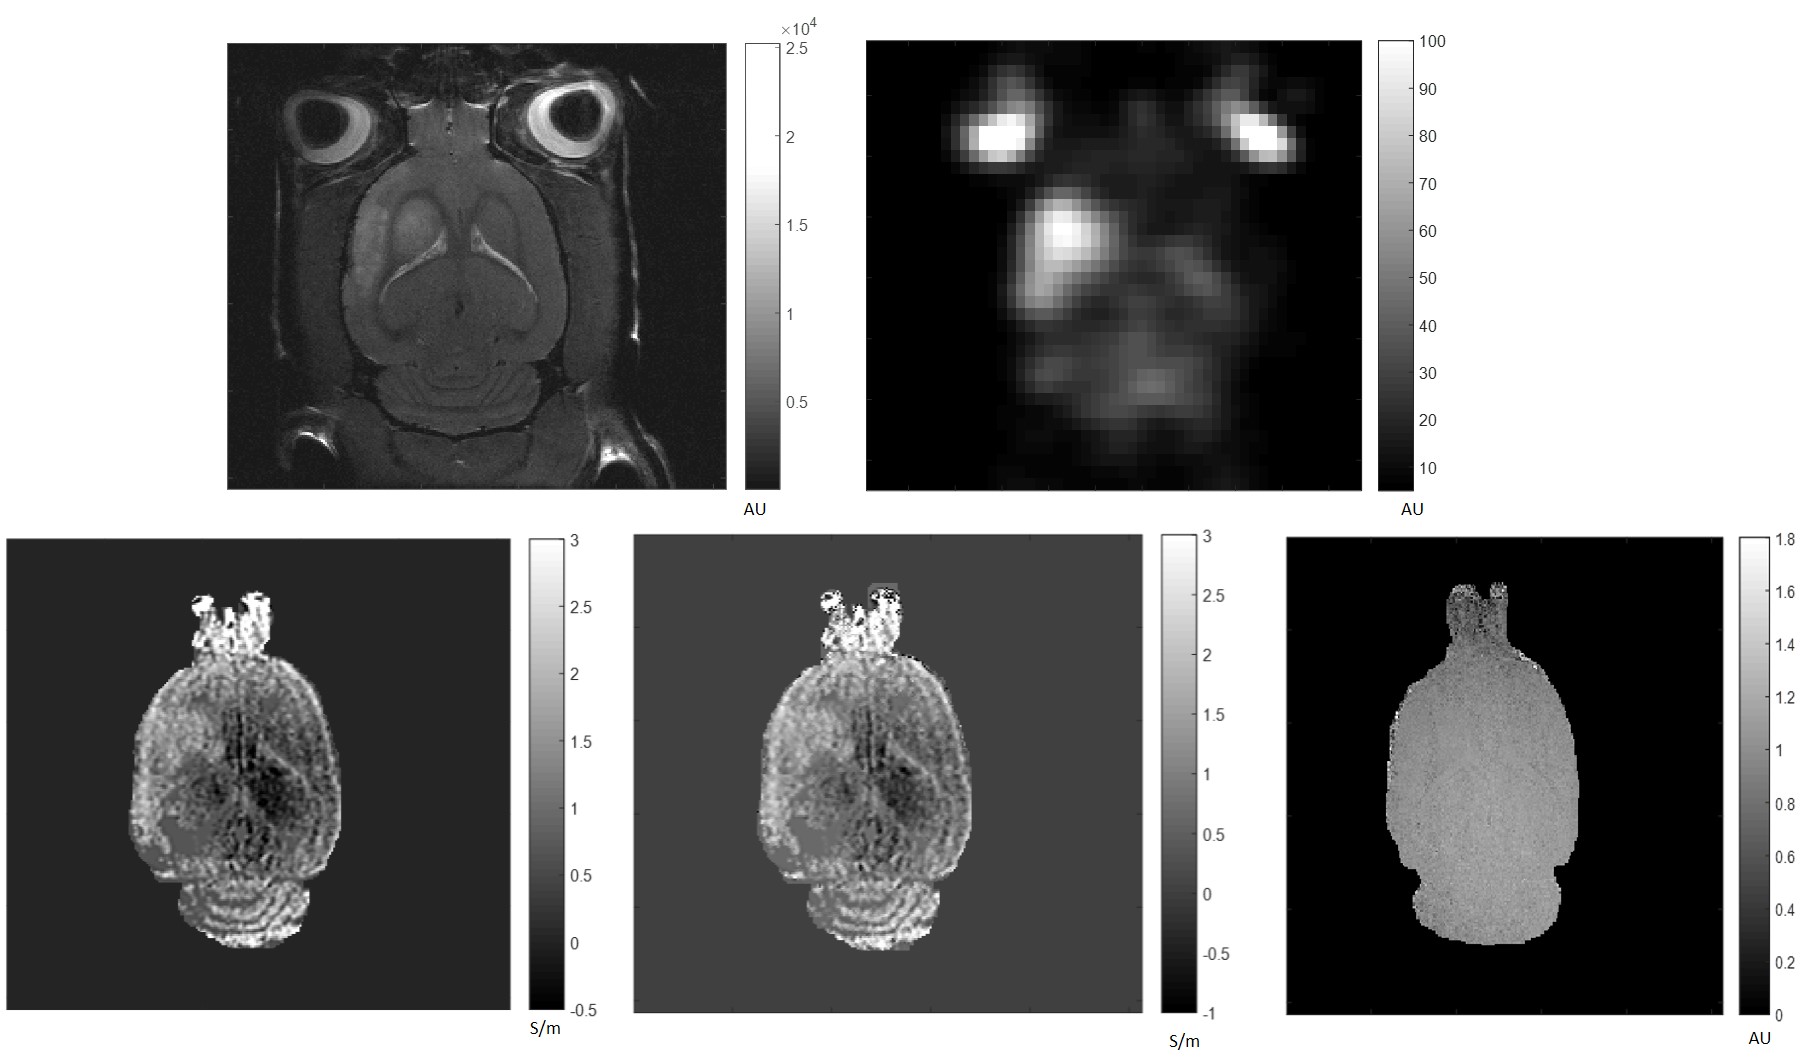
Fig 3. MCAO rat: Top left) 1H Magnitude image; top right) 23Na MRI; bottom left) Phase-based conductivity, σ stroke =1.5 S/m and σ contra=0.65 S/m; bottom center) Full-form conductivity; and bottom right) B1+ magnitude map.