5085
Noninvasive Assessment of Electrical Conductivity Characteristics of Normal and Diseased Liver Using Electric Properties TomographyKhin Khin Tha1,2, Ulrich Katscher3, Kinya Ishizaka4, Kohsuke Kudo1,2, and Hiroki Shirato2
1Department of Diagnostic and Interventional Radiology, Hokkaido University Hospital, Sapporo, Japan, 2Global Station for Quantum Medical Science and Engineering, Hokkaido University, Sapporo, Japan, 3Philips Research Laboratories, Hamburg, Germany, 4Department of Radiological Technology, Hokkaido University Hospital, Sapporo, Japan
Synopsis
The feasibility of Electric Properties Tomography (EPT) in distinguishing between the normal and diseased liver tissues was evaluated. A 2D steady state free precession sequence was used to acquire the RF transceive phase needed for a simplified version of EPT; and a total of 10 dynamic sagittal scans of the liver were obtained under single breath-hold, in 10 healthy volunteers and 11 patients with hepatic lesions. Despite the need of technical improvements, noninvasive electrical conductivity assessment of the liver by EPT was possible. Its potential utility in identifying hepatocellular carcinomas with intratumoral necrosis and/ or high vascularity was also shown.
Introduction
Recent development of electric properties tomography (EPT) has allowed noninvasive assessment of electrical conductivity (σ) of living tissues1. Its validity has been tested on phantoms2 and glioma specimens3, and its clinical utility has been proposed in glioma3, breast cancer4, and cervical carcinoma5. Utility of EPT in tissues largely affected by physiological motion such as respiration has not been reported, and the σ characteristics of these tissues are not known. In this preliminary study, we evaluated the feasibility of EPT in distinguishing between the normal and diseased liver tissues.Methods
This preliminary study included 10 healthy volunteers (6 men; average age = 38.3 ± 10.6 years) and 11 patients with hepatic lesions (9 hepatocellular carcinomas, 1 intrahepatic cholangiocarcinoma, 1 metastasis, and 2 cysts). MRI was performed using a 1.5T scanner (Achieva, Philips Medical Systems) and a standard 8-channel body coil. A 2D steady state free precession (SSFP) sequence was used to acquire the RF transceive phase needed for EPT, and a total of 10 dynamic scans were obtained under single breath-hold (TR/TE = 16/4 ms, flip angle = 30°, NEX = 2, plane = sagittal, the number of slices = 1, acquisition time = 8 s). Axial T1WI and T2WI were also acquired in all volunteers, and dynamic contrast-enhanced T1WI and T2WI were also acquired in all patients. In each participant, the liver was manually segmented, and the phase was averaged across the dynamic scans. The σ was then calculated voxel-by-voxel from the averaged phase, based on the formula σ = Δφ/(2µω2), where ω = Larmor frequency, Δ = Laplacian operator (second spatial derivative in 3D), φ = RF transceive phase, and μ = magnetic permeability of the body (assumed to be constant)3. Standard EPT requires 3D images, which however are too long for a single breath-hold. Thus, 2D images were acquired instead, and the derivatives of the Laplacian operator were reduced to the two in-plane directions, yielding semiquantitative σ results. The validity of this method has been tested with phantom models. The reconstructed σ maps of normal volunteers were reviewed for σ distribution across the liver parenchyma. Those of the patients were reviewed for any difference in σ between the hepatic lesions and the surrounding liver parenchyma.Results and Discussion
The σ maps of 14 participants (4 healthy volunteers and 10 patients) were scarce of motion artifacts, and were used for review. The mean σ value of the normal liver parenchyma was 460 ± 188 mS/m -- which is in line with the literature value measurable by dielectric probe6. About fifty percent of the σ maps of healthy volunteers had inhomogeneous σ distribution in the liver parenchyma, especially around the organ edges -- possibly due to imperfect compensation of coil sensitivity profile (Fig 1). Hepatocellular carcinoma had variable σ values, ranging between 338 and 1250 mS/m (Figs 2 and 3). Those tumors with intratumoral necrosis and/ or high vascularity tended to have higher σ values. The σ value of hepatic cysts was approximately 1250 mS/m (Fig 3), and was almost identical to that of bile within the gall bladder. That of hepatic metastasis was about 564 mS/m, and was not easily distinguishable from the surrounding liver parenchyma. The σ values of the surrounding liver parenchyma of the patients were similar to/ higher than those of the healthy volunteers (range = 348 – 858 mS/m). Factors underlying high σ of the surrounding liver parenchyma in the patients are not known, but local tissue changes such as fibrosis or tumor invasion as well as aforementioned edge artifacts may be responsible.Conclusions
Despite the need of technical improvements, noninvasive σ assessment of the liver by EPT is possible, and has potential utility in identifying hepatocellular carcinomas with intratumoral necrosis and/ or high vascularity.Acknowledgements
This study was funded by (i) the Japan Society for the Promotion of Science and (ii) Global Institution for Collaborative Research and Education, Hokkaido University.References
- Katscher U, van den Berg CAT (2017) Electric properties tomography: Biochemical, physical and technical background, evaluation and clinical applications. NMR Biomed 30. doi: 10.1002/nbm.3729
- Katscher U, Voigt T, Findeklee C, Vernickel P, Nehrke K, Dössel O (2009) Determination of electric conductivity and local SAR via B1 mapping. IEEE Trans Med Imaging 28:1365–1374
- Tha KK, Katscher U, Yamaguchi S, et al (2017) Noninvasive electrical conductivity measurement by MRI: a test of its validity and the electrical conductivity characteristics of glioma. Eur Radiol doi: 10.1007/s00330-017-4942-5
- Kim SY, Shin J, Kim DH et al (2016) Correlation between conductivity and prognostic factors in invasive breast cancer using magnetic resonance electric properties tomography (MREPT). Eur Radiol 26:2317–2326
- Balidemaj E, de Boer P, van Lier AL et al (2016) In vivo electric conductivity of cervical cancer patients based on B1 + maps at 3T MRI. Phys Med Biol 61:1596–1607
- Haemmerich D1, Staelin ST, Tsai JZ, Tungjitkusolmun S, Mahvi DM, Webster JG (2003) In vivo electrical conductivity of hepatic tumours. Physiol Meas 24:251-260
Figures
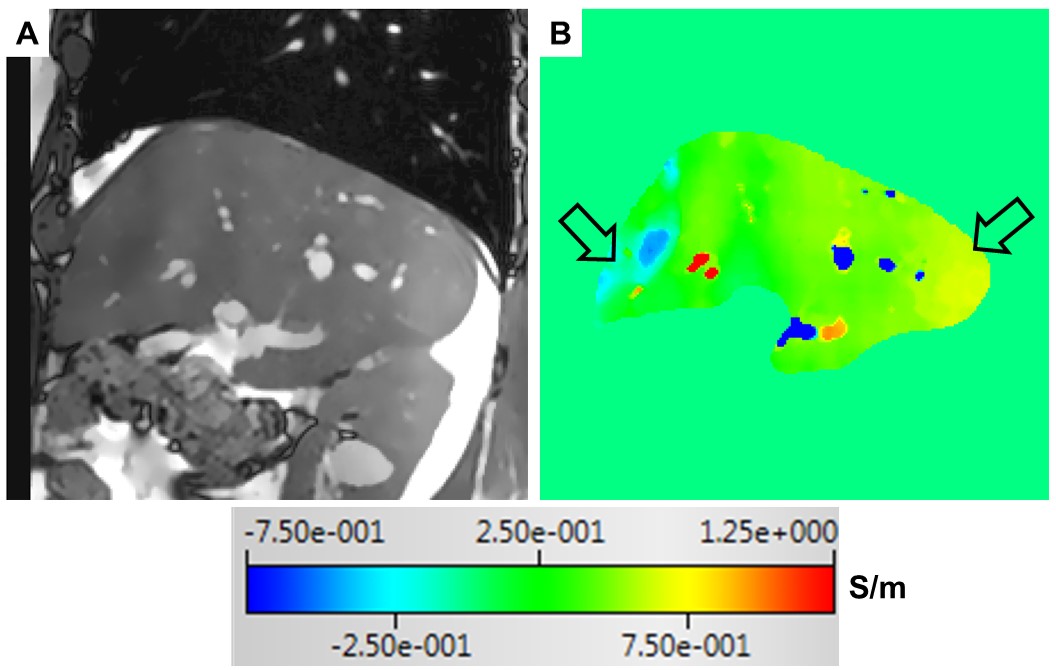
Fig 1. A magnitude
image of the 2D-SSFP sequence (A) and the corresponding σ map (B) of a healthy volunteer (a 53-year old
man). The arrows indicate areas with inhomogeneous σ distribution.
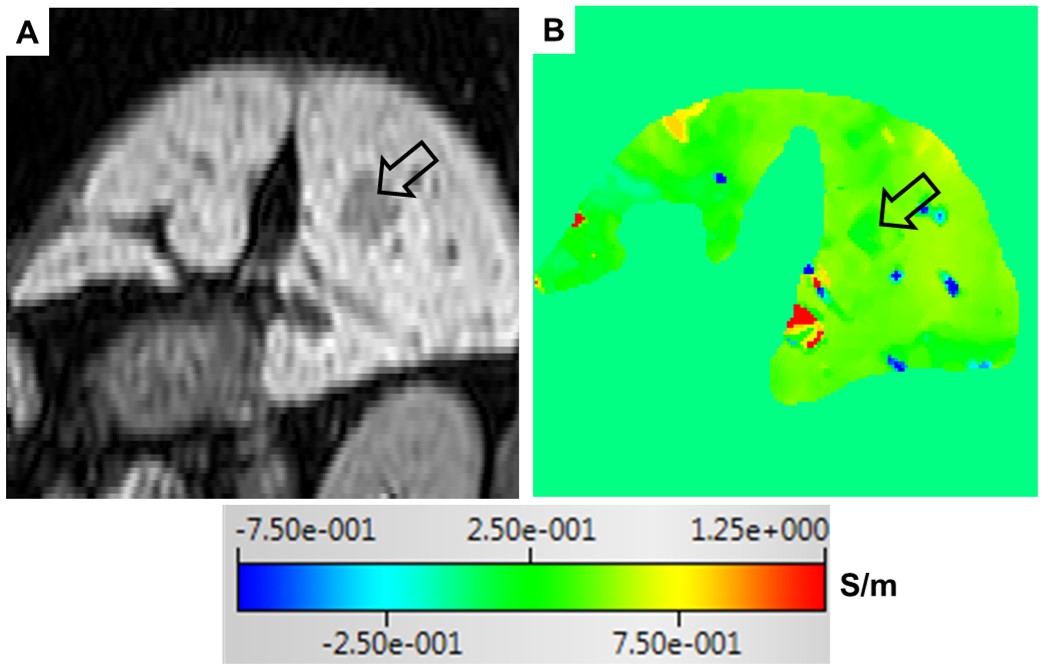
Fig 2. A reconstructed dynamic contrast-enhanced T1-weighted image in arterial phase (A) and the corresponding σ map (B) of a 55-year old man with
hepatocellular carcinoma (open black arrow). The σ value of the tumor is almost identical to that of the surrounding liver parenchyma.
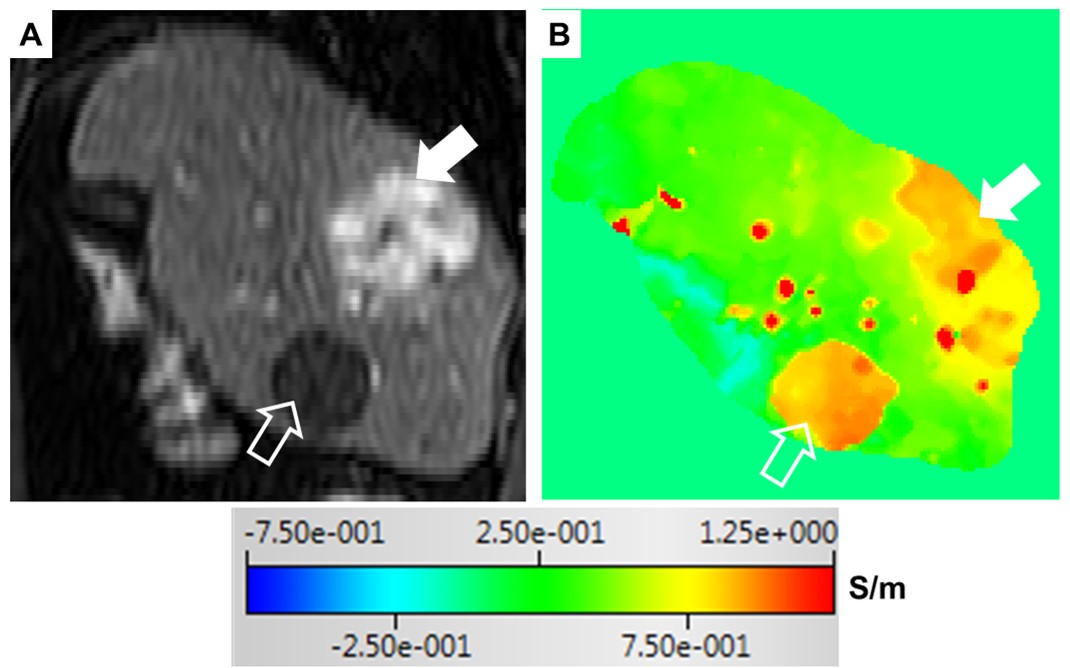
Fig 3. A reconstructed dynamic contrast-enhanced T1-weighted image in arterial phase (A) and the corresponding σ map (B) of a 62-year old man with a hypervascular hepatocellular carcinoma (solid white arrow) and a cyst (open white arrow). The σ values of the tumor and the cyst are higher than that of the surrounding liver parenchyma.