5079
Anisotropy of water T2* in murine skeletal muscle at rest1NMR Laboratory, Institute of Myology, Paris, France, 2NMR laboratory, CEA/DRF/IBFJ/MIRCen, Paris, France
Synopsis
Modelling ultra-short TE (UTE) signal decay allows the extraction of multiple T2* components, an interesting approach to evaluate collagen-rich tissues with short T2 values. UTE can be promising to assess skeletal muscle fibrosis, whose non-invasive evaluation is still challenging. There are, though, indications that muscle T2* during ischemia can change when altering muscle orientation in the static magnetic field. Here we showed that muscle T2* at rest is indeed sensitive to muscle positioning in B0, with variable orientation-dependent changes in different muscles. We hypothesize that muscle structure might lead to orientation-dependent local susceptibility-induced B0 gradients, resulting in anisotropy of water-T2*.
Introduction
The ultrashort TE (UTE) sequence is an interesting approach to study collagen-rich tissues, which present in general very short T2 values. UTE allows to characterize short-T2* components and to image tissues such as bone and tendon1–3. In the field of neuromuscular disorders, UTE could be informative in the assessment of diffuse muscle fibrosis, whose evaluation by non-invasive tools remains still very challenging3. Nevertheless, T2* dependence on muscle orientation relative to B0 has been previously observed, with the description of changes in BOLD contrast during ischemia when altering muscle positioning in the static magnetic field4. In this context, we decided to evaluate how muscle orientation relative to B0 would affect UTE signal decay at rest.Materials and Methods
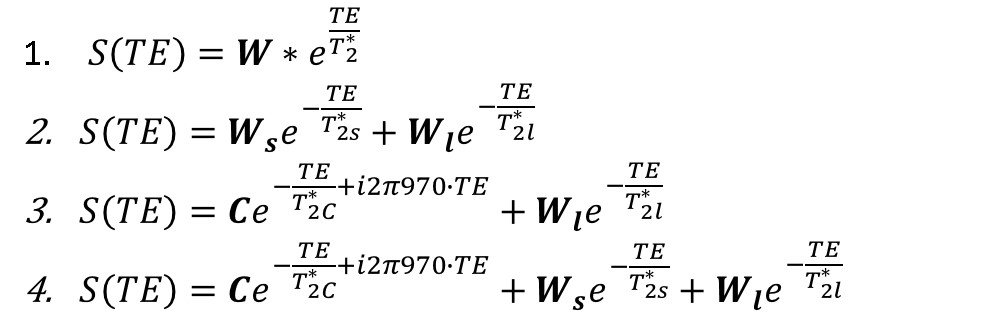
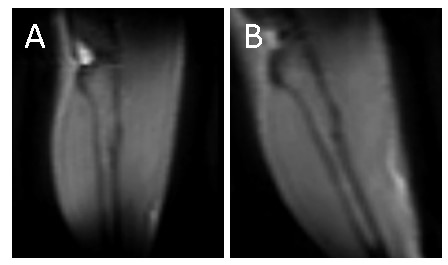
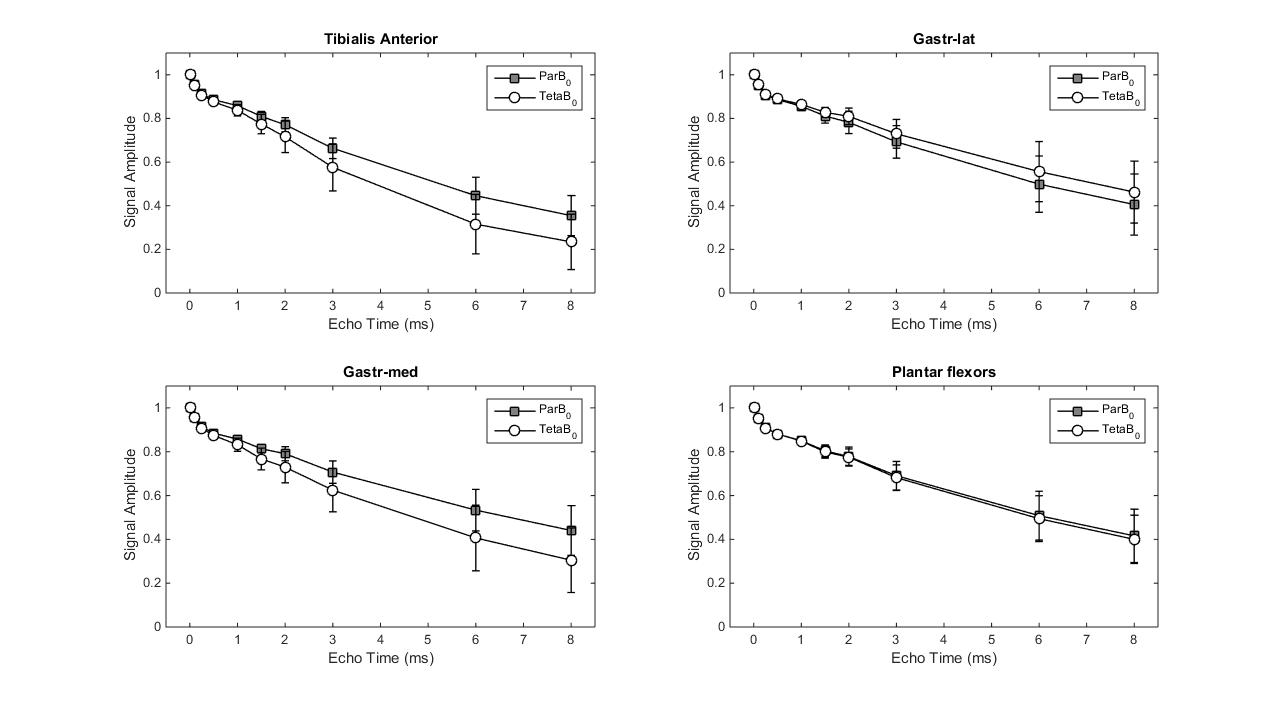
Seven C57Bl6/wild-type mice (male, 3 month-old) were scanned under isoflurane anesthesia in a 7T Bruker system. The right leg was placed in a 1cm diameter 1H saddle-shaped transceiver coil, in maximal plantar flexion, and positioned at two different angles to B0: with the tibia parallel to B0 (ParB0) or tilted to the left side with the maximum possible angulation relative to B0 without moving the coil (Teta≈20°). Each positioning was repeated twice. 3D-T1w images with FOV oriented to B0 in the readout direction allowed measuring the angle between tibia and B0 (RARE-3D, TE=5.53ms, TR=1000ms, resolution 0.2mmX0.2mmX0.2mm). UTE images at the proximal third of the leg were acquired at 10 different TEs: 12µs, 100µs, 250µs, 500µs, 1ms, 1.5ms, 2ms, 3ms, 6ms, 8ms (UTE-2D, TR=20ms, FA=15°, resolution 0.2mmX0.2mm, slice thickness 1mm). Four ROIs were drawn: over the tibialis anterior, gastrocnemius-medialis (Gastr-med), gastrocnemius-lateralis (Gastr-lat) and one over all muscles in the posterior compartment of the calf (plantar flexor muscles). The decay of UTE signal, normalized by the signal intensity in the first TE, was fitted using four different models (Figure 1): a simple mono-exponential model, in addition to bi- and tri-exponential models. F-tests were performed between bi- and tri-exponential models to identify the one that better represented the data. For each mouse, the mean value of the fitting parameters from the two acquisitions at the same angle was calculated. Then, for each muscle, fitting parameters were compared for the two leg positions with Student T-test.Results
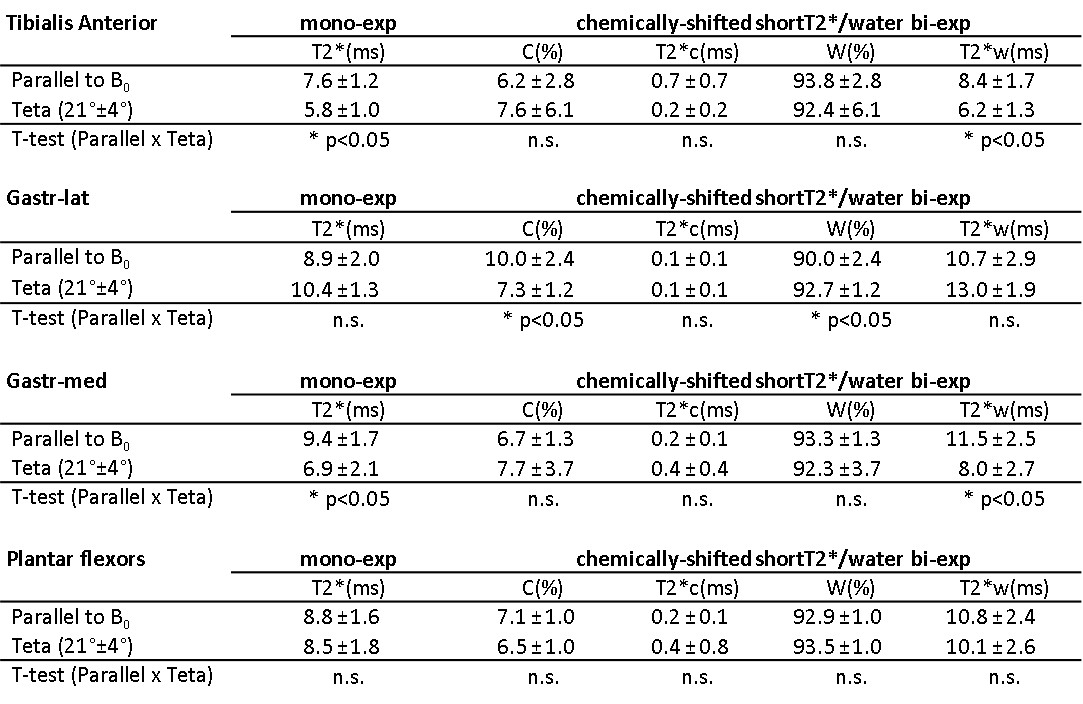
Figure 2 illustrates the two leg positions in the static magnetic field and the angles between tibia and B0 (ParB0=4°±2°, TetaB0=21°±4°). UTE signal decay was similar in both leg positioning for plantar flexor muscles. Nevertheless, for tibialis anterior and Gastr-med, a faster signal decay could be observed when the leg was not aligned to B0 (Figure 3). The F-test revealed that model 3 was the one that better represented the data. This model accounts for a chemically-shifted short-T2* signal decay at the methylene frequency and a longer T2* water signal decay1 (Figure 1). The parameters extracted from both this model and the standard mono-exponential model were analyzed. T2* estimated with the mono-exponential model was 23% shorter in tibialis anterior and 26% shorter in Gastr-med when the leg was placed at angle Teta to B0 (p<0.05). To the opposite, no significant changes in T2* with leg positioning were detected for Gastr-lat or when all plantar flexor muscles were evaluated together. Similar results were observed for model 3: while no differences were detected in plantar flexor muscles for all parameters, tibialis anterior presented a 26% reduction and Gastr-med presented a 31% reduction in water-T2* when the leg was positioned at angle Teta to B0 (p<0.05 for both). In addition, water and chemically-shifted short-T2* signal fractions estimated for Gastr-lat changed with leg positioning (p<0.05, Table 1).Discussion and Conclusion
The results point to an anisotropic behavior of water-T2* when muscles were evaluated individually, while no such effect could be observed for the ROI grouping all plantar flexor muscles. The anisotropic muscle structure, with fiber bundles surrounded by connective tissue and capillaries running preferentially along muscle fibers, might lead to orientation-dependent changes on the local susceptibility-induced B0 gradients through the tissue. We hypothesize that these orientation-dependent susceptibility effects would be responsible for changes in individual muscle T2* with positioning in the static magnetic field, while such effect would be canceled out when muscles with variable fiber alignment are evaluated together. There are indications that interstitial fibrosis might decrease skeletal muscle-T25 and myocardium-T2*6. Nevertheless, if T2* is influenced by muscle orientation in B0, any impact of fibrosis on T2* could be masked. In conclusion, muscle T2* can be sensitive to muscle orientation in the static magnetic field. This observation should be taken into account when evaluating any shortening of water-T2* values in fibrotic muscle.
Acknowledgements
No acknowledgement found.References
1. Siu, A.G., Ramadeen, A., Hu, X. et al. Characterization of the ultrashort-TE (UTE) MR collagen signal. NMR Biomed. 28, 1236–1244 (2015).
2. Araujo, E. C. A., Azzabou, N., Vignaud, A. et al. Quantitative NMR imaging of the short-T2 components in the SKM tissue: alterations observed in myopathic patients. Proc. 23rd ISMRM, Toronto, Canada (2015).
3. Araujo, E. C. A., Azzabou, N., Vignaud, A.et al. Quantitative ultrashort TE imaging of the short-T2 components in skeletal muscle using an extended echo-subtraction method. Magn. Reson. Med. 78, 997–1008 (2017).
4. Lebon, V., Carlier, P. G., Brillault-Salvat, C. et al. Anisotropy of the BOLD Effect in the Skeletal Muscle. Proc. 6th ISMRM, Sydney, Australia (1998).
5. Vohra, R., Accorsi, A., Kumar, A. et al. Magnetic Resonance Imaging Is Sensitive to Pathological Amelioration in a Model for Laminin-Deficient Congenital Muscular Dystrophy (MDC1A). PLoS One 10, e0138254 (2015).
6. van Nierop, B.J., Bax, N.A.M., Nelissen, J.L. et al. Assessment of myocardial fibrosis in mice using a T2*-weighted 3D radial magnetic resonance imaging sequence. PLoS One 10, e0129899 (2015).
Figures