5077
Drug efficacy monitoring using magnetic resonance imaging in a cancer cachexia model1Department of Biomedical Sciences, Asan Institute for Life Sciences, Asan medical center, University of Ulsan College of Medicine, Seoul, Republic of Korea, 2Green Cross WellBeing Coporation, Seongnam, Gyeonggi-do, Republic of Korea, 3MR Core Laboratory, Asan Institute for Life Sciences, Asan medical center, Seoul, Republic of Korea, 4Department of Radiology, Asan medical center, University of Ulsan College of Medicine, Seoul, Republic of Korea, 5MR Core Laboratory, Asan Institute for Life Sciences, Asan medical center, University of Ulsan College of Medicine, Seoul, Republic of Korea, 6Department of Convergence Medicine, Asan medical center, University of Ulsan College of Medicine, Seoul, Republic of Korea
Synopsis
Most studies in the field of cachexia research show photographs and H&E-stained sections of hindlimb muscles to demonstrate changes in fat/muscle volume. However, these methods do not capture the global changes in fat/muscle volume in a cachexia model.
In this study, we established a cachexia animal model induced by tumor and ant-cancer drug and examined the efficacy of an anticachexia drug by monitoring fat/muscle volume using magnetic resonance imaging (MRI). Our results illustrated that MRI is a useful tool for drug development owing to its ability to monitor fat/muscle volumes in the cachexia model.
INTRODUCTION
Cancer cachexia is a complex metabolic syndrome that affects >50% of all cancer patients.1-3
Wasting of skeletal muscles due to the effects of cancer and its chemotherapy is some of the main features of cancer cachexia.3,4 To confirm muscle loss in the cancer cachexia model, most studies employ hindlimb photographs and muscle fiber morphology using H&E staining. However, these methods do not reflect muscle atrophy in the entire body in the cachexia model.
Here we demonstrated that using magnetic resonance imaging (MRI), quantitative analysis of skeletal muscle loss in the whole body can be performed in a cancer cachexia model induced by tumor and anticancer drug [5-fluorouracil (5-FU)]. Further, we evaluated the effect of BST204 therapy,5 which is known to alleviate cancer cachexia by preserving the muscle mass.
METHODS
Cancer cachexia model and drug administration
BST204, a purified dry extract of ginseng, was obtained from Green Cross WellBeing Corporation (Seongnam, Korea). CT26 mouse colon carcinoma cells (1×10⁶ cells/mouse) were subcutaneously implanted into the right flanks of BALB/c mice (male, 8 weeks old). When tumor volume reached 100–150 mm3, drug administration was started.
The mice were randomly allocated to normal, xenograft, control (xenograft+5-FU), and BST204 (xenograft+5-FU+BST204, 100 and 200 mg/kg) groups. Intraperitoneal injections of 5-FU (50 mg/kg) were administered thrice a week for 11 days. BST204 was orally administered five times a week for 11 days (Figure 1).
MRI acquisition and analysis
All in vivo MR assessments were performed using a horizontal 9.4T/160-mm scanner (Agilent Technologies, Palo Alto, CA, USA) with 400-mT/m gradient sets. T1-weighted images were acquired using a fast spin echo pulse sequence (TR=1100 ms; TE=10.75 ms; average=1; field of view=30 mm×30 mm; slice thickness=1 mm; matrix size=128×128).
The region of interest (ROI) was selected on each slice, and the total fat or muscle volume was calculated using the following formula:
V (fat or muscle volume)=Th (slice thickness)×S (sum of ROI).
Statistical analysis
Data were analyzed using SPSS 13.0. Results are shown as mean±SEM. Between-group differences were assessed using one-way ANOVA, followed by LSD post-hoc test. P<0.05 was considered statistically significant.
RESULTS
MR images of animal models were examined to determine the effect of CT26 cancer cell implantation (xenograft group) and 5-FU treatment (control group) on cancer cachexia development (Figure 2). Compared with the normal group, the xenograft group demonstrated significantly decreased fat volume (P<0.01; Figure 2B) but no change in muscle volume (Figure 2C) at 11 days. However, compared with the normal and xenograft groups, the control group demonstrated significantly decreased fat and muscle volumes at 11 days (P<0.001 and P<0.001, respectively; Figure 2B and 2C).
5-FU and BST204 (200 mg/kg) treatment significantly attenuated the loss of muscle volume at 11 days (P<0.05; Figure 2C) but did not significantly change fat volume (Figure 2B).
Figure 3A illustrates the progressive weight loss observed in the control and BST204 groups compared with that in the normal group. In addition, compared with the control group, the BST204 200 mg/kg group exhibited significant differences in the late stage of drug treatment (P<0.05).
DISCUSSION
We quantitatively analyzed the changes in fat/muscle volume using MRI in a cancer cachexia model induced by tumor and anticancer agent (5-FU) and then confirmed the correlation of MRI findings with changes in body weight. In addition, we examined the effect of BST204 on the changes in fat/muscle volume and body weight and drew the following inferences:
First, compared with the xenograft group, the group treated with 5-FU showed a significant decrease in fat/muscle volume and body weight (Figures 2B, 2C, and 3A). These results indicated that toxic effects of chemotherapy aggravate cancer cachexia more than the cancer itself. Second, compared with the control group, the group treated with 5-FU+BST204 200 mg/kg showed no significant difference in fat volume but showed significant differences in muscle volume and body weight (Figures 2B, 2C, and 3A). These results demonstrated that BST204 alleviates cancer cachexia by attenuating muscle loss. Finally, compared with the normal group, the xenograft group showed a significant decrease in fat volume; however, the lack of difference in body weight was probably due to the weight of the growing tumor (Figure 3B).
CONCLUSION
Through quantitative analysis of fat/muscle volume using MRI of whole body, anticachexia drug (BST204) was found to be effective in a cachexia animal model induced by tumor and anticancer drug (5-FU). Lastly, we suggest that MRI facilitates drug development owing to its ability to monitor changes in fat/muscle volumes in a cachexia model.Acknowledgements
No acknowledgement found.References
1. Suzuki H, Asakawa A, Amitani H, et al. Cancer cachexia-pathophysiology and management. J Gastroenerol. 2013; 48:574-594
2. von Haehling S, Anker SD. Cachexia as major underestimated unmet medical need: facts and numbers. J Cachexia Sarcopenia Muscle. 2013 Sep;4(3):173-8.
3. Huang et al. Factors associated with cancer-related fatigue in breast cancer patients undergoing endocrine therapy in an urban setting: a cross-sectional study. BMC Cancer 2010, 10:453
4. Stasi R, Abriani L, Beccaglia P, Terzoli E, Amadori S. Cancer-related fatigue: evolving concepts in evaluation and treatment. Cancer 2003,98:1786-1801.
5. Park HJ, Shim HS, et al. Ginseng Purified Dry Extract, BST204, Improved Cancer Chemotherapy-Related Fatigue and Toxicity in Mice. Evid Based Complement Alternat Med. 2015; 2015:197459.
Figures
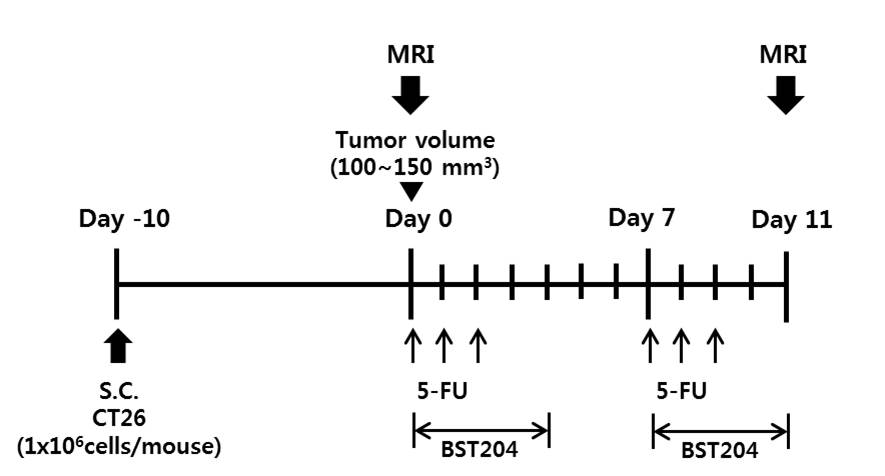
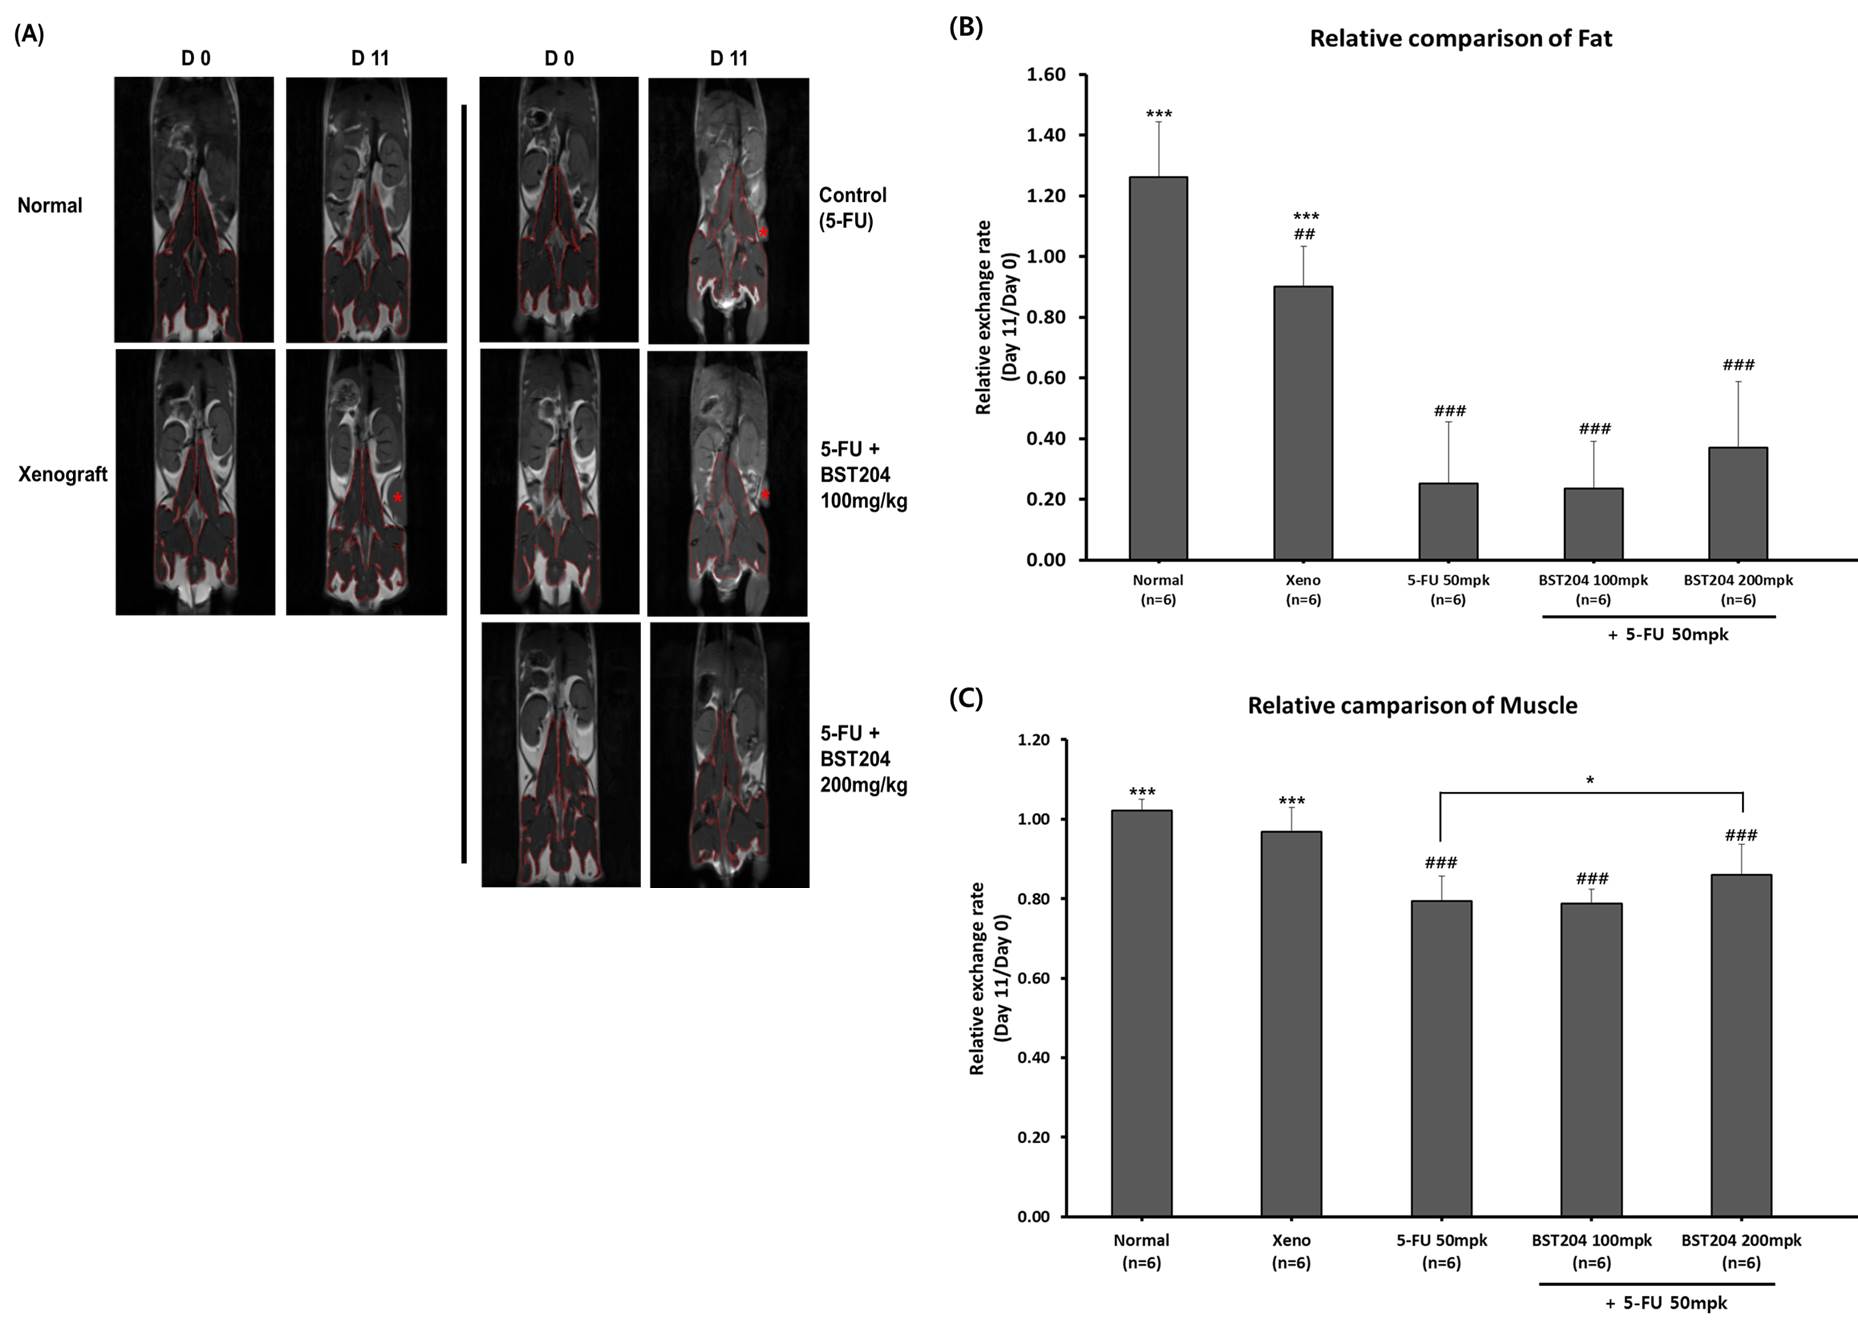
Figure 2 Analysis of changes in fat and muscle volumes due to cancer and drug (5-FU, BST204) using in vivo T1w imaging. The toxic effects of 5-FU accelerated the loss of fat and muscle in the cancer cachexia model. BST204 200 mg/kg ameliorated muscle loss compared with 5-FU treatment.
(A) T1w images of a mouse model showing fat (white), muscle (red lined area), and tumor (red star).
(B), (C) Relative changes in fat and muscle volumes, respectively.
Data presented as mean±SEM.
#P<0.05, ##P<0.01, ###P<0.001 compared with the normal group.
*P<0.05, **P<0.01, ***P<0.001 compared with the control group.
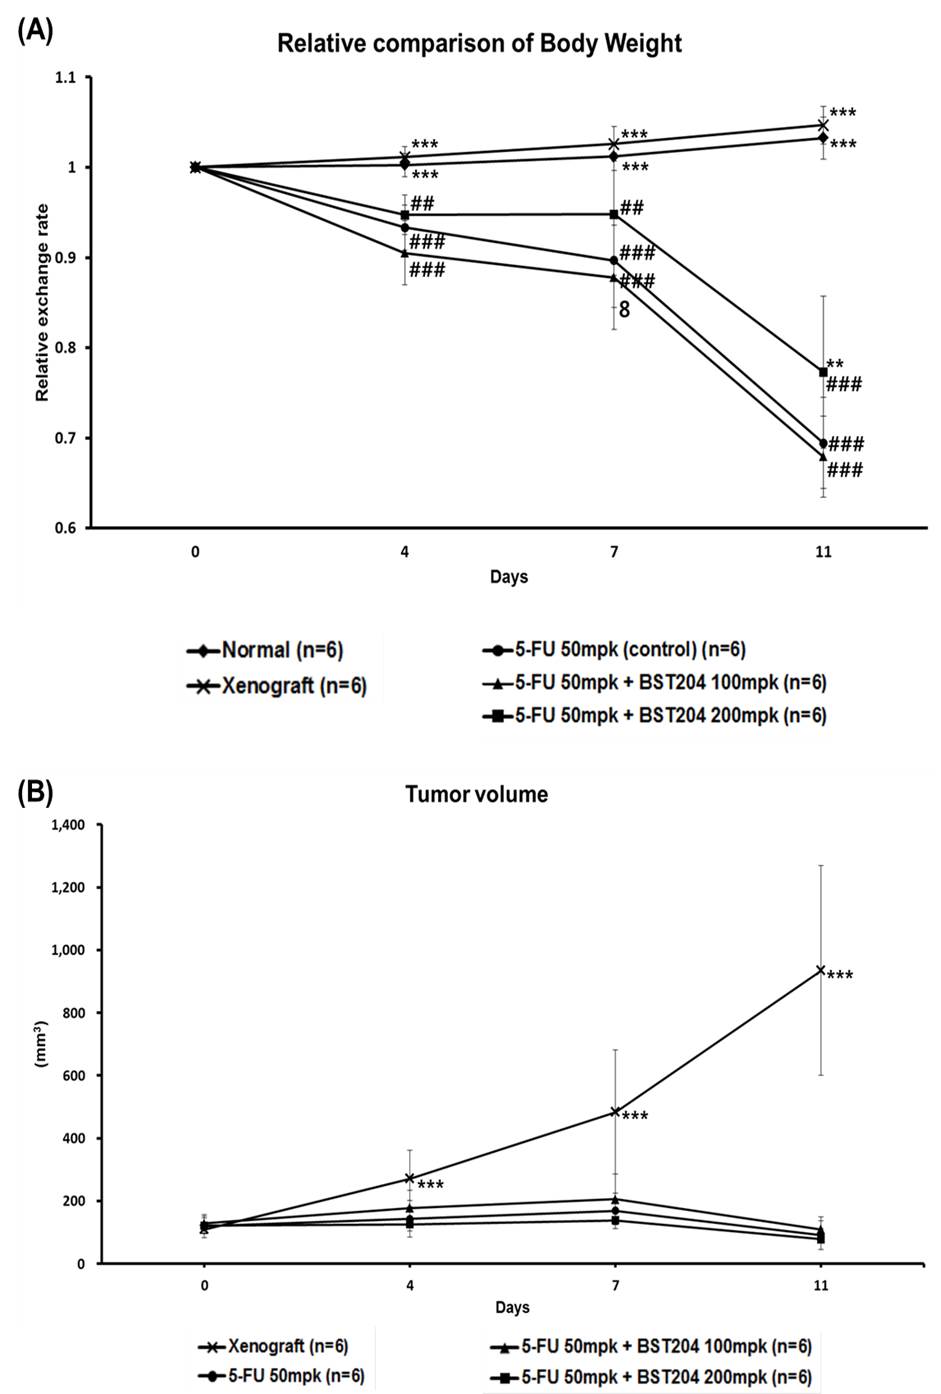
Figure 3 Effects of 5-FU and BST204 treatment on body weight and tumor volume. 5-FU inhibits tumor growth; however its toxic effects aggravate cancer cachexia. In addition, BST204 200 mg/kg attenuates weight loss due to cancer cachexia.
(A) Relative change in body weight of mice during the period of drug administration.
(B) The effect of drug treatment on tumor size.
Data presented as mean±SEM.
#P<0.05, ##P<0.01, ###P<0.001 compared with the normal group.
*P<0.05, **P<0.01, ***P<0.001 compared with the control group.