5076
Muscle specific role of acetylcarnitine concentration and IMCL accumulation as a marker for long term glycemic control: 3T 1H MRS study1High-Field MR Center, Department of Biomedical Imaging and Image-Guided Therapy, Medical University of Vienna, Vienna, Austria, 2Christian Doppler Laboratory for Clinical Molecular MR Imaging, Vienna, Austria, 3Division of Endocrinology and Metabolism, Department of Internal Medicine III, Medical University of Vienna, Vienna, Austria
Synopsis
Acetylcarnitine can be observed non-invasively in 1H MRspectra in skeletal muscle and its inverse relationship to intramyocellular lipids and metabolic markers of chronic hyperglycemia was suggested. This study aimed to compare the acetylcarnitine concentrations and intramyocellular lipids content in tibialis anterior and soleus of four different groups of volunteers with broad range of glycemic control by 1HMRS on 3Tscanner. Differences in the patient phenotype were mirrored by increased intramyocellular lipids in the tibialis anterior and decreased acetylcarnitine in soleus of type2diabetes patients. This muscle specific behavior of intramyocellular metabolites could represent different fiber composition in examined muscles.
Introduction:
Association between acetylcarnitine concentrations in skeletal muscle, insulin sensitivity[1] and type 2 diabetes mellitus (T2DM)[2] has been reported previously. Moreover, intramyocellular lipids (IMCL) are also important indicator of whole body insulin sensitivity[3] [4].Since, acetylcarnitine as well as IMCL in skeletal muscle can be observed non-invasively by proton magnetic resonance spectroscopy (1HMRS) and it can be a unique tool to unravel the roles in relation to metabolic health and disease, we aimed to compare the acetylcarnitine concentrations and IMCL content in different types of skeletal muscles (tibialis anterior (TA) and soleus (SOL)) in four groups of volunteers with broad range of long term glycemic control–(lean healthy (LHV), overweight-to-obese (OOV), patients with impaired glucose tolerance (IGT) and with type 2 diabetes mellitus (T2DM)) and to perform analysis of the interrelations between these MRS-derived as well as other metabolic parameters.Materials and Methods:
Resting acetylcarnitine levels were measured in 30 subjects: 9 LHV (BMI 21.36±1.46 kg/m2, age 41±11years, glycated haemoglobin (HbA1C) 5.04±0.19%), 5 OOV (BMI 32.47±3.12 kg/m2, age 48±16 years, HbA1C 5.28±0.31%), 7 IGT (BMI 30.14±5.01 kg/m2, age 51±4 years, HbA1C 5.53±0.36%) and 9 T2DM (BMI 29.94±4,65 kg/m2, age 49±10 years, HbA1C 6,67±0.78%). All measurements were performed on 3T whole-body Siemens PrismaFit MR System in supine position with right calf muscle positioned within 15-channel knee coil. Measurements were conducted after an overnight fast at 7:30a.m. T1 weighted multi-slice localizer images were acquired and used for volume-of-interest (VOI) positioning. VOIs for acetylcarnitine (40x35x15mm3) and IMCL (12x12x20mm3) were carefully placed and co-localized within the SOL and TA muscles. Localized shimming was performed manually, on the adjustment volume matching the acetylcarnitine VOI size. Data were obtained using STEAM sequence with following parameters for acetylcarnitine: TR/TE=2000/300ms; spectral bandwidth=3kHz; number of averages=128; delta frequency=-2.5ppm relative to water resonance and for IMCL: TR/TE=2000/20ms; spectral bandwidth=2kHz; number of averages=16; delta frequency= -2.3ppm relative to water resonance. For absolute quantification of acetylcarnitine, water signal was measured separately (TR/TE=2000/20 ms; NA=1; delta frequency= 0ppm) from same VOI and for IMCL evaluation we used water from the IMCL spectra. All spectra were fitted using the AMARES fitting algorithm in the jMRUI v5.2 software [5]. Lipids surrounding the acetylcarnitine peak were fitted with a constrained frequency of 2.0 - 2.1ppm and 2.17-2.30ppm to avoid their influence on fitted acetylcarnitine. Using the water peak as an internal reference and respective relaxation corrections, the concentration of acetylcarnitine and IMCL were calculated. All statistical analyses were done in SPSS (version 24.0; IBM SPSS, Chicago, Illinois, USA). All values are provided as mean ± SD and a p value < 0.05 was considered significant.Results:
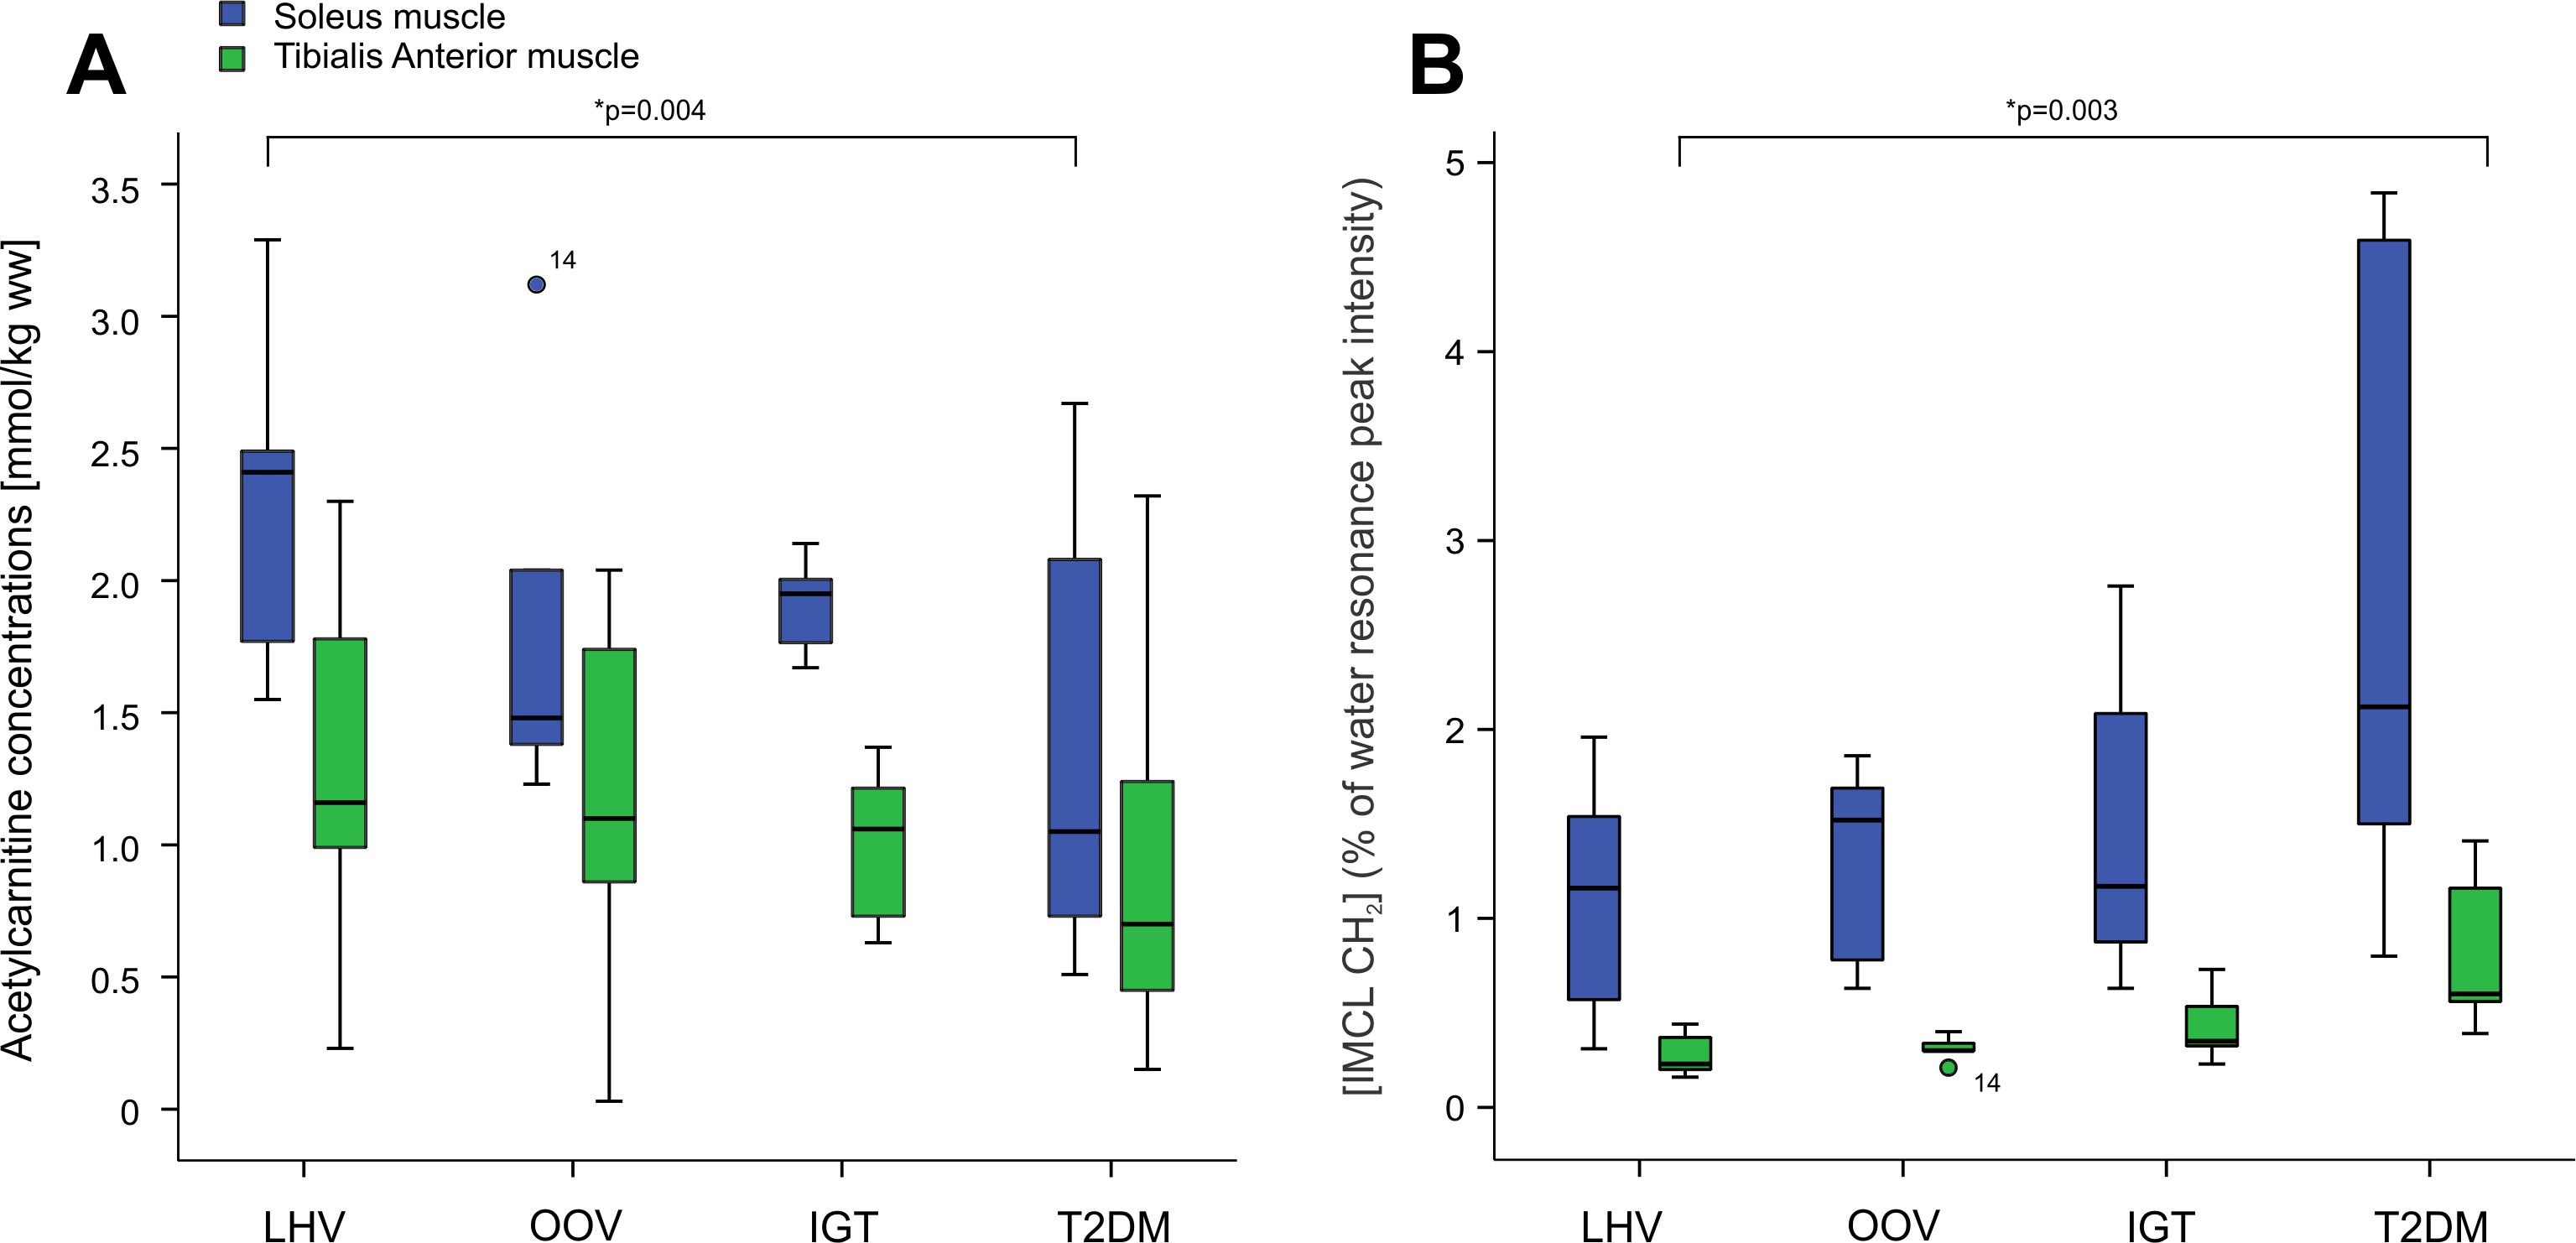
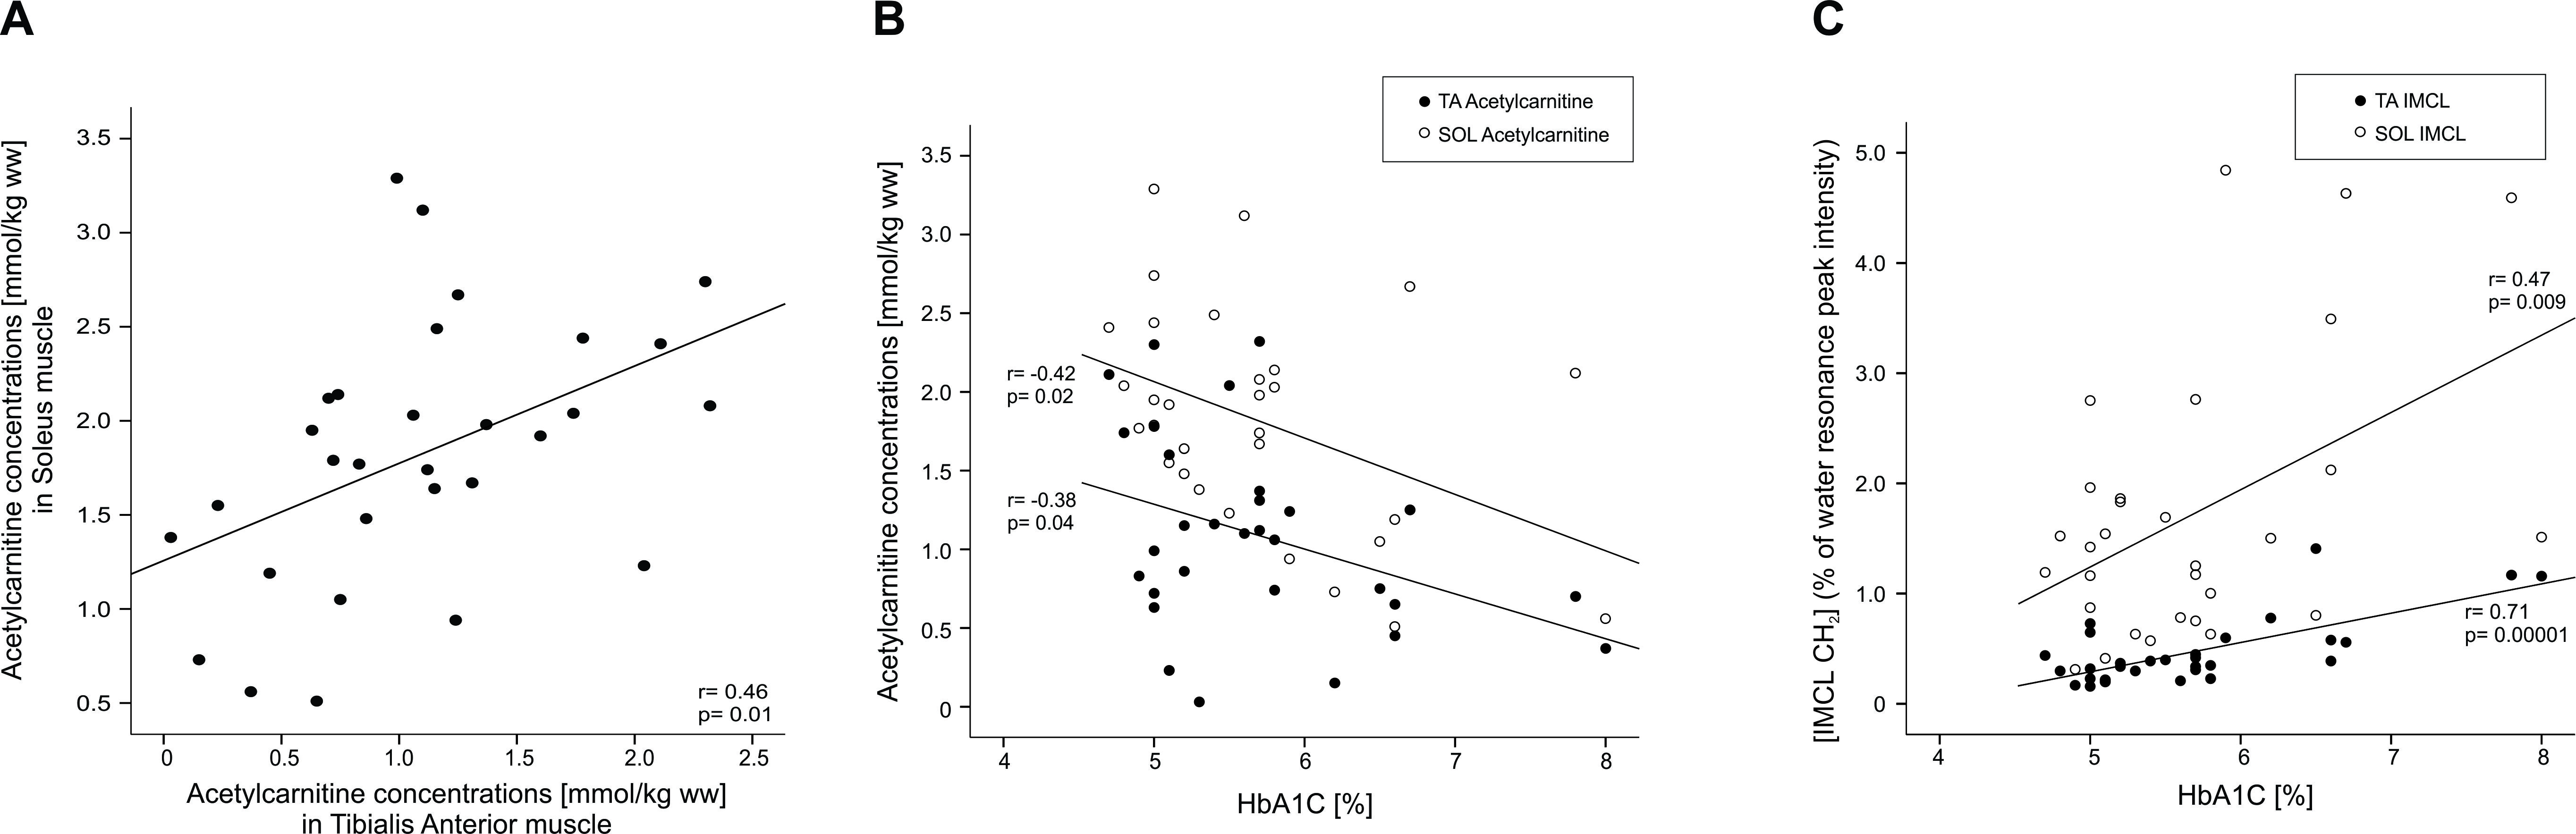
In the SOL muscle we have found significantly lower concentrations of acetylcarnitine in T2DM group in comparison with LHV (p=0.004)(Figure 1A) whereas the IMCL content was significantly higher in TA muscle in T2DM group in comparison with LHV (p=0.003)(Figure 1B). IMCL in the SOL muscle and acetylcarnitine concentrations in the TA muscle did not significantly differ among the groups. Moreover, we found positive correlation between acetylcarnitine concentrations from SOL and TA muscles (r= 0.46; p=0.01), negative correlation between HbA1C and acetylcarnitine concentrations in SOL (r=-0.42; p=0,02) and TA muscle (r=-0.38; p=0.04) and positive correlation between HbA1C and IMCL concentrations in SOL (r=0.47; p=0.009) and TA muscle (r=0.71; p=0.00001). Correlations are depicted in Figure 2.Discussion and Conclusions:
Our results suggest that T2DM patients are characterized by a decreased formation of acetylcarnitine in SOL and increased accumulation of IMCL in TA, possibly underlying decreased insulin sensitivity. We can also suggest that different fiber composition with increased share of oxidative metabolism in SOL muscle is more sensitive to detect differences in acetylcarnitine concentrations and TA with its higher ratio of glycolytic metabolism for IMCL measurement. Detecting both acetylcarnitine and IMCL concentration by 1H MRS suggest non-invasive read-outs of metabolic flexibility in relation to pathological conditions such as mitochondrial dysfunction, insulin resistance, and diabetes.Acknowledgements
Colleagues at the MR Centre of Excellence, Anniversary Fund of Austrian National Bank (OeNB) (#15363 to MKrs), Christian Doppler Society (to ST)References
[1] L. Lindeboom, C. I. Nabuurs, J. Hoeks, B. Brouwers, E. Phielix, M. E. Kooi, M. K. C. Hesselink, J. E. Wildberger, R. D. Stevens, T. Koves, D. M. Muoio, P. Schrauwen, and V. B. Schrauwen-Hinderling, “Long-echo time MR spectroscopy for skeletal muscle acetylcarnitine detection.,” J. Clin. Invest., vol. 124, no. 11, pp. 4915–25, 2014.
[2] G. Mingrone, “Carnitine in Type 2 Diabetes,” Ann. N. Y. Acad. Sci., vol. 1033, no. 1, pp. 99–107, Nov. 2004.
[3] M. Krssak, K. Falk Petersen, A. Dresner, L. DiPietro, S. M. Vogel, D. L. Rothman, G. I. Shulman, and M. Roden, “Intramyocellular lipid concentrations are correlated with insulin sensitivity in humans: a 1 H NMR spectroscopy study,” Diabetologia, vol. 42, no. 1, pp. 113–116, Jan. 1999.
[4] A. Kautzky-Willer, M. Krssak, C. Winzer, G. Pacini, A. Tura, S. Farhan, O. Wagner, G. Brabant, R. Horn, H. Stingl, B. Schneider, W. Waldhäusl, and M. Roden, “Increased intramyocellular lipid concentration identifies impaired glucose metabolism in women with previous gestational diabetes.,” Diabetes, vol. 52, no. 2, pp. 244–51, Feb. 2003.
[5] L. Vanhamme, van den Boogaart A, and Van Huffel S, “Improved method for accurate and efficient quantification of MRS data with use of prior knowledge,” J. Magn. Reson., vol. 129, no. 1, pp. 35–43, Nov. 1997.
Figures