5073
Exercise-induced muscle hypoxia and re-oxygenation in the calf: A comparison between Near Infra-Red Spectroscopy (NIRS) and BOLD MRI1Department of Radiology and Imaging Sciences, University of Utah School of Medicine, Salt Lake City, UT, United States, 2Division of Geriatrics, University of Utah School of Medicine, Salt Lake City, UT, United States
Synopsis
This study compared calf-muscle oxygenation measurements from BOLD MRI and near-infrared spectroscopy (NIRS) in a group of healthy subjects after plantar-flexion exercise. NIRS measurement of deoxyhemoglobin (dHb) was limited to the medial gastrocnemius, while BOLD imaging allowed for R2* mapping of the entire calf. Post-exercise R2* recovery dynamics in the calf indicated significant functional differences between different calf muscle groups. This advantage of BOLD makes it potentially valuable for assessing peripheral arterial disease (PAD), where impairment of muscle function can vary depending on the location of upstream stenosis.
Motivation
Peripheral artery disease (PAD) is characterized by diminished blood supply to the affected leg.1 Measurement of calf-muscle oxygenation following exercise can provide insight into the functional status of the calf muscles and help predict therapeutic outcomes.2 Near-infrared spectroscopy (NIRS)3 is widely used for assessing muscle oxygenation. However, using probes, NIRS can only access the superficial muscles (<3-5 cm deep). Alternatively, blood oxygen level dependent (BOLD)4 MRI provides a promising imaging-based method for evaluating tissue oxygenation; BOLD-measured R2* is sensitive to deoxyhemoglobin (dHb) concentration. Unlike NIRS, BOLD R2* can be measured for the entire calf.
In this study, we used both NIRS and BOLD MRI to measure calf-muscle oxygenation following plantar-flexion exercise in healthy subjects. The recovery dynamics of the two measures were examined and compared to evaluate their potential value for assessing calf muscle function in PAD patients.
Methods
Nine healthy subjects (5 female, 22-43 years) were included in this IRB-approved study. Each subject underwent three examinations, each on a separate day. Two examinations were repeated BOLD scans and a third was for NIRS measurement. For all three sessions, the same protocol of exercise stimulation was used: plantar flexion with 8 lbs of resistance at a rate of 1Hz for 3 minutes. All measurements (BOLD/NIRS) began immediately after exercise.
For NIRS measurement, a near-infrared spectroscopy oximeter (Oxiplex TS, ISS Inc) was used with the probe positioned on the medial gastrocnemius (MG). The measurement lasted for 4 minutes, and the data was transferred to personal computer for processing. Of the multiple types of measurements provided by NIRS, we recorded the dHb vs time curve for comparison against BOLD. The BOLD scan was performed on a 3T MRI scanner (TimTrio, Siemens) with a 4-channel flex coil wrapped around the calf. Eighty acquisitions were collected consecutively over 4 minutes using a 2D multi gradient-echo sequence: TEs 4, 15, 25 ms, TR 43 ms, flip angle 25°, FOV 160×160 mm, matrix 128×128, slice thickness: 5.5 mm. The imaging slice was positioned axially through the thickest part of the calf. The BOLD images were first converted to R2* maps, and regions-of-interest were defined to obtain R2* vs time curves for the medial and lateral gastrocnemius (MG and LG).
To characterize the recovery pattern of R2* from BOLD and dHb from NIRS, we fit their time courses with an exponential decay. From each curve fitting, we obtained estimates for the signal change, as a percentage of the resting level, and recovery time. Both parameters were compared between BOLD R2* and NIRS dHb.
Results
Representative R2* maps of the calf are shown in Figure 1. The three maps shown differ by their post-exercise acquisition time. In the MG region, an initial decrease and subsequent recovery of R2* was apparent, presumably due to the flush of oxygenated blood through the muscle. Within the MG, the temporal pattern of R2* change was spatially heterogeneous.
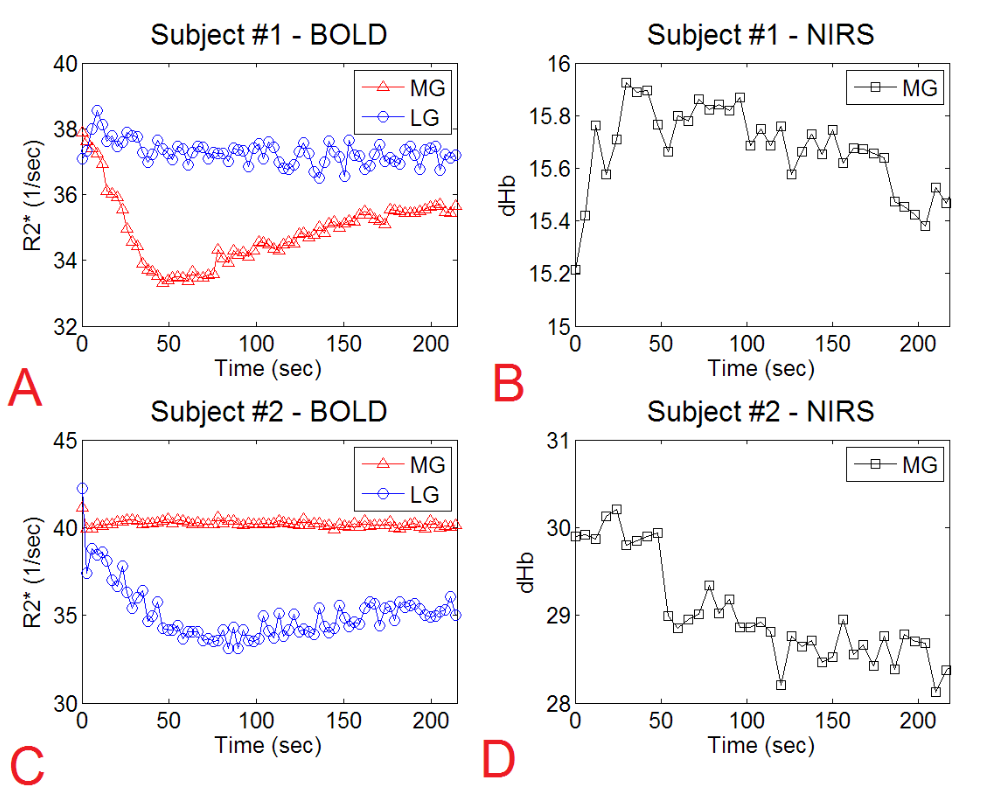
Muscle activation often differs between subjects or even between different exercise sessions of the same subject. Figure 2 provides two examples of post-exercise recovery dynamics acquired from different subjects. In Subject 1 (Figure 2A), a pronounced temporal change in R2* was observed in the MG, while R2* in the LG remained largely unchanged. Conversely, subject 2 (Figure 2C) showed R2* changes in the LG but not the MG. For the same two subjects, NIRS-dHb curves are shown in Figures 2B and 2D. Interestingly, for Subject 1 the dHb of the MG did not change much, in contrast to its R2* dynamics in Figure 2A. The same was observed for Subject 2 (Figure 2D). With this activation variability, it is challenging to interpret NIRS measurements that are typically obtained at only one location.
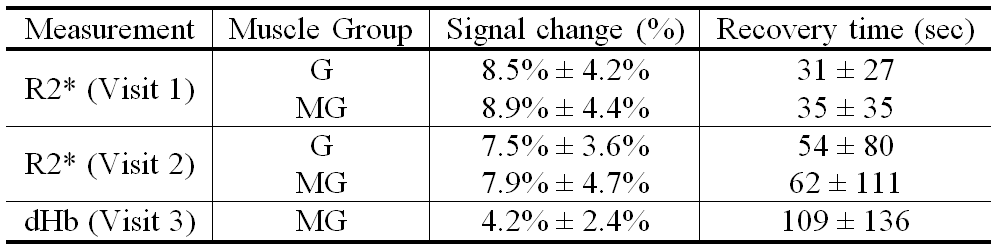
Table 1 summarizes the magnitudes
of signal change and the recovery times for the R2* and dHb signals acquired during
exercise recovery. Compared to the NIRS dHb data, BOLD R2* showed a higher
magnitude of signal change and a lower recovery time. R2* changes were
comparable between the two visits.
Discussion
This study compared the post-exercise dynamics of BOLD R2* and NIRS-measured dHb in a group of healthy subjects. Inter-visit reproducibility of R2* was relatively high, and for the same exercise the magnitude of R2* change was higher than that of the NIRS dHb level. Since BOLD imaging allows for R2* mapping of the entire calf, it has great potential for examining functional differences between the different calf-muscle groups. This advantage of BOLD makes it potentially valuable for assessing PAD, where impairment of muscle function varies depending on the location of upstream stenosis.5Acknowledgements
No acknowledgement found.References
1. Belch JJ, Topol EJ, Agnelli G, et al. Critical issues in peripheral arterial disease detection and management: a call to action. Arch Intern Med 2003;163(8):884-892.
2. Dilsizian V, Rocco TP, Freedman NM, Leon MB, Bonow RO. Enhanced detection of ischemic but viable myocardium by the reinjection of thallium after stress-redistribution imaging. N Engl J Med 1990;323(3):141-146.
3. Koga S, Kano Y, Barstow TJ, et al. Kinetics of muscle deoxygenation and microvascular PO(2) during contractions in rat: comparison of optical spectroscopy and phosphorescence-quenching techniques. J Appl Physiol (1985) 2012;112(1):26-32.
4. Prasad PV, Edelman RR, Epstein FH. Noninvasive evaluation of intrarenal oxygenation with BOLD MRI. Circulation 1996;94(12):3271-3275.
5. Lenhart RL, Francis CA, Lenz AL, Thelen DG. Empirical evaluation of gastrocnemius and soleus function during walking. J Biomech 2014;47(12):2969-2974.
Figures