5070
Semi-automatic segmentation of individual muscles in MR images: A new tool dedicated to the follow-up of patients with neuromuscular disorders1Aix Marseille Univ, Université de Toulon, CNRS, ENSAM, LSIS, UMR 7296, Marseille, France, 2Aix Marseille Univ, CNRS, Centre de Résonance Magnétique Biologique et Médicale (CRMBM), UMR 7339, Marseille, France, 3Department of Radiology and Nuclear Medicine, Radboud university medical center, Nijmegen, Netherlands
Synopsis
Quantitative magnetic resonance imaging can monitor intramuscular fat accumulation and has proven value for follow-up and therapy evaluation of neuromuscular disease. So far, segmentation processes of individual muscles from quantitative MRI data have been recognized as challenging in healthy subjects and even more challenging in patients for whom borders between muscles can be compromised by the disease process. We designed a semi-automatic segmentation pipeline of individual leg muscles in MR images based on automatic propagation of a minimal number of manually segmented MR slices. This segmentation pipeline allows an accurate follow-up of any MRI biomarkers in neuromuscular disorders.
INTRODUCTION
Segmentation of individual muscles is of high interest in neuromuscular disorders for which the muscle symptomatology is accompanied by a loss of muscle tissue and a replacement by fat. Quantification of these disease processes has been of great value for understanding the disease1-3 and for therapy evaluation4,5. The segmentation of individual muscles on MR images has been recognized as challenging because of high muscle shape variability among subjects, and the potential fatty infiltration and muscle atrophy which can alter the frontiers between muscles. So far, manual segmentation of anatomical structures has been used in multiple studies, and this approach has been widely acknowledged as time-consuming and operator-dependent6. Recently, several semi-automated/automated methods have been applied to MR images of healthy subjects7–11, and few to MR images of patients with neuromuscular disorders12. Overall, segmentation methods have been assessed on healthy subjects so that the issues of fat infiltration and muscle atrophy as confounding factors have never been addressed. The purpose of our study was to propose a new individual muscles segmentation pipeline in patients with neuromuscular disorders and to assess the potential of this method for follow-up studies.METHODS
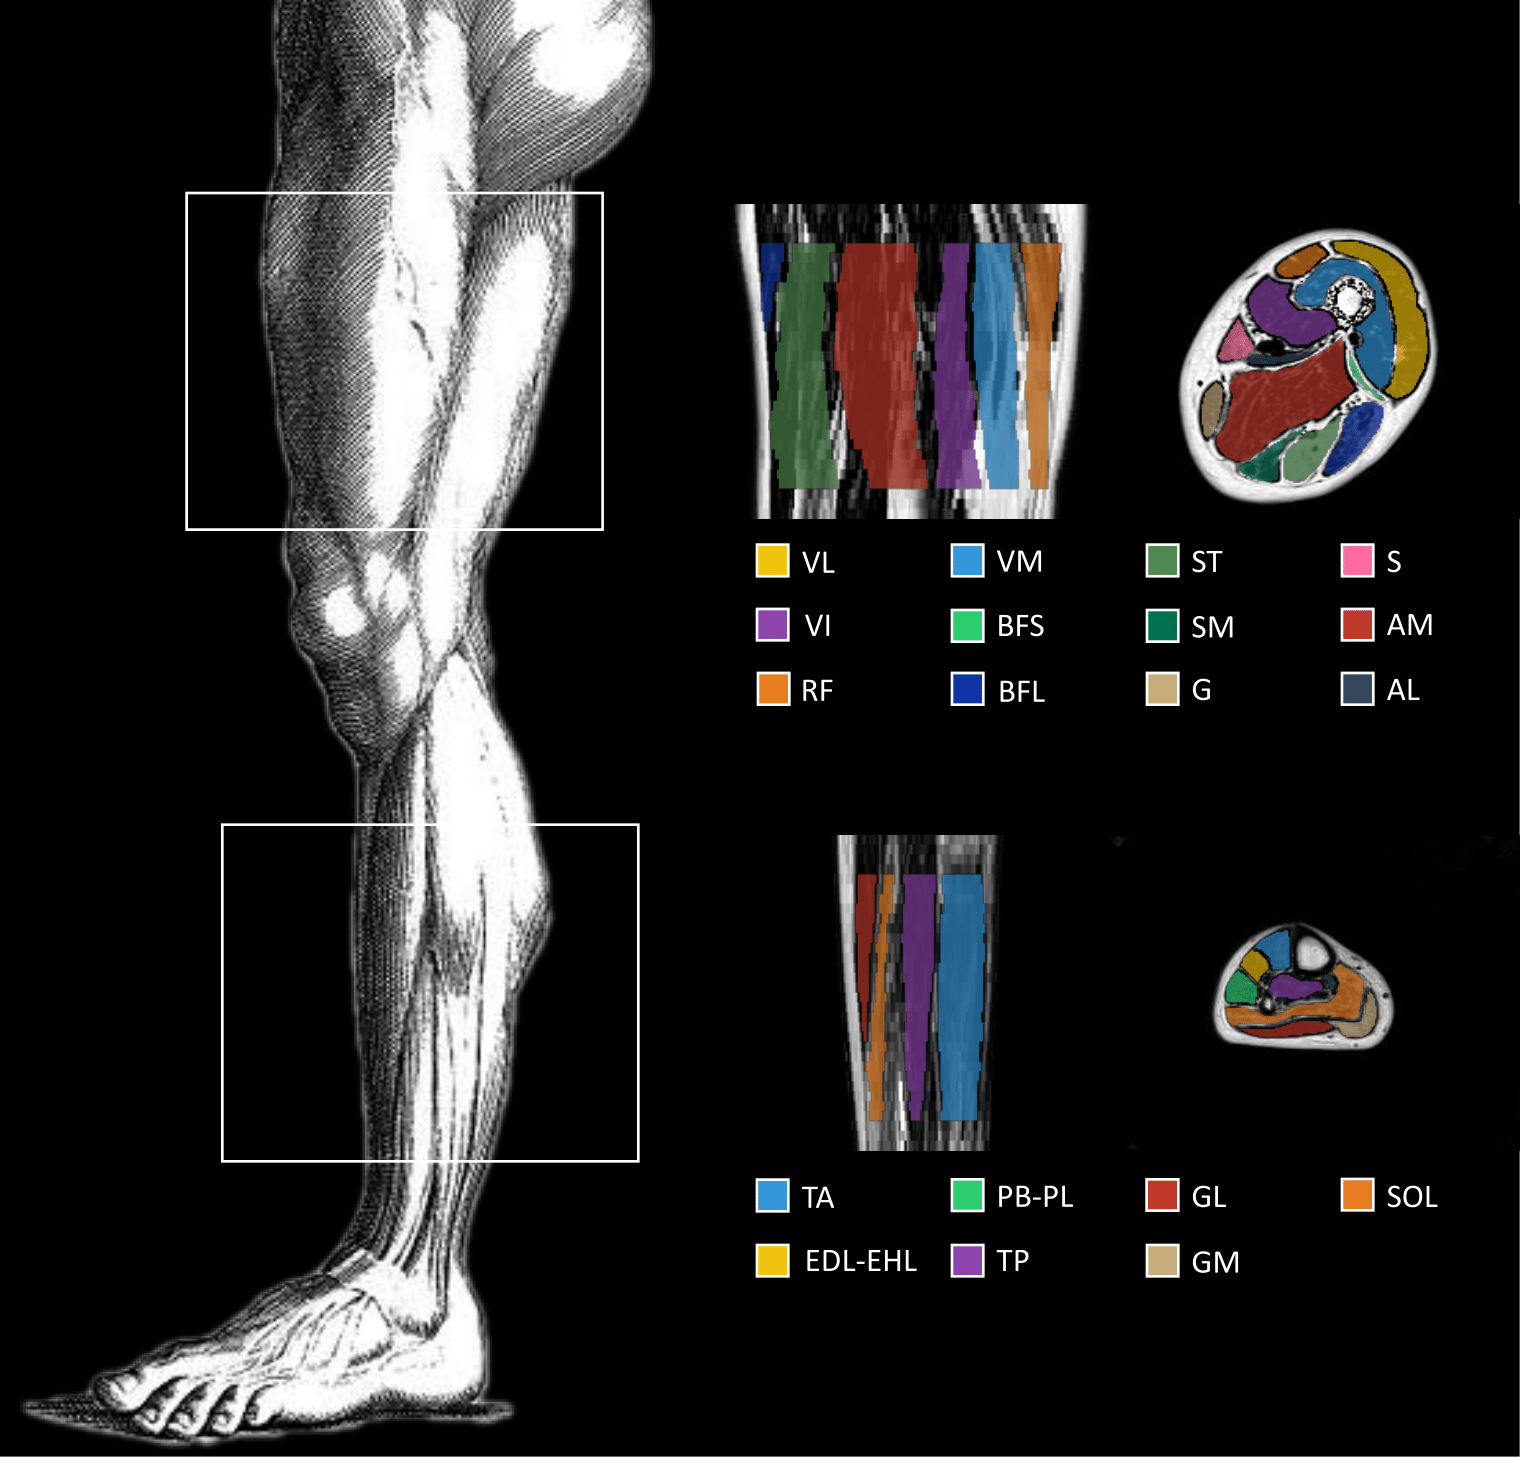
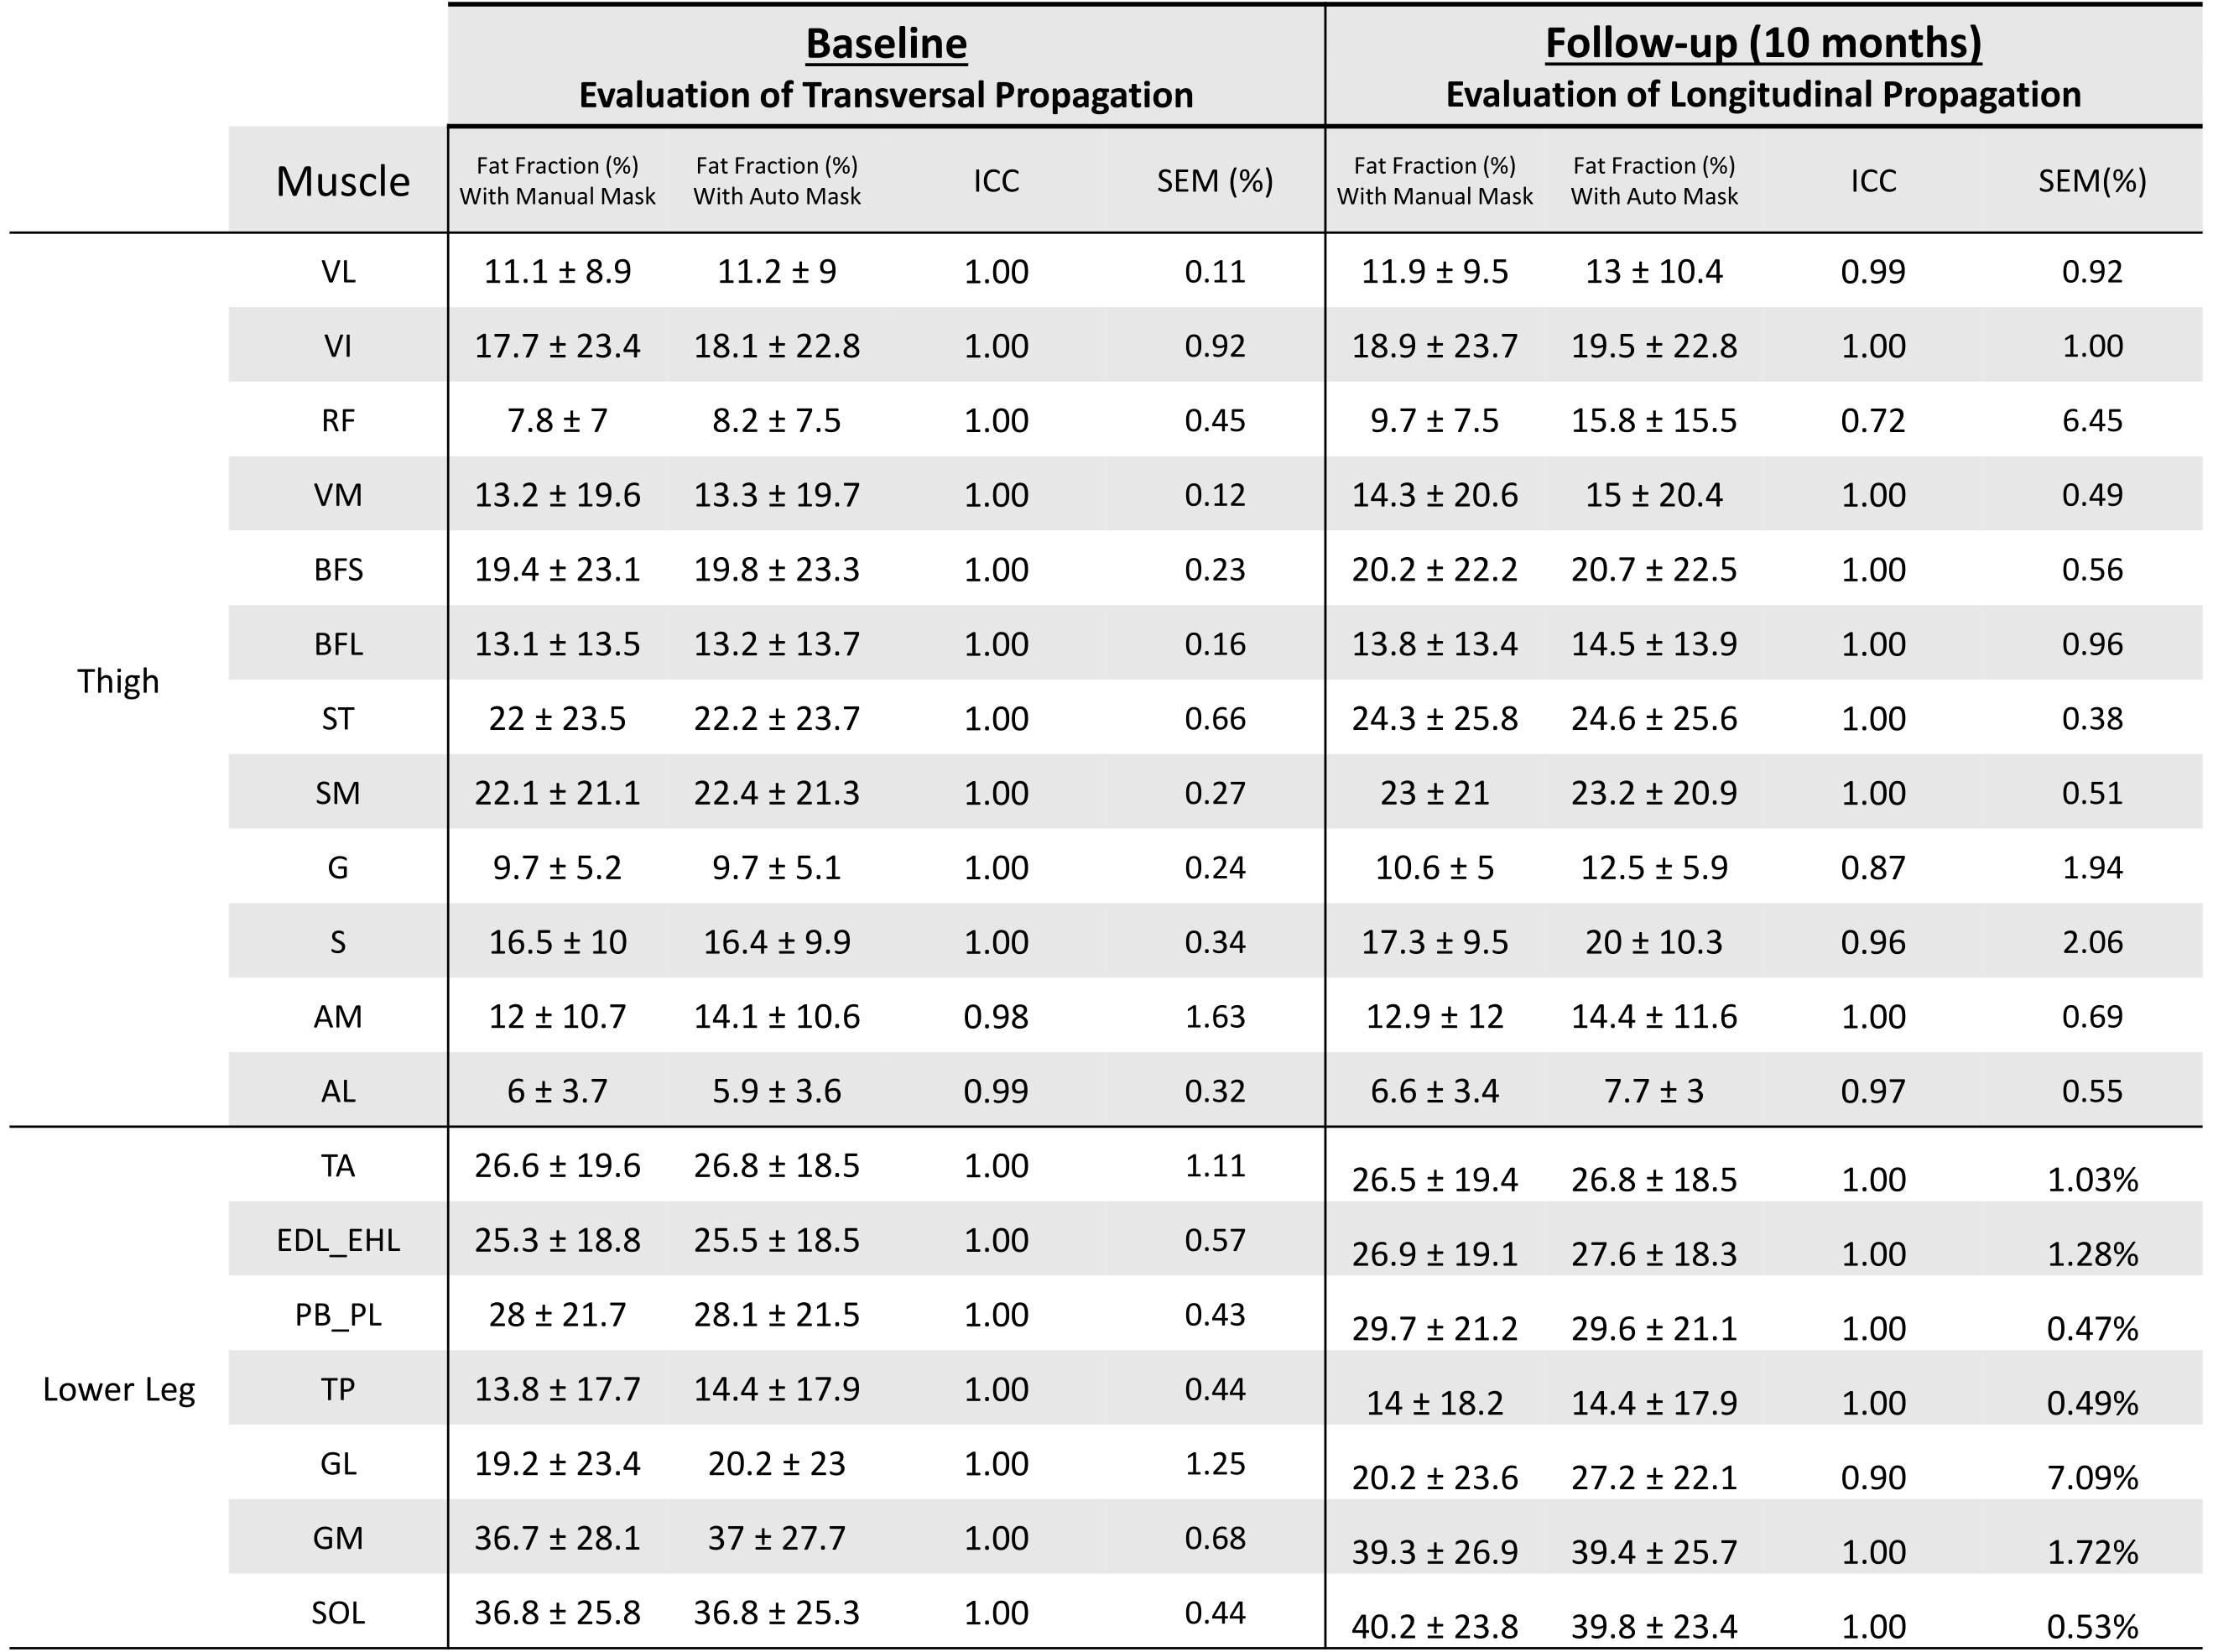
Over a period of 10 months, we acquired two MRI datasets of the thighs and lower legs in 10 muscular dystrophy patients using a 3T MR system (Siemens) and spine/phased array coil combination. We employed a 3D DIXON sequence (FOV 256x192mm, voxel size 1x1x5mm, number slices: 32) to obtain images from which both fat (F) and water images (W) were generated and a fat fraction map was calculated voxel-wise as F/(F+W). Muscles contours of twenty muscles (Fig. 1) were manually delineated on axial slices and considered as ground truth for the comparative analysis. For each muscle, fat fraction (FF) was calculated as the average over all voxels on the fat fraction map.
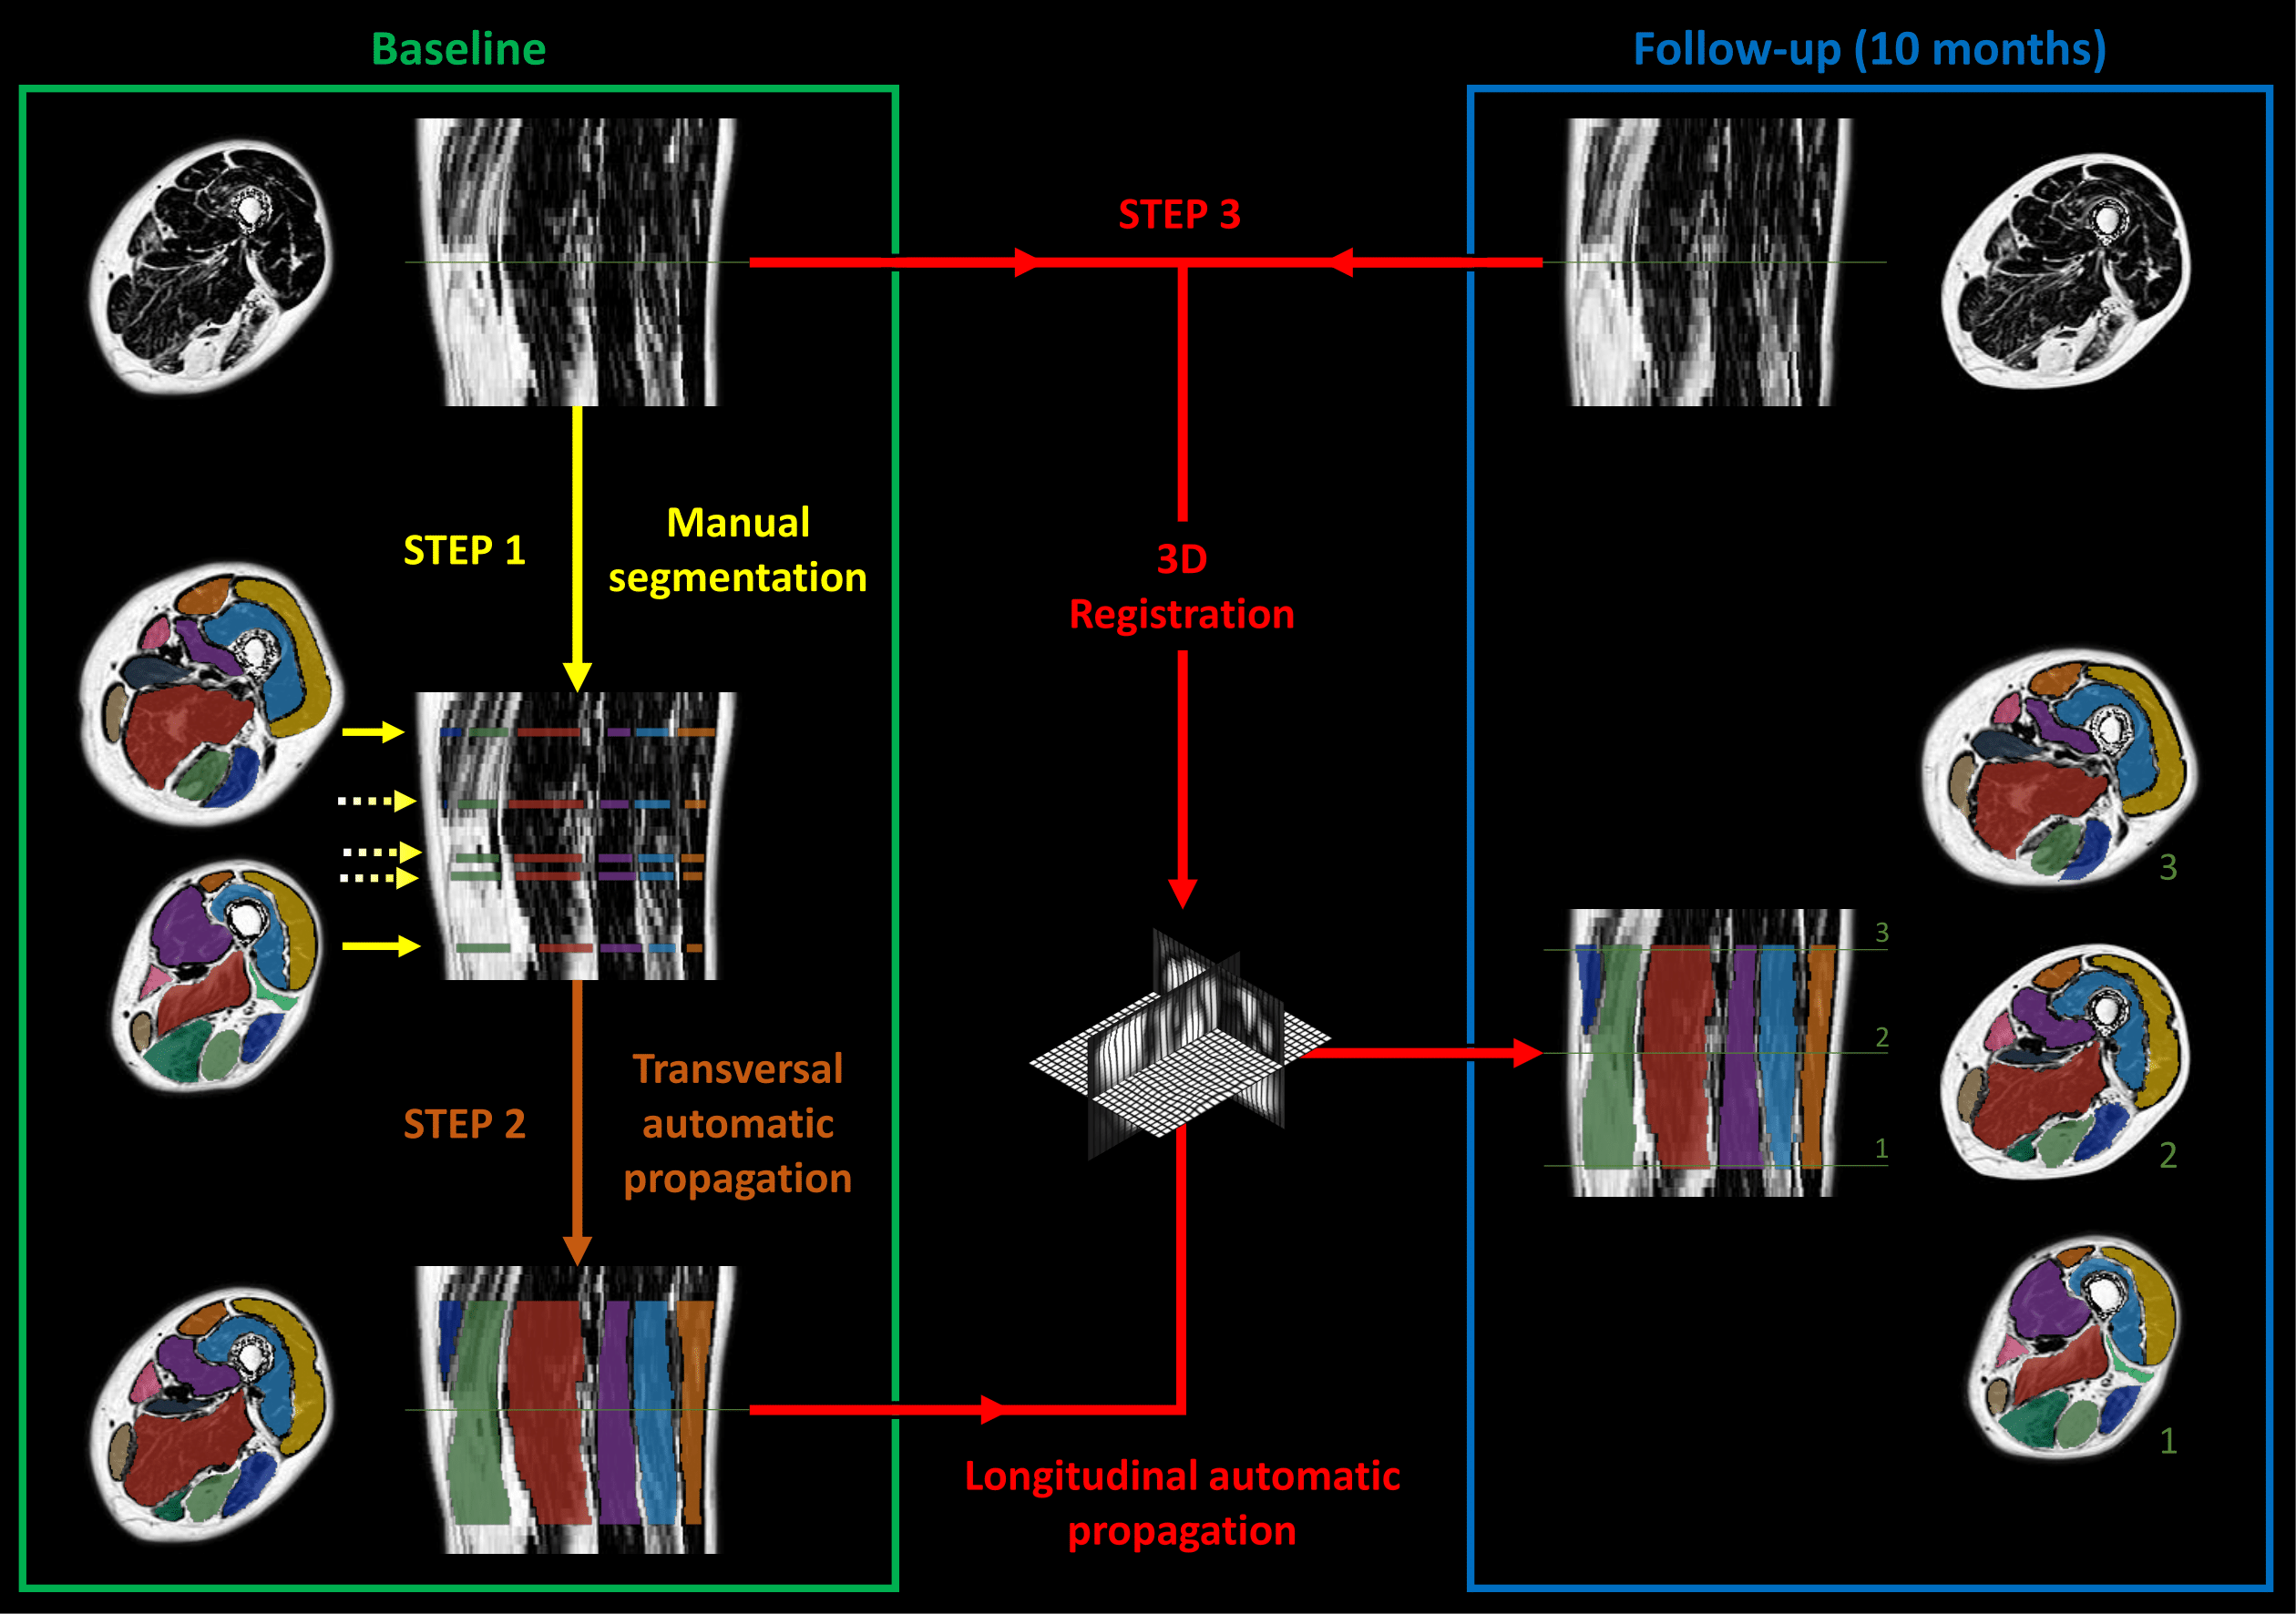
At baseline, we first manually segmented the slices bordering the 3D region of interest together with three additional slices for which a muscle was appearing or disappearing (Fig.2.Step1). These segmentations are then transversally propagated to all the slices of the 3D region of interest using a method based on several 2D non-linear registration approaches11 (Fig.2.Step2). Subsequently, we performed a 3D non-linear SyN registration (Symmetric diffeomorphic Normalization implemented in the ANTs library13) between the baseline and follow-up DIXON images. The deformation field obtained from the registration process was then used to warp the 3D segmentation resulting from the transverse propagation at baseline to follow-up (Fig.2.Step3).
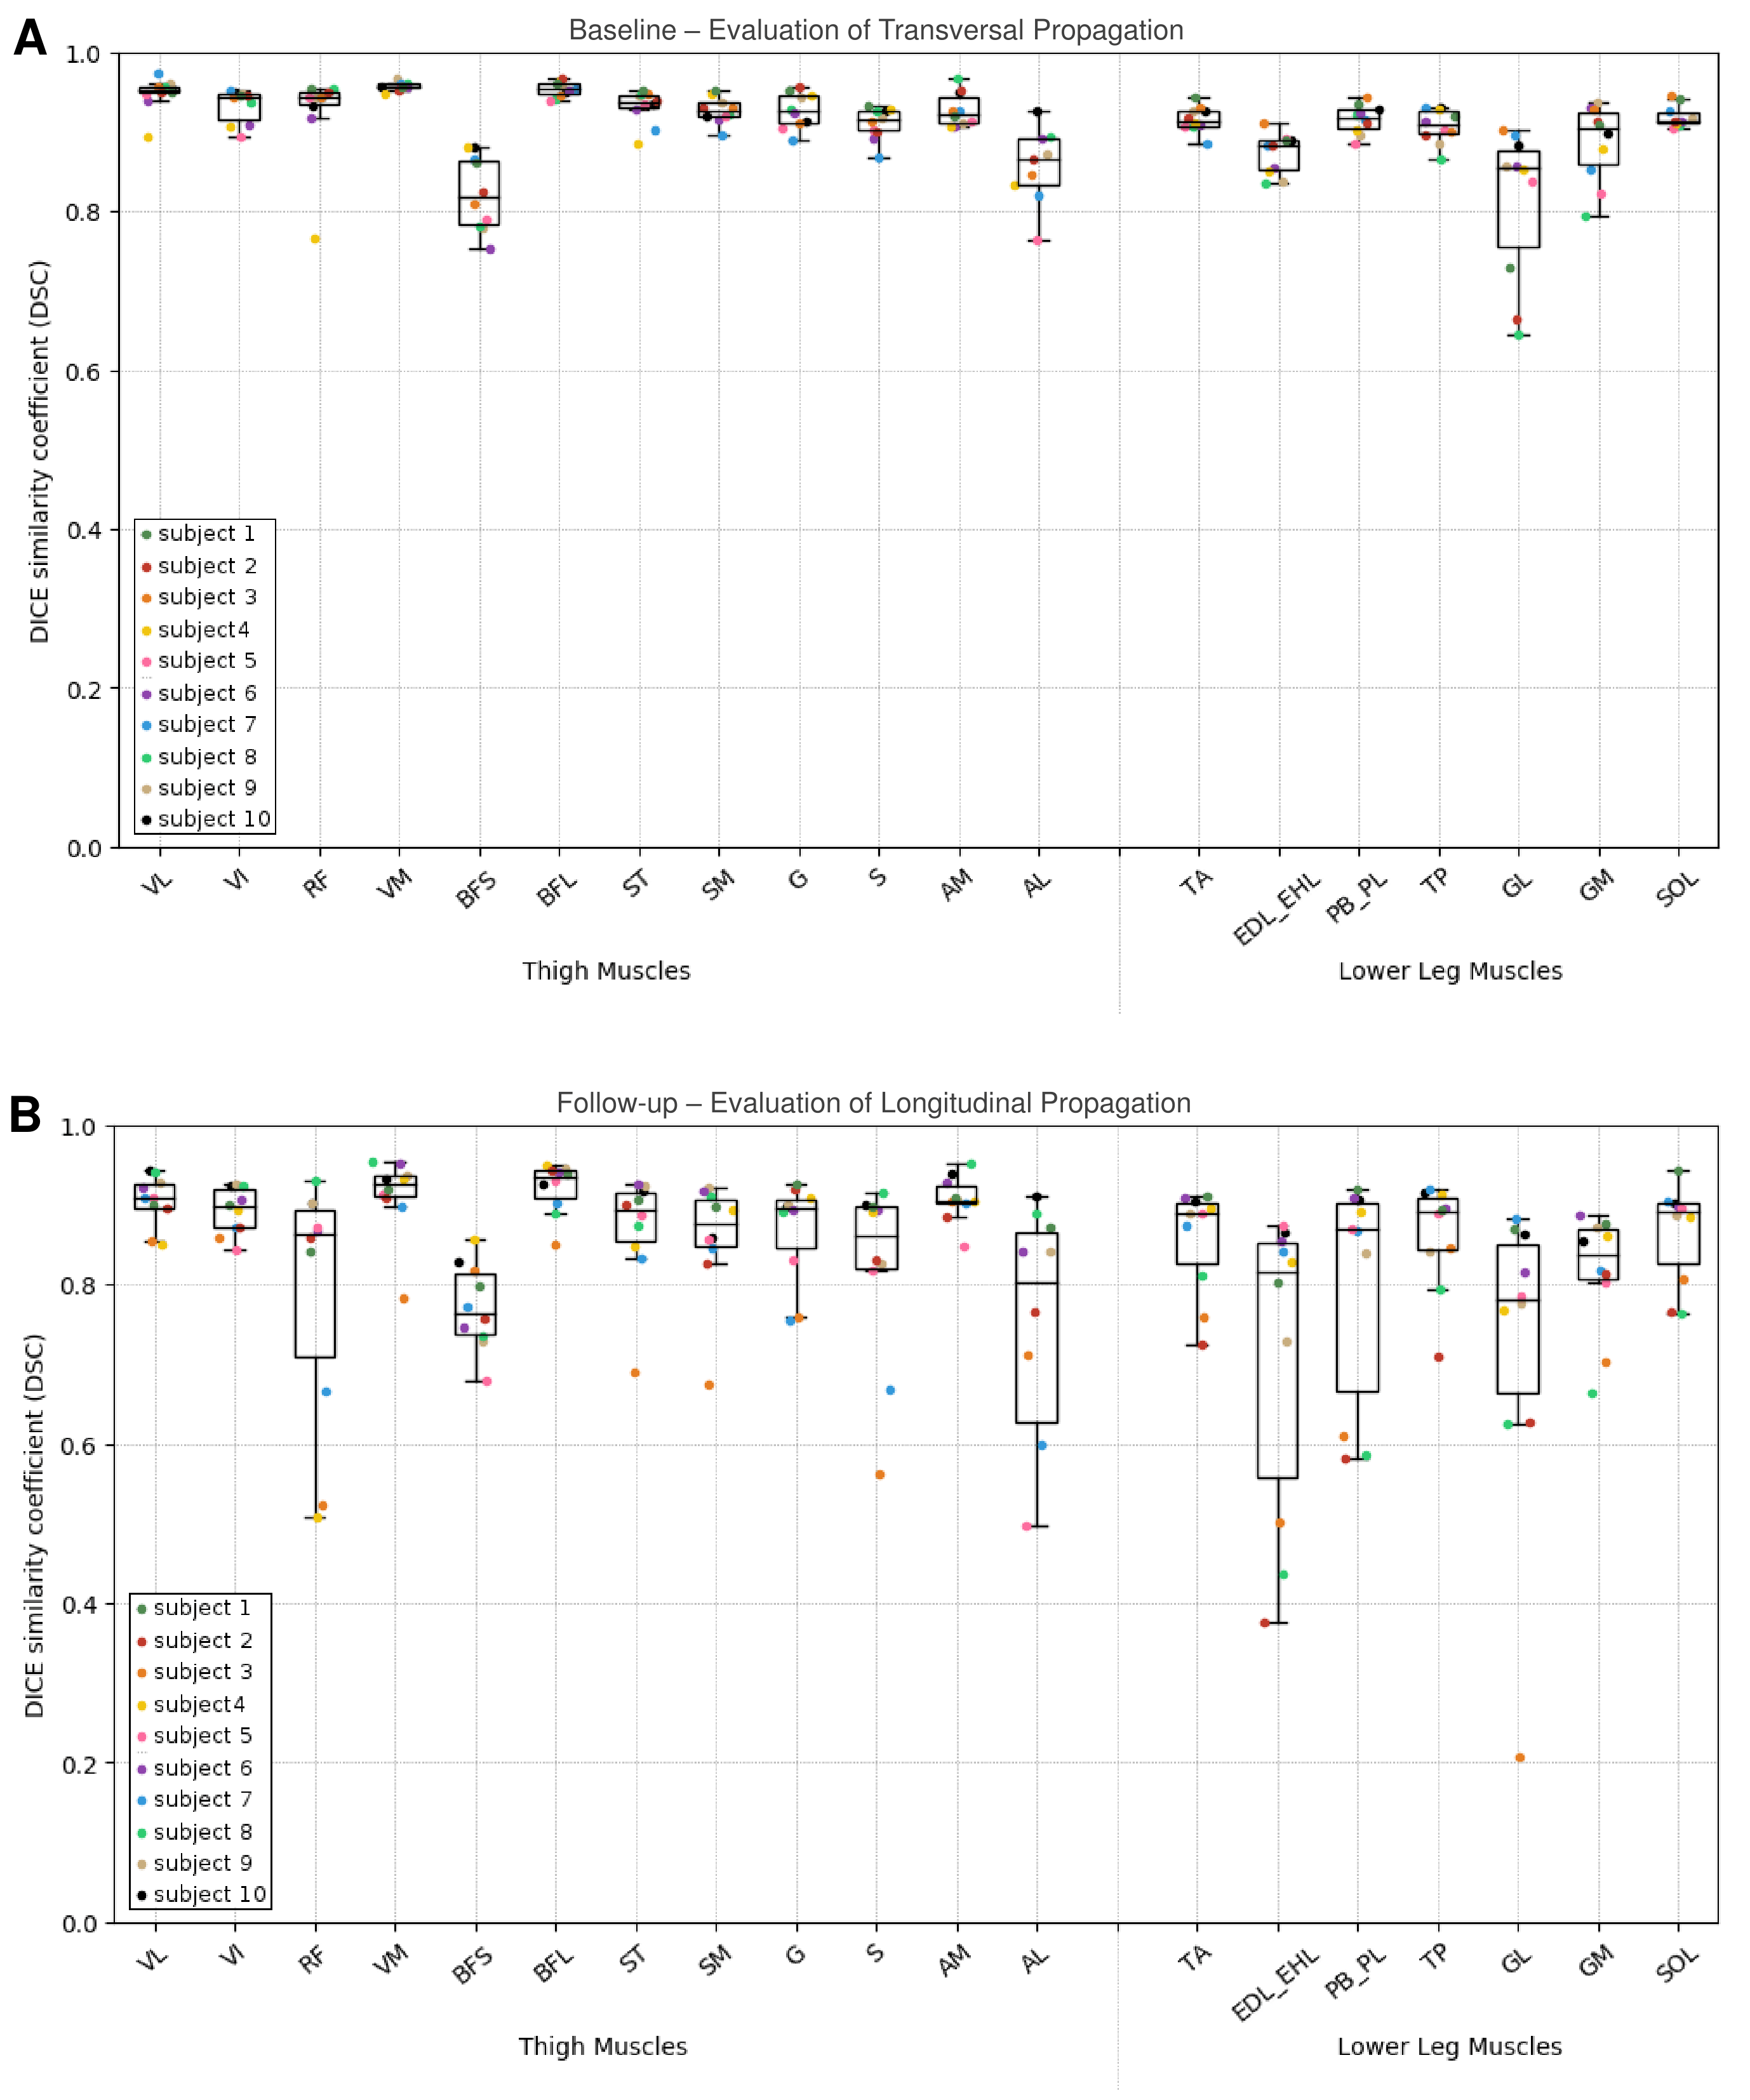
We assessed our automatic segmentations using the DICE similarity coefficient (DSC14). Furthermore, FF quantification from manual and automated segmentation were compared using intra-class correlation coefficient (ICC) with a 2, 1 formula15 and standard error of measurement (SEM). Bland-Altman plots were performed to analyze the agreement of FF values determined with the two latter methods of segmentation16.
RESULTS
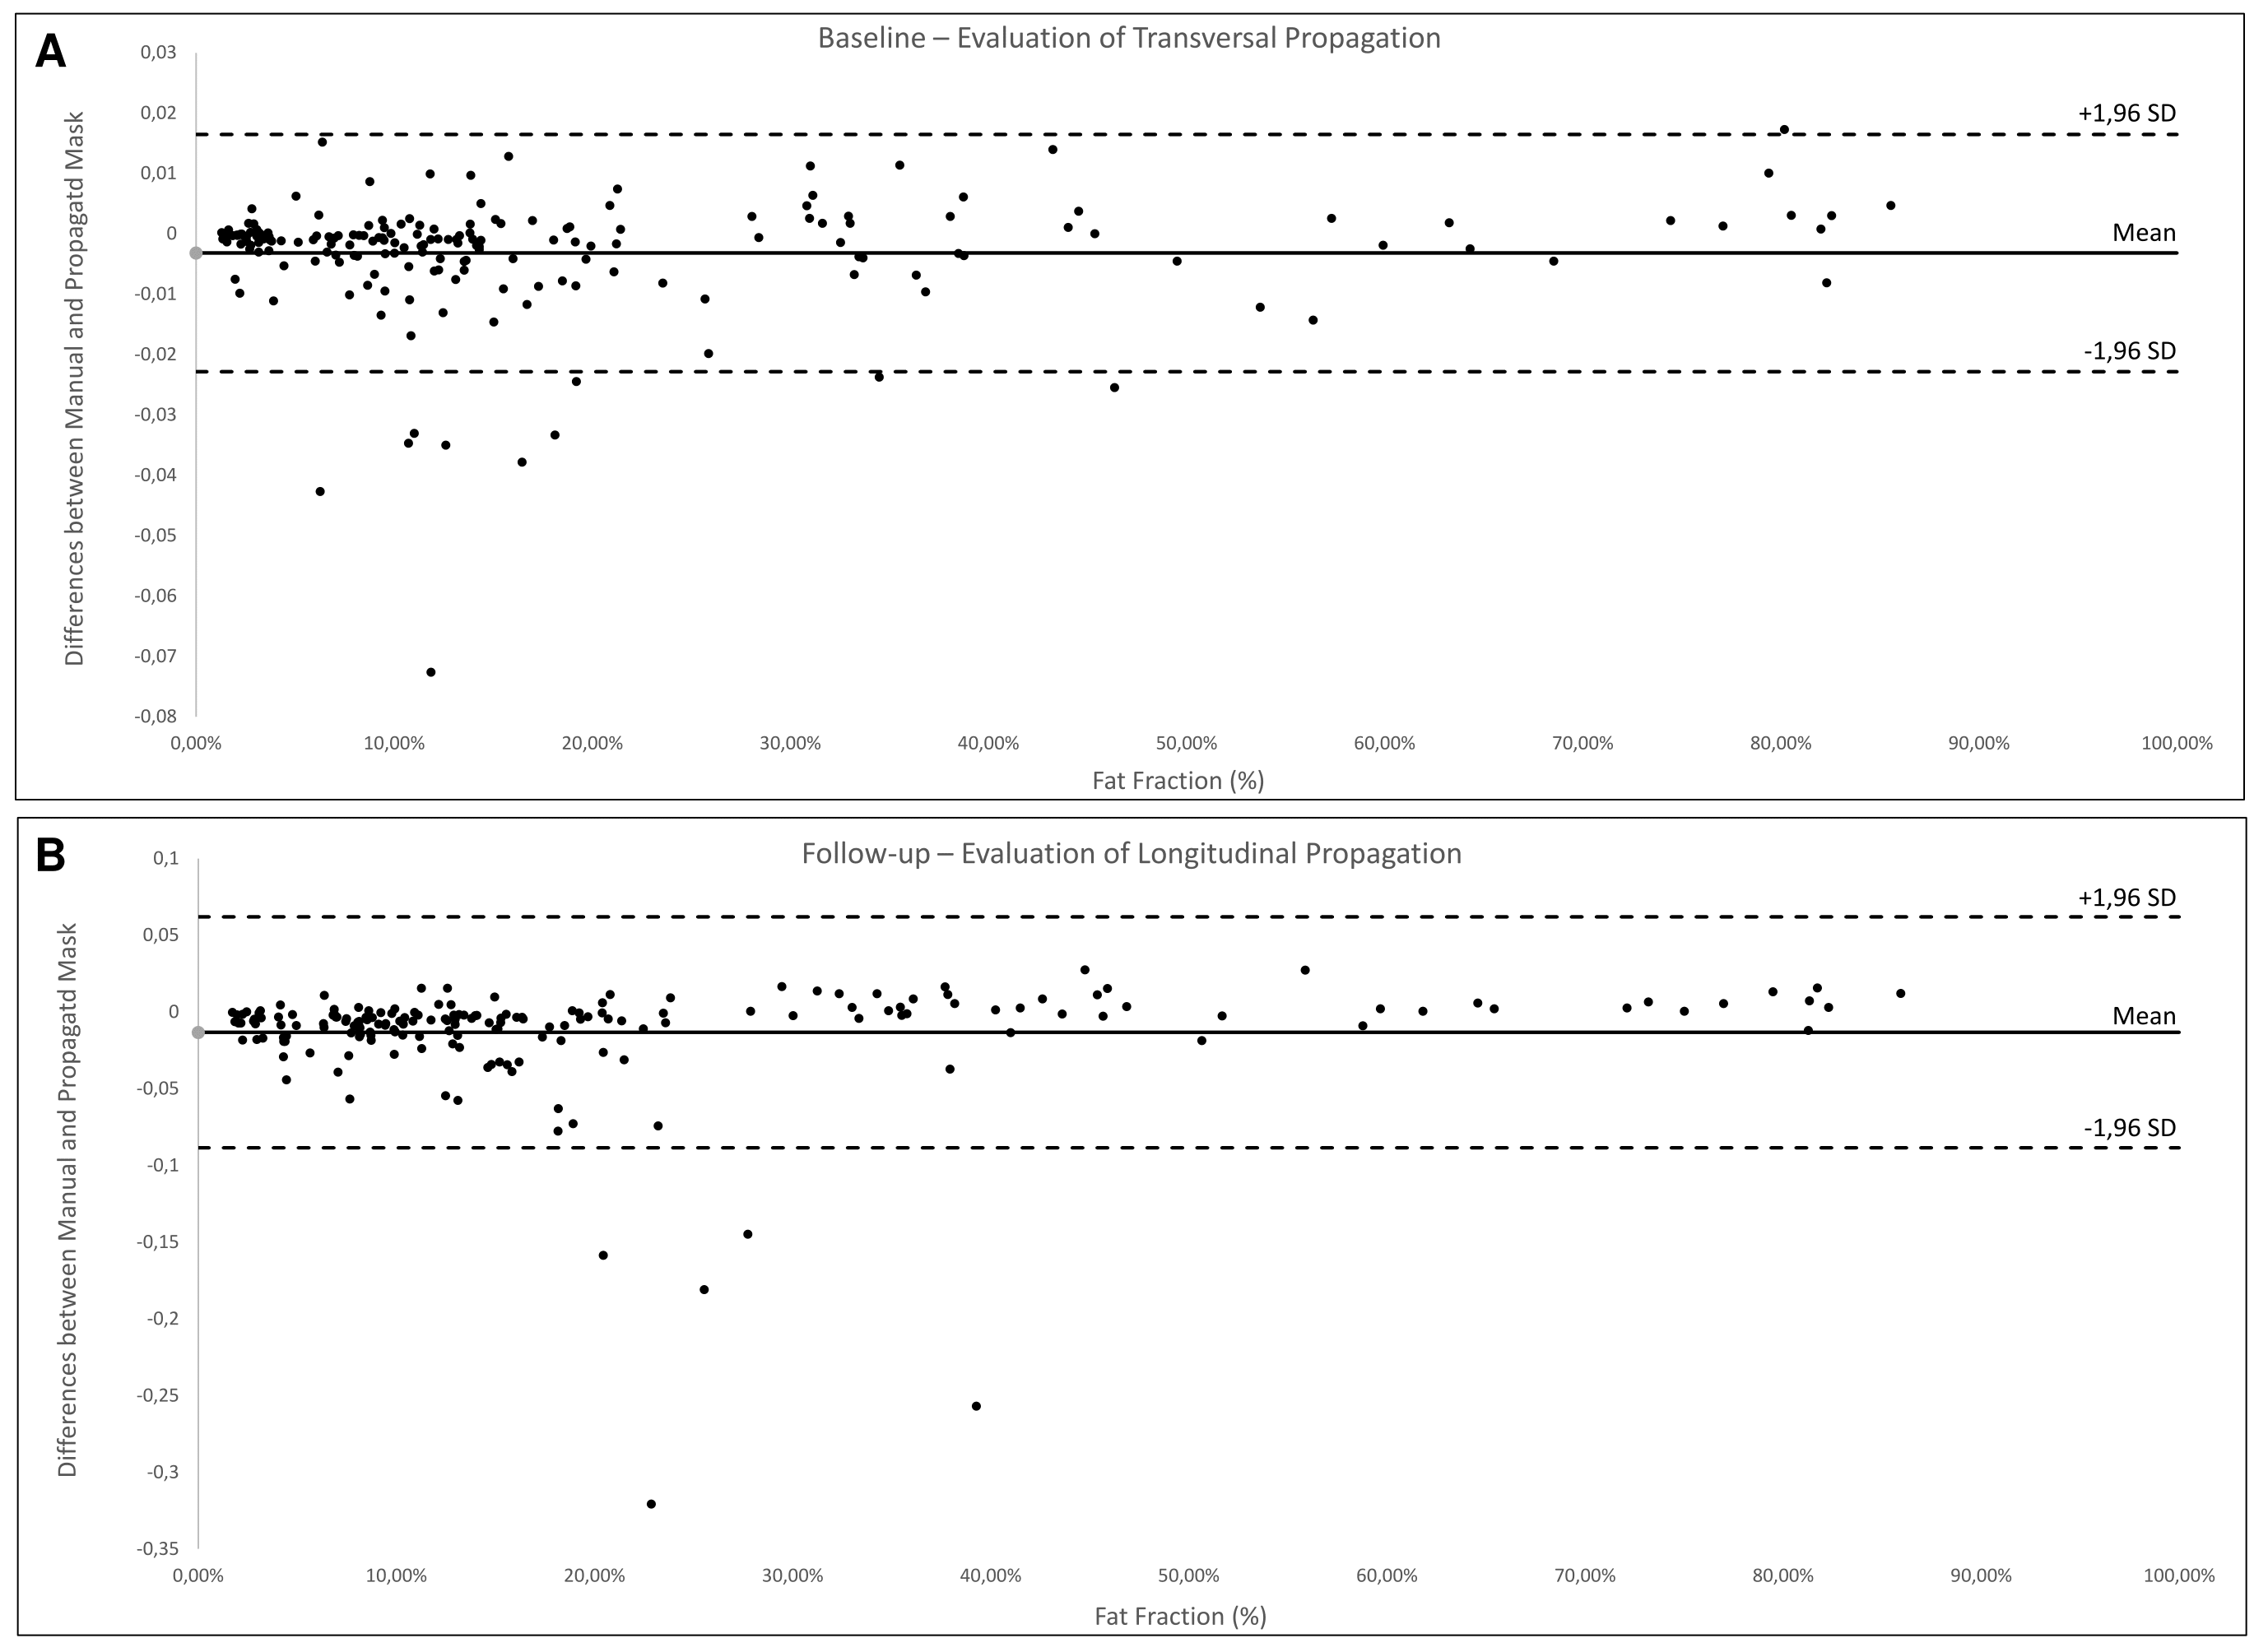
The DSC obtained for each muscle are reported in Fig. 3 for the transversal propagation at baseline (A) and the longitudinal propagation at follow-up (B). The average DSC values ranged from 0.81 to 0.96 for the transversal propagation and from 0.71 to 0.92 for the longitudinal propagation. The mean FF values obtained for each muscle with the manual and the automatic segmentations and the associated ICC and SEM are reported in Fig. 4. These results illustrate an excellent reliability for the transversal propagation (ICC > 0.98) and for almost all muscles for the longitudinal propagation (ICC > 0.72). Considering the Bland-Altman plots (Fig. 5), the bias [limits of agreement] were -0.3% [-2.2%, 1.6%] for the transversal propagation (A) and -1.3% [-8.8%, 6.2%] for the longitudinal propagation (B).DISCUSSION
Our semi-automated method allowed a reliable segmentation of each individual leg muscle on DIXON images using only 5 manually-segmented slices as seed regions which were transversally and longitudinally propagated to the remaining 43 slices for both the baseline and follow-up datasets. We showed that our propagated segmentation was accurate with DSCs similar to those previously reported7-11. Furthermore, we identified that our segmentation pipeline performed less for small muscles showing large anatomical variation along the leg and that the accuracy of the longitudinal propagation was affected by the accuracy of the transversal propagation. The reproducibility between FF from the manual and semi-automatic segmentation was high which is of utmost importance in the clinical field.CONCLUSION
We designed a semi-automatic segmentation pipeline of individual muscles in patient MR images using propagation methods for both baseline and follow-up datasets. We reduced the required time for manual segmentation by 90%. This minimal manual segmentation stage, simple to set up in clinical routine, allows control by the expert. Considering the FF values, we illustrated a highly accurate follow-up tool for neuromuscular disorders which is of great importance for clinical trials.Acknowledgements
The authors thank all the subjects who participated in the present study. This study was supported by the EU Seventh Framework Programme (#305697) on DM1 (OPTIMISTIC).References
1. B. H. Janssen et al., “Distinct Disease Phases in Muscles of Facioscapulohumeral Dystrophy Patients Identified by MR Detected Fat Infiltration,” PLoS ONE, vol. 9, no. 1, p. e85416, Jan. 2014.
2. B. H. Wokke et al., “Quantitative MRI and strength measurements in the assessment of muscle quality in Duchenne muscular dystrophy,” Neuromuscul. Disord., vol. 24, no. 5, pp. 409–416, May 2014.
3. J. M. Morrow et al., “MRI biomarker assessment of neuromuscular disease progression: a prospective observational cohort study,” Lancet Neurol., vol. 15, no. 1, pp. 65–77, Jan. 2016.
4. I. Arpan et al., “Examination of effects of corticosteroids on skeletal muscles of boys with DMD using MRI and MRS,” Neurology, vol. 83, no. 11, pp. 974–980, Sep. 2014.
5. B. Janssen, N. Voet, A. Geurts, B. van Engelen, and A. Heerschap, “Quantitative MRI reveals decelerated fatty infiltration in muscles of active FSHD patients,” Neurology, vol. 86, no. 18, pp. 1700–1707, May 2016.
6. Y. Barnouin et al., “Manual segmentation of individual muscles of the quadriceps femoris using MRI: a reappraisal,” J. Magn. Reson. Imaging JMRI, vol. 40, no. 1, pp. 239–247, Jul. 2014.
7. P. Y. Baudin, N. Azzabou, P. G. Carlier, and N. Paragios, “Prior knowledge, random walks and human skeletal muscle segmentation,” Med. Image Comput. Comput.-Assist. Interv. MICCAI Int. Conf. Med. Image Comput. Comput.-Assist. Interv., vol. 15, no. Pt 1, pp. 569–576, 2012.
8. A. Karlsson et al., “Automatic and quantitative assessment of regional muscle volume by multi-atlas segmentation using whole-body water-fat MRI: Automated Muscle Tissue Quantification,” J. Magn. Reson. Imaging, vol. 41, no. 6, pp. 1558–1569, Jun. 2015.
9. A. Le Troter et al., “Volume measurements of individual muscles in human quadriceps femoris using atlas-based segmentation approaches,” Magma N. Y. N, vol. 29, no. 2, pp. 245–257, Apr. 2016.
10. B. Gilles, de B. Charles, C. Pierre, M. Grégoire, B. Olivier, and V. Magalie, “Automatic segmentation for volume quantification of quadriceps muscle head: a longitudinal study in athletes enrolled in extreme mountain ultramarathon,” ISMRM, 2016.
11. A. Ogier, M. Sdika, A. Foure, A. Le Troter, and D. Bendahan, “Individual muscle segmentation in MR images: A 3D propagation through 2D non-linear registration approaches,” EMBC, 2017, pp. 317–320.
12. F. Fatehi et al., “Long-term follow-up of MRI changes in thigh muscles of patients with Facioscapulohumeral dystrophy: A quantitative study,” PLOS ONE, vol. 12, no. 8, p. e0183825, Aug. 2017.
13. B. B. Avants, C. L. Epstein, M. Grossman, and J. C. Gee, “Symmetric diffeomorphic image registration with cross-correlation: evaluating automated labeling of elderly and neurodegenerative brain,” Med. Image Anal., vol. 12, no. 1, pp. 26–41, Feb. 2008.
14. K. H. Zou et al., “Statistical validation of image segmentation quality based on a spatial overlap index,” Acad. Radiol., vol. 11, no. 2, pp. 178–189, Feb. 2004.
15. P. E. Shrout and J. L. Fleiss, “Intraclass correlations: uses in assessing rater reliability,” Psychol. Bull., vol. 86, no. 2, pp. 420–428, Mar. 1979.
16. J. M. Bland and D. G. Altman, “Applying the right statistics: analyses of measurement studies,” Ultrasound Obstet. Gynecol. Off. J. Int. Soc. Ultrasound Obstet. Gynecol., vol. 22, no. 1, pp. 85–93, Jul. 2003.
Figures