5068
Assessment for Lumbar Paraspinal Muscle Activation Before and After Exercises Using BOLD and T2-Mapping Imaging1Department of Medical Imaging,the First Affiliated Hospital of Kunming Medical University Yunnan, Kunming, China, 2Philips Healthcare, Shanghai, China
Synopsis
BOLD and T2-mapping might serve as noninvasive methods to evaluate the muscle activation of paraspinal muscles, thus providing deeper insights into muscle physiology. This has made possible the evaluation of the efficacy of early clinical exercise therapy for patients with lower-back pain.
INTRODUCTION
This study aimed to investigate the application of muscle functional magnetic resonance imaging [blood oxygen level–dependent (BOLD) imaging and T2-mapping] for monitoring the activation of lumbar paraspinal muscles before and after exercise.METHODS
The ethics committee of the local hospital approved this study. BOLD and T2-mapping of paraspinal muscles were performed in 50 healthy young volunteers(25 males and 25 females,24.81 ± 2.29 years, with an age range of 19–29 years) before and after upper-body extension exercises. All MRI scans were conducted on the 3.0T whole-body MR scanner (Achieva 3.0T TX, Philips Healthcare, Best, The Netherlands) using a dedicated 16ch Torso XL coil. Cross-sectional area (CSA), R2*, and T2 value were measured in various lower-back muscle anatomical regions before and after exercise and compared. SPSS22.0 statistical software was used to analyze all the data.RESULTS
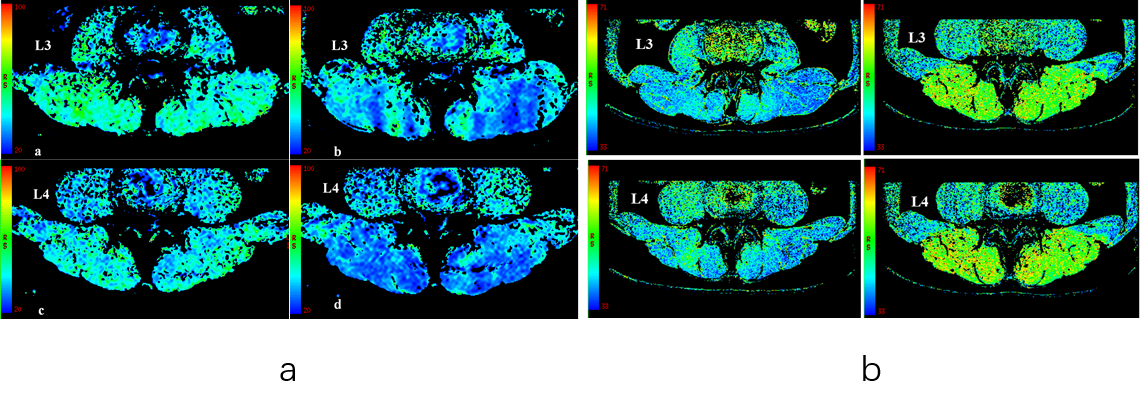
Pre- and post-exercise comparisons of the CSA, R2*, and T2 values with respect to different gender, L3–L4 spinal levels, and left and right sides are shown in Figures 1. A typical color-coded R2*, T2 map obtained before and after exercise were shown in figure 2. The post-exercise CSA and T2 values were higher than those of the pre-exercise session in the three lower-back muscles (iliocostalis, longissimus, and multifidus). However, the R2* of the three lower-back muscles reduced significantly after exercise. A significant difference in the ΔR2*, ΔCSA, and ΔT2 values of iliocostalis was found between males and females. No statistically significant difference was observed in the ΔR2*, ΔCSA, and ΔT2 values of lower-back muscles between L3 and L4 levels, or between left and right values. The total ΔCSA of iliocostalis was higher than that of the multifidus and longissimus. However, no significant differences were observed in the total ΔR2* and ΔT2 values among the three lower-back muscles. The total ΔCSA in the paraspinal muscles was significantly and negatively related to ΔR2* and positively related to ΔT2.DISCUSSION
This study examined the exercise-induced changes in the muscle area, that is, muscle activation with equal exercise intensity in different lower-back muscles. Additionally, the lower-back muscle CSAs were measured based on the T2-weighted MRI data. With this approach, new insights were obtained into muscle activation of lower-back muscles after exercise by exploring the differences and associations between the parameters of muscle fMRI (BOLD and T2-mapping) and traditional classical muscle morphology evaluation (CSA).
Analyzing the correlation between total ΔCSA and total ΔR2* or total ΔT2 value, the two results indicated a positive relationship among the three variables, but the correlation was not significant. This was because each parameter represented different complex biological information. CSA was the overall change in muscle morphology after exercise. R2* and T2 values might be affected by muscle microcirculatory blood perfusion, blood volume, water content of cell gap, and many other biological factors(1); however, the specific changes in each factor need further study.
CONCLUSION
BOLD and T2-mapping are feasible for noninvasive indirect assessment of muscle activation in lumbar paraspinal muscles before and after exercise.Acknowledgements
No acknowledgement found.References
(1) Hiepe P, Gussew A, Rzanny R, et al. Interrelations of muscle functional MRI, diffusion-weighted MRI and (31) P-MRS in exercised lower back muscles[J]. NMR Biomed. 2014; 27(8): 958-970.Figures