5067
Skeletal muscle tissue characterization of Duchenne muscular dystrophy patients by 1H- and 23Na-MRI1NMR Laboratory, Institute of Myology, Paris, France, 2Institute of Radiology, University Hospital Erlangen, Friedrich-Alexander-Universität Erlangen-Nürnberg (FAU), Erlangen, Germany, 3Department of Pediatrics, Division Neuropediatrics, Friedrich-Alexander-Universität Erlangen-Nürnberg (FAU), Erlangen, Germany
Synopsis
Duchenne muscular dystrophy (DMD) is a hereditary neuromuscular disease leading to progressive muscle wasting. As there is a need to identify NMR variables as potential early sensitive indicators of dystrophic muscle response to treatment, we evaluated the sensitivity of 23Na NMR in DMD in comparison to the commonly used water T2 and fat fraction. Sodium anomalies seemed to be systematically present and precede water T2 increases and fatty degenerative changes, also in muscles that were relatively spared. Although still limited in the small number of subjects, the data supports that 23Na could be used to characterize early dystrophic muscle alteration.
Introduction
Duchenne muscular dystrophy (DMD) is a hereditary neuromuscular disease caused by a mutation in the dystrophin gene leading to progressive muscle wasting during childhood and loss of ambulation by around 12 years 1, 2. This muscle destruction is associated with inflammation, ionic homeostasis dysregulation, and exhaustion of regenerative capacities which leads ultimately to replacement of muscle by fatty and fibrotic tissue. Quantitative MRI has been used to describe the natural history of the disease and has been suggested as an outcome measure in clinical trials for DMD. Most of these studies evaluated the fat fraction and the 1H transverse relaxation time (water T2) to assess disease severity and progression 3. Both methods have their limitations: water T2 changes are non-specific events and are influenced by the usually prescribed steroid therapy and the fatty degenerative changes, while picking up the extreme phenotypic variability, have a poor predictive value. Thus, there is a need to identify other NMR variables that may serve as potential early sensitive indicators of response to treatment. 23Na MRI has been previously proposed for follow up of DMD patients as they show a muscular Na+ overload 4. We here evaluated the sensitivity of 23Na MRI to act as an early biomarker in DMD in comparison to water T2 and fat fraction.Materials & Methods
MRI of the right calf was performed in eight DMD patients (age 10.2±3.1 years) and four age-matched controls (age 11.0±2.4 years) on a 3T whole-body MR system (Magnetom Skyra, Siemens Healthcare). A 15-channel quadrature knee coil (Siemens) was used for 1H MRI and a single-tuned (23Na) volume knee coil (Stark Contrast) and NaCl references tubes for 23Na MRI. For water T2 determination a multi-slice-multi-echo (MSME) sequence was acquired with the following parameters: TR 3000ms, 32 echoes with TEs from 9.5ms to 304, five slices with a 1.4x1.4mm2 resolution, Tacqu 3min41sec. Water T2 values were calculated based on a tri-exponential fitting procedure 6. Fat fraction (FF) was measured using a 3D 3-pt DIXON method: TR 10ms, TEs 2.75/3.95/5.15ms, FA 3°, 64 slices with a 1.3x1.3mm2 resolution, total Tacqu 3min12sec. Total tissue sodium concentration (TSC) was derived from an density-adapted 3D-radial UTE sequence acquired with the following parameters 5: TE/TR 0.3/50ms, FA 80°, resolution 3x3x15mm3, 8264 projections, Tacqu 6min53sec. An inversion-recovery (IR) sequence was used to reduce 23Na-signal originating from unrestricted environments to achieve an intracellular weighted sodium signal (ICW) 7: TE/TR 0.3/124ms, TI 34ms, FA 90°, resolution 4x4x20mm3, 4760 projections, Tacqu 9min50sec. ROIs were drawn on the gastrocnemius medialis (Gas.m.), soleus (Sol) and tibialis anterior (TA) muscles.Results
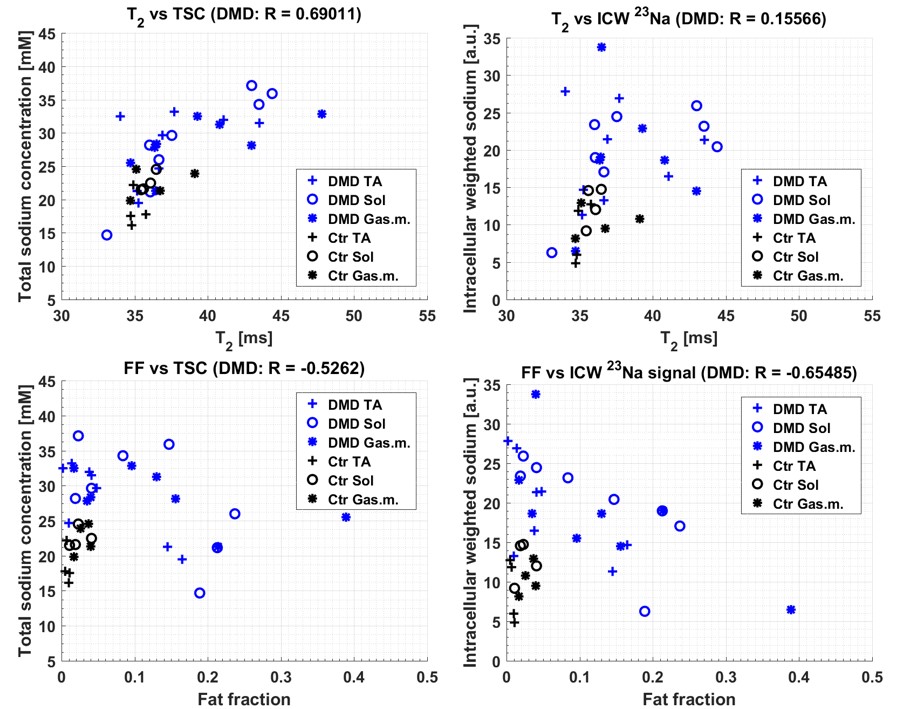
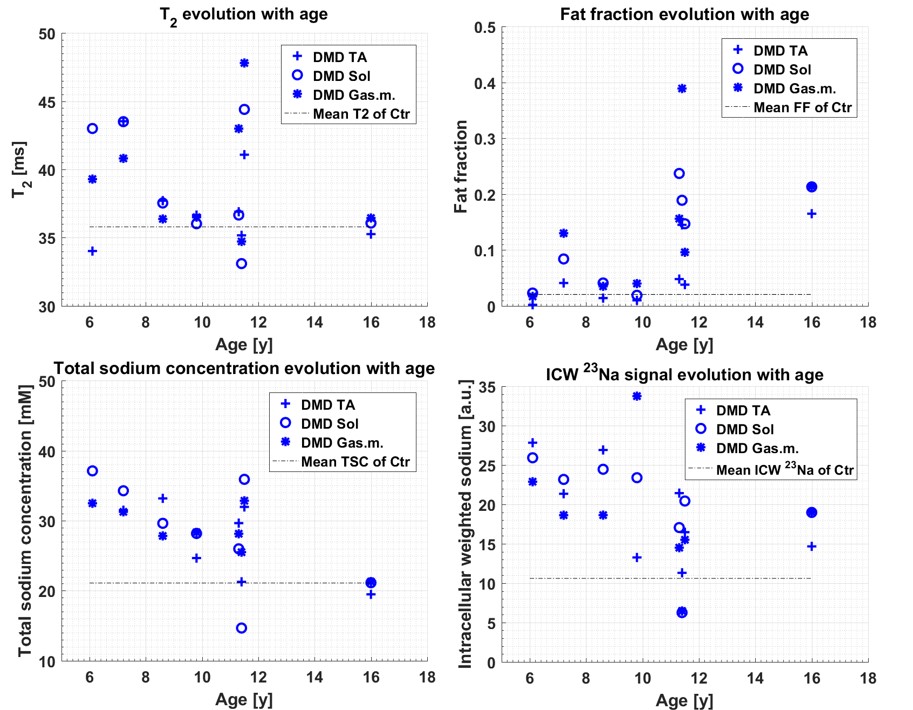
Mean water T2 and FF were elevated in DMD patients compared to controls (38.6±3.9ms vs 35.1±1.2ms and 0.104±0.097 vs 0.021±0.013, p=0.028 and p=0.006, respectively). Patients showed an increased TSC of 28.3±5.6mM and an elevated ICW of 19.3±6.5a.u. (controls: 21.1±2.8mM TSC and 10.6±3.2 ICW, p=0.0003, p=0.0001). As depicted by figure 1, water T2 correlated positively with TSC (R=0.69) in DMD patients. While the FF correlated for DMD patients negatively with TSC (R=-0.526) and ICW (R=-0.655), the calculated muscle sodium concentration and ICW were elevated irrespectively of the FF. In addition, partial volume effects may lower the measured TSC and ICW in particular in patients with high FF, since fat tissue has lower sodium concentrations than muscle tissue. This might also decrease the correlations between FF and TSC as well as FF and ICW, if the TSC and ICW values would be corrected for fat infiltration. Moreover, the 23Na indices are frequently abnormal in DMD even when water T2 or FF remained in the normal range. DMD patients at all ages exhibited abnormally elevated sodium indices, whereas FF increased with age and the water T2 fluctuated during the course of disease (see figure 2).Discussion & Conclusion
Our study provides an indication that 23Na MRI could offer a sensitive outcome measure to characterize dystrophic muscle alteration at a very early stage. Sodium anomalies seemed to be systematically present in patients with DMD compared to controls and precede fatty degenerative changes and maybe also water T2 increases. Also muscles that were relatively spared, such as the TA, showed increased TSC and ICW in all participating DMD patients. Although this study, which is still in progress, has currently its limitation in the small number of subjects, the data supports that 23Na MRI could serve as an early and sensitive biomarker in order to investigate ion channel leakage and membrane integrity.Acknowledgements
This project was supported by the Johannes and Frieda Marohn Foundation (to A.N. and R.T, 2016). We thank the Imaging Science Institute (Erlangen, Germany) for providing us with measurement time at the 3T MRI system.References
1. Hoffman EP, Brown RH Jr, Kunkel LM. Dystrophin: the protein product of the Duchenne muscular dystrophy locus. Cell 1987: 51(6):919-28.
2. Ryder S, Leadley RM, Armstrong N et al. The burden, epidemiology, costs and treatment for Duchenne muscular dystrophy: an evidence review. Orphanet J Rare Dis. 2017: 12(1):79.
3. Carlier PG, Marty B, Scheidegger O et al. Skeletal Muscle Quantitative Nuclear Magnetic Resonance Imaging and Spectroscopy as an Outcome Measure for Clinical Trials. J Neuromuscul Dis. 2016: 3(1):1-28.
4. Weber MA, Nagel AM, Wolf MB et al. Permanent muscular sodium overload and persistent muscle edema in Duchenne muscular dystrophy: a possible contributor of progressive muscle degeneration. J Neurol 2012: 259(11): 2385-2392.
5. Nagel AM, Laun FB, Weber MA, et al. Sodium MRI using a density-adapted 3D radial acquisition technique. MRM 2009: 62:1565–1573.
6. Azzabou N, Loureiro de Sousa P, Caldas E, et al. Validation of a generic approach to muscle water T2 determination at 3T in fat-infiltrated skeletal muscle. J MRI 2015: 41(3): 645-653.
7. Nagel AM, Amatteifo E, Lehmann-Horn F. et al. 3 Tesla Sodium Inversion Recovery Magnetic Resonance Imaging Allows for Improved Visualization of Intracellular Sodium Content Changes in Muscular Channelopathies. Invest Radiol 2011: 46(12):759-766.
Figures