5066
Quantitative water T2 mapping and 31P NMR spectroscopy to evaluate disease progression and activity in GNE myopathy patients1NMR Laboratory, Institute of Myology, Paris, France, 2NMR Laboratory, CEA, DRF, IBFJ, MIRCen, Paris, France, 3Consultants for Research in Imaging and Spectroscopy, Tournai, Belgium, 4Neuromuscular Physiology Laboratory, Institute of Myology, Paris, France, 55 I-Motion, Research Centre for Pediatric Neuromuscular Diseases, Armand Trousseau Hospital, Paris, France
Synopsis
GNE myopathy (GNEM) is a neuromuscular disorder, characterized by distal lower limb muscle atrophy known for the relative preservation of quadriceps muscles. Quantitative NMRI including fat fraction and water T2 mapping as well as 31P NMRS were performed in 10 GNEM patients and controls. In contrast to functional and strength tests, qNMRI and 31P NMRS could detect significant changes in FF and 31P NMRS indices such as pH over the course of 1 year. More interestingly, we could also demonstrate highly significant correlations between water T2 and the rate of transformation of muscle tissue into fat, demonstrating the strength of water T2 as an indicator of disease activity.
Purpose
GNE myopathy (GNEM) is a rare, progressive, hereditary neuromuscular disorder caused by mutations in the UDP-N-acetylglucosamine 2-epimerase/N-acetylmannosamine kinase gene (abbreviated as GNE), resulting in a disturbance of sialic acid production1. GNEM is characterized by distal lower limb muscle atrophy, gradually spreading more proximal2. The disorder is also known for the relative preservation of quadriceps muscles, with eventual fatty replacement of these muscles as well. Quantitative NMRI (qNMRI) is being used more and more in the evaluation of progression of neuromuscular disorders such as Duchenne muscular dystrophy. Besides a few studies reporting about isolated cases3, there have been no reports of qNMR results in GNEM. The purpose of this work was to determine if qNMRI measures such as fat fraction (FF) and water T2, as well as 31P NMRS indices proved to be valuable outcome measures in a one-year follow up study in GNEM.Methods
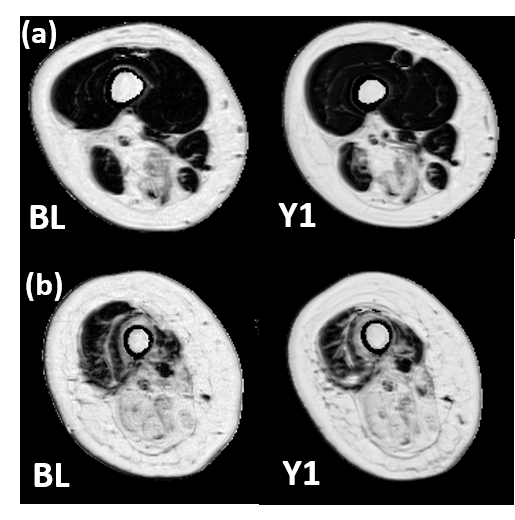
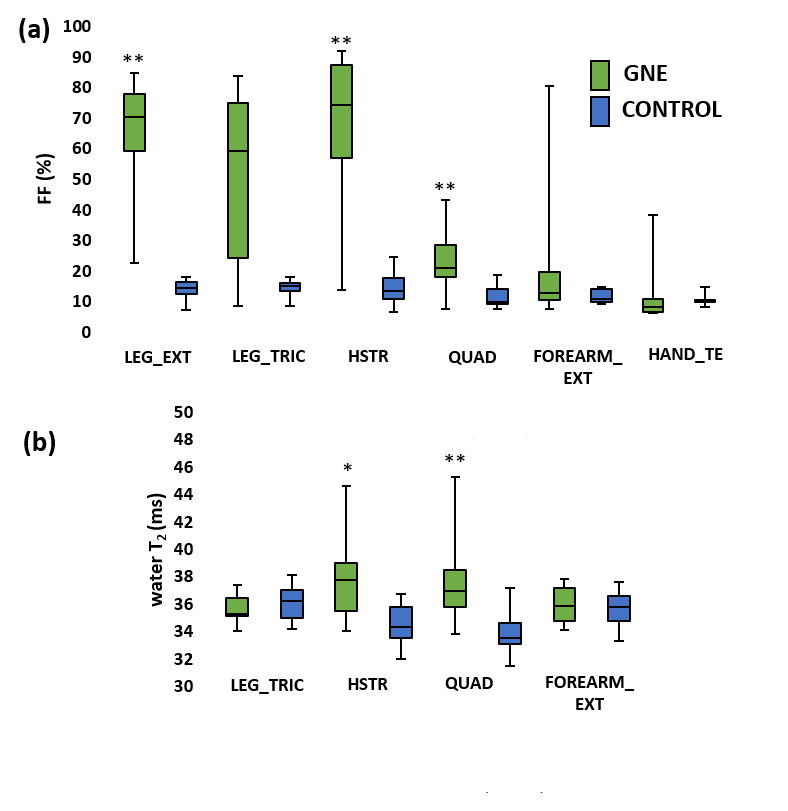
For this study, 10 GNEM patients (47 ± 15 years; 26-73 year age range; 5 male; 3 female patients were non-ambulant) and 14 healthy age-matched control subjects (51 ± 15 years; 22-65; 10 male) were recruited. All NMR data were acquired on a 3T Siemens Prisma system using a body matrix coil for qNMRI and a dual-tuned 31P-1H surface coil for 31P NMRS. Both 3pt-Dixon fat/water separation as well as multi-slice multi-echo (MSME) sequences were obtained in thigh (left and right side), the dominant forearm and hand muscles. B1 maps were also acquired for voxel sorting in the water T2 maps. Additionally, a non-localized 31P NMR spectrum was acquired in both right quadriceps and hamstring. FF values were derived from the Dixon images (Fig. 1); whereas water T2 values were extracted from a tri-exponential fit based on the MSME images4. Cross-sectional area (CSA) and contractile CSA (cCSA), which was defined as the real muscle mass calculated by CSA*(1-FF), were also derived. As an additional parameter, the fatty infiltration transformation rate (Rfat_change) was calculated as ΔFF/(100-FFBL) with FFBL defined as the FF at baseline visit. 31P NMRS data were processed with the AMARES algorithm from jMRUI5. Mann Whitney, Wilcoxon and Pearson correlation tests were performed for statistical analysis (P<0.05).Results
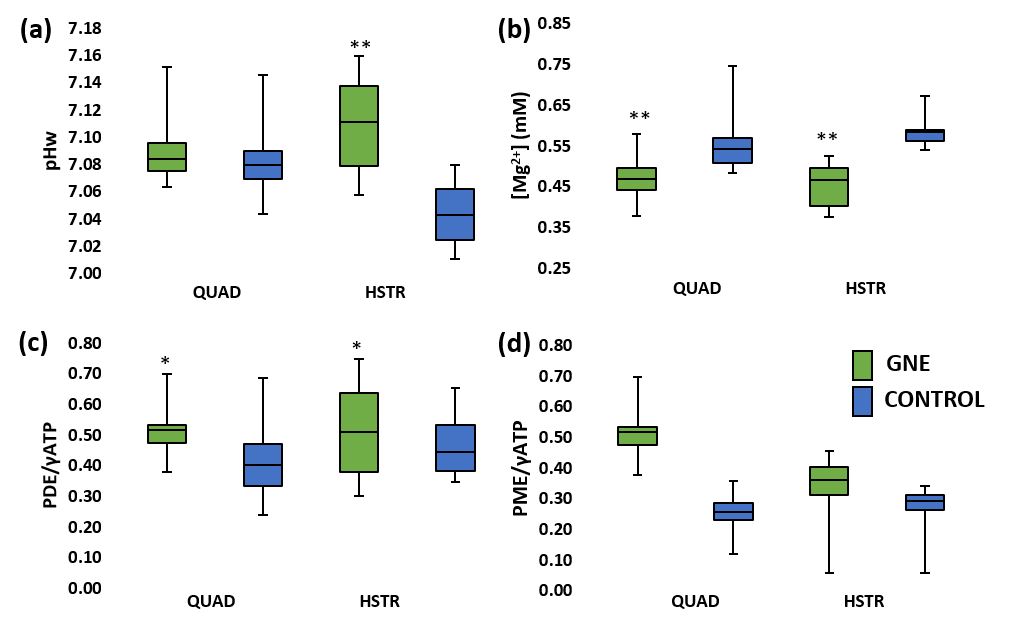
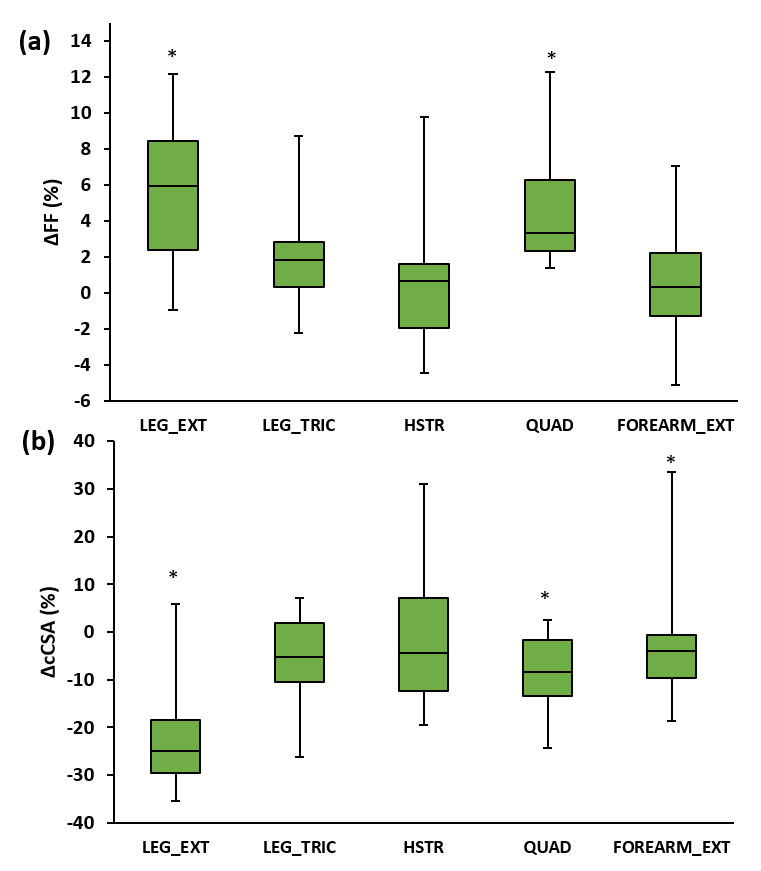
Next to significant changes in FF between patients and controls (Fig. 2a), significantly increased water T2 values (Fig. 2b) were also found as well as changes in various 31P NMRS indices in quadriceps and hamstring muscles (Fig. 3). Specifically, pH was elevated in hamstring as were the PDE levels in both muscle groups. Intramuscular Mg2+ was significantly decreased in both muscle groups. Whereas functional and strength tests could not demonstrate a change after 1 year follow-up7, quantitative NMRI/S could. FF was significantly increased in quadriceps and leg extensor muscles and corresponding cCSA values were significantly decreased after 1 year of disease progression (Fig. 4). In all other muscles, FF increased without statistical significance. cCSA also decreased significantly in forearm muscles. There were no changes in water T2 values over the course of 1 year. Few 31P NMRS indices changed over the course of 1 year with an increased pH in quadriceps as a notable exception. More interesting were the correlations between the variables reflecting disease progression and markers of disease activity. Namely, in quadriceps, the Rfat_change correlated highly significantly with the water T2 value (Fig. 5a). Water T2 correlated less but still highly significantly with the FF change while it did not correlate with ΔcCSA. ΔcCSA correlated better with 31P NMRS indices such as [Mg2+] (Fig. 5b) and Pi,tot/PCr. In, hamstring and other muscles, no such correlations were found.Discussion/Conclusion
This study illustrates that qNMRI and 31P NMRS could detect significant changes over a 1-year period in even a small group of GNEM patients while functional and strength tests could not. Although quadriceps muscle is known to be relatively preserved in this disorder, the fatty replacement in the muscle continues steadily. Moreover, in quadriceps muscles where the water T2 was increased, the muscles also showed a faster disease progression, as illustrated by the increased FF and the strong correlation with Rfat_change, an observation made earlier in adult Pompe patients8. The results obtained in this study confirm the ability of the use of water T2 as an outcome measure reflecting the disease activity. The changes found with 31P NMRS are promising as they could be additional indicators of disease activity. Future steps could be the implementation of this quantitative NMR protocol in a larger patient cohort as well as in clinical trials before and after a suitable treatment.Acknowledgements
No acknowledgement found.References
1. Eisenberg I, Avidan N, Potikha T, et al. UDP-N-acetylglucosamine 2-epimerase/N-acetylmannosamine kinase gene is mutated in recessive hereditary inclusion body myopathy. Nat Genet. 2001;29(1):83-87.
2. Nonaka I, Nogushi S, Nishino I, et al. Distal myopathy with rimmed vacuoles and hereditary inclusion body myopathy. Curr Neurol Neurosci Rep. 2005;5(1):61-65.
3. Tasca G, Ricci E, Monforte M, et al. Muscle imaging findings in GNE myopathy. J Neurol. 2012;259(7):1358-1365.
4. Azzabou N, Loureiro de Sousa P, Caldas E, et al. Validation of a generic approach to muscle water T2 determination at 3T in fat-infiltrated skeletal muscle. J Magn Reson Imaging. 2015;41(3):645-653.
5. Vanhamme L, van den Boogaart A, Van Huffel S. Improved method for accurate and efficient quantification of MRS data with use of prior knowledge. Magn Reson Imaging. 1997;129(1):35-43.
6. Wary C, Azzabou N, Giraudeau C, et al. Quantitative NMRI and NMRS identify augmented disease progression after loss of ambulation in forearms of boys with Duchenne muscular dystrophy. NMR Biomed. 2015;28(9):1150–1162.
7. Gidaro T, Le Louër J, Ollivier G, et al. ClinBio-GNE: a longitudinal clinical, functional and imaging evaluation of patients affected by GNE myopathy. Neuromuscul Disord. 2016;26(S2): 169.
8. Carlier PG, Azzabou N, de Sousa PL, et al. Skeletal muscle quantitative nuclear magnetic resonance imaging follow-up of adult Pompe patients. J Inherit Metab Dis. 2015;38(3):562-572.
Figures