5063
Combined accelerated 4D Phase Contrast and 3D Diffusion Tensor Imaging reveals a complex relation between strain and muscle architecture in contracting leg muscles1Department of Radiology, Academic Medical Center, Amsterdam, Netherlands, 2Biomedical NMR, Department of Biomedical Engineering, Eindhoven University of Technology, Eindhoven, Netherlands, 3Orthopaedic Research Laboratory, Radboud UMC, Nijmegen, Netherlands, 4Department of Radiology, University Medical Center Utrecht, Utrecht, Netherlands, 5Biomedical Engineering and Physics, Academic Medical Center, Amsterdam, Netherlands
Synopsis
Skeletal muscles are geometrically complex 3D structures, and cannot be fully characterized by 2D imaging. Therefore, a complete understanding of mechanisms of force transmission and strain development in relation to muscle architecture during contraction requires a 3D approach. We measured strain rate in the lower leg using a 4D accelerated Phase Contrast protocol and 3D muscle architecture with DTI. Our 3D strain rate data revealed a planar pattern, with one negative and one positive strain rate eigenvalue. Strain rate data combined with 3D muscle architecture, suggested a complex and heterogeneous behavior of strain development during muscle contraction.
Introduction
Mathematical models of skeletal muscles have contributed to our understanding of the musculoskeletal system and were used to optimize surgical treatment (1–3). However, due to lack of subject-specific input, these models often rely on considerable simplifications and assumptions. For instance, it is often assumed that muscles shorten uniformly along their longitudinal axis, while evidence exists for more complex contraction patterns and non-collinear alignment of the direction of shortening with the muscle fiber direction (4,5). Furthermore, differences in deformation patterns were observed between deep and superficial muscles (4) and between proximal and distal locations (5,6). To reveal these highly complex patterns in muscle contraction and deformation, 3D imaging of contracting muscles and fiber architecture is a necessity.
The aim of this study was to quantify 3D strain rates in the lower leg musculature using Phase Contrast (PC) MRI and relate local strain rate patterns to 3D muscle architecture, obtained from DTI.
Methods
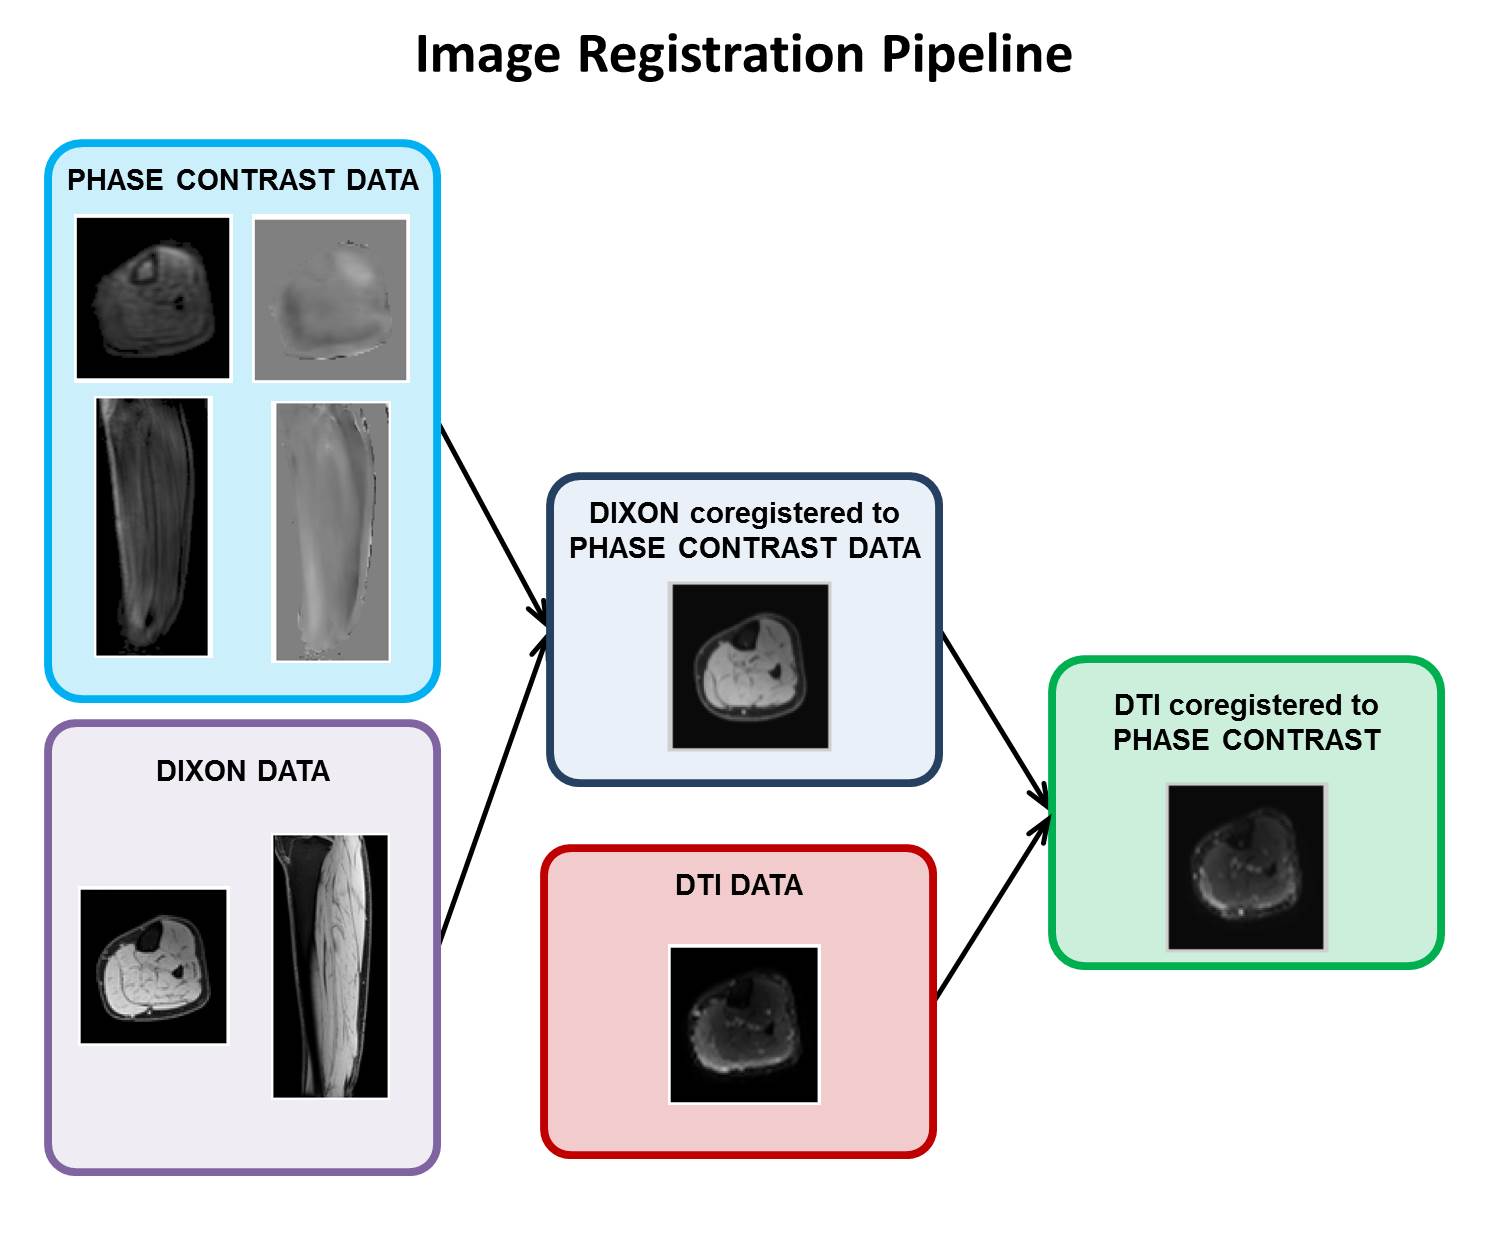
The right lower legs of five healthy volunteers were scanned using a 3T Philips Ingenia scanner. We acquired an anatomical mDixon and a DTI scan with the foot in dorsiflexed position. Subsequently, the subjects were instructed to perform active foot dorsi/plantarflexion (f=0.5 Hz) and an accelerated PC protocol was used to retrieve velocity information in skeletal muscles during contraction. All scans were acquired sagittally with the following scan parameters: FOV = 400 x 400 x 150 mm3, voxel sixe 1 x 1 x 1 mm3 (mDixon), 2.78 x 2.78 x 3 mm3 (DTI) and 1.79 x 1.79 x 5 mm3 (PC). For the DTI scan 3 b0 and 12 diffusion weighted images (b=400 s/mm2) were acquired. For the PC scan, 3D velocity was measured with VENC=12 cm/s at 12 time points during the motion cycle. Scan time for the PC scan was 2.46 minutes, corresponding to 83 repetitions of the motion task. PC data was acquired by undersampling k-space based on a variable-density Poisson disc pattern. The undersampled data was reconstructed using a Compressed Sensing pipeline (7) implemented using the BART toolbox (8). The processing pipeline used to align PC and DTI data is illustrated in Figure 1. After image registration, the strain rate and the diffusion tensor were calculated from the PC and DTI data, respectively. The two tensors were subsequently diagonalized to obtain the principal strain rate eigensystem (local 3D contraction and expansion) and the principal directions of diffusion (local 3D fiber architecture).Results
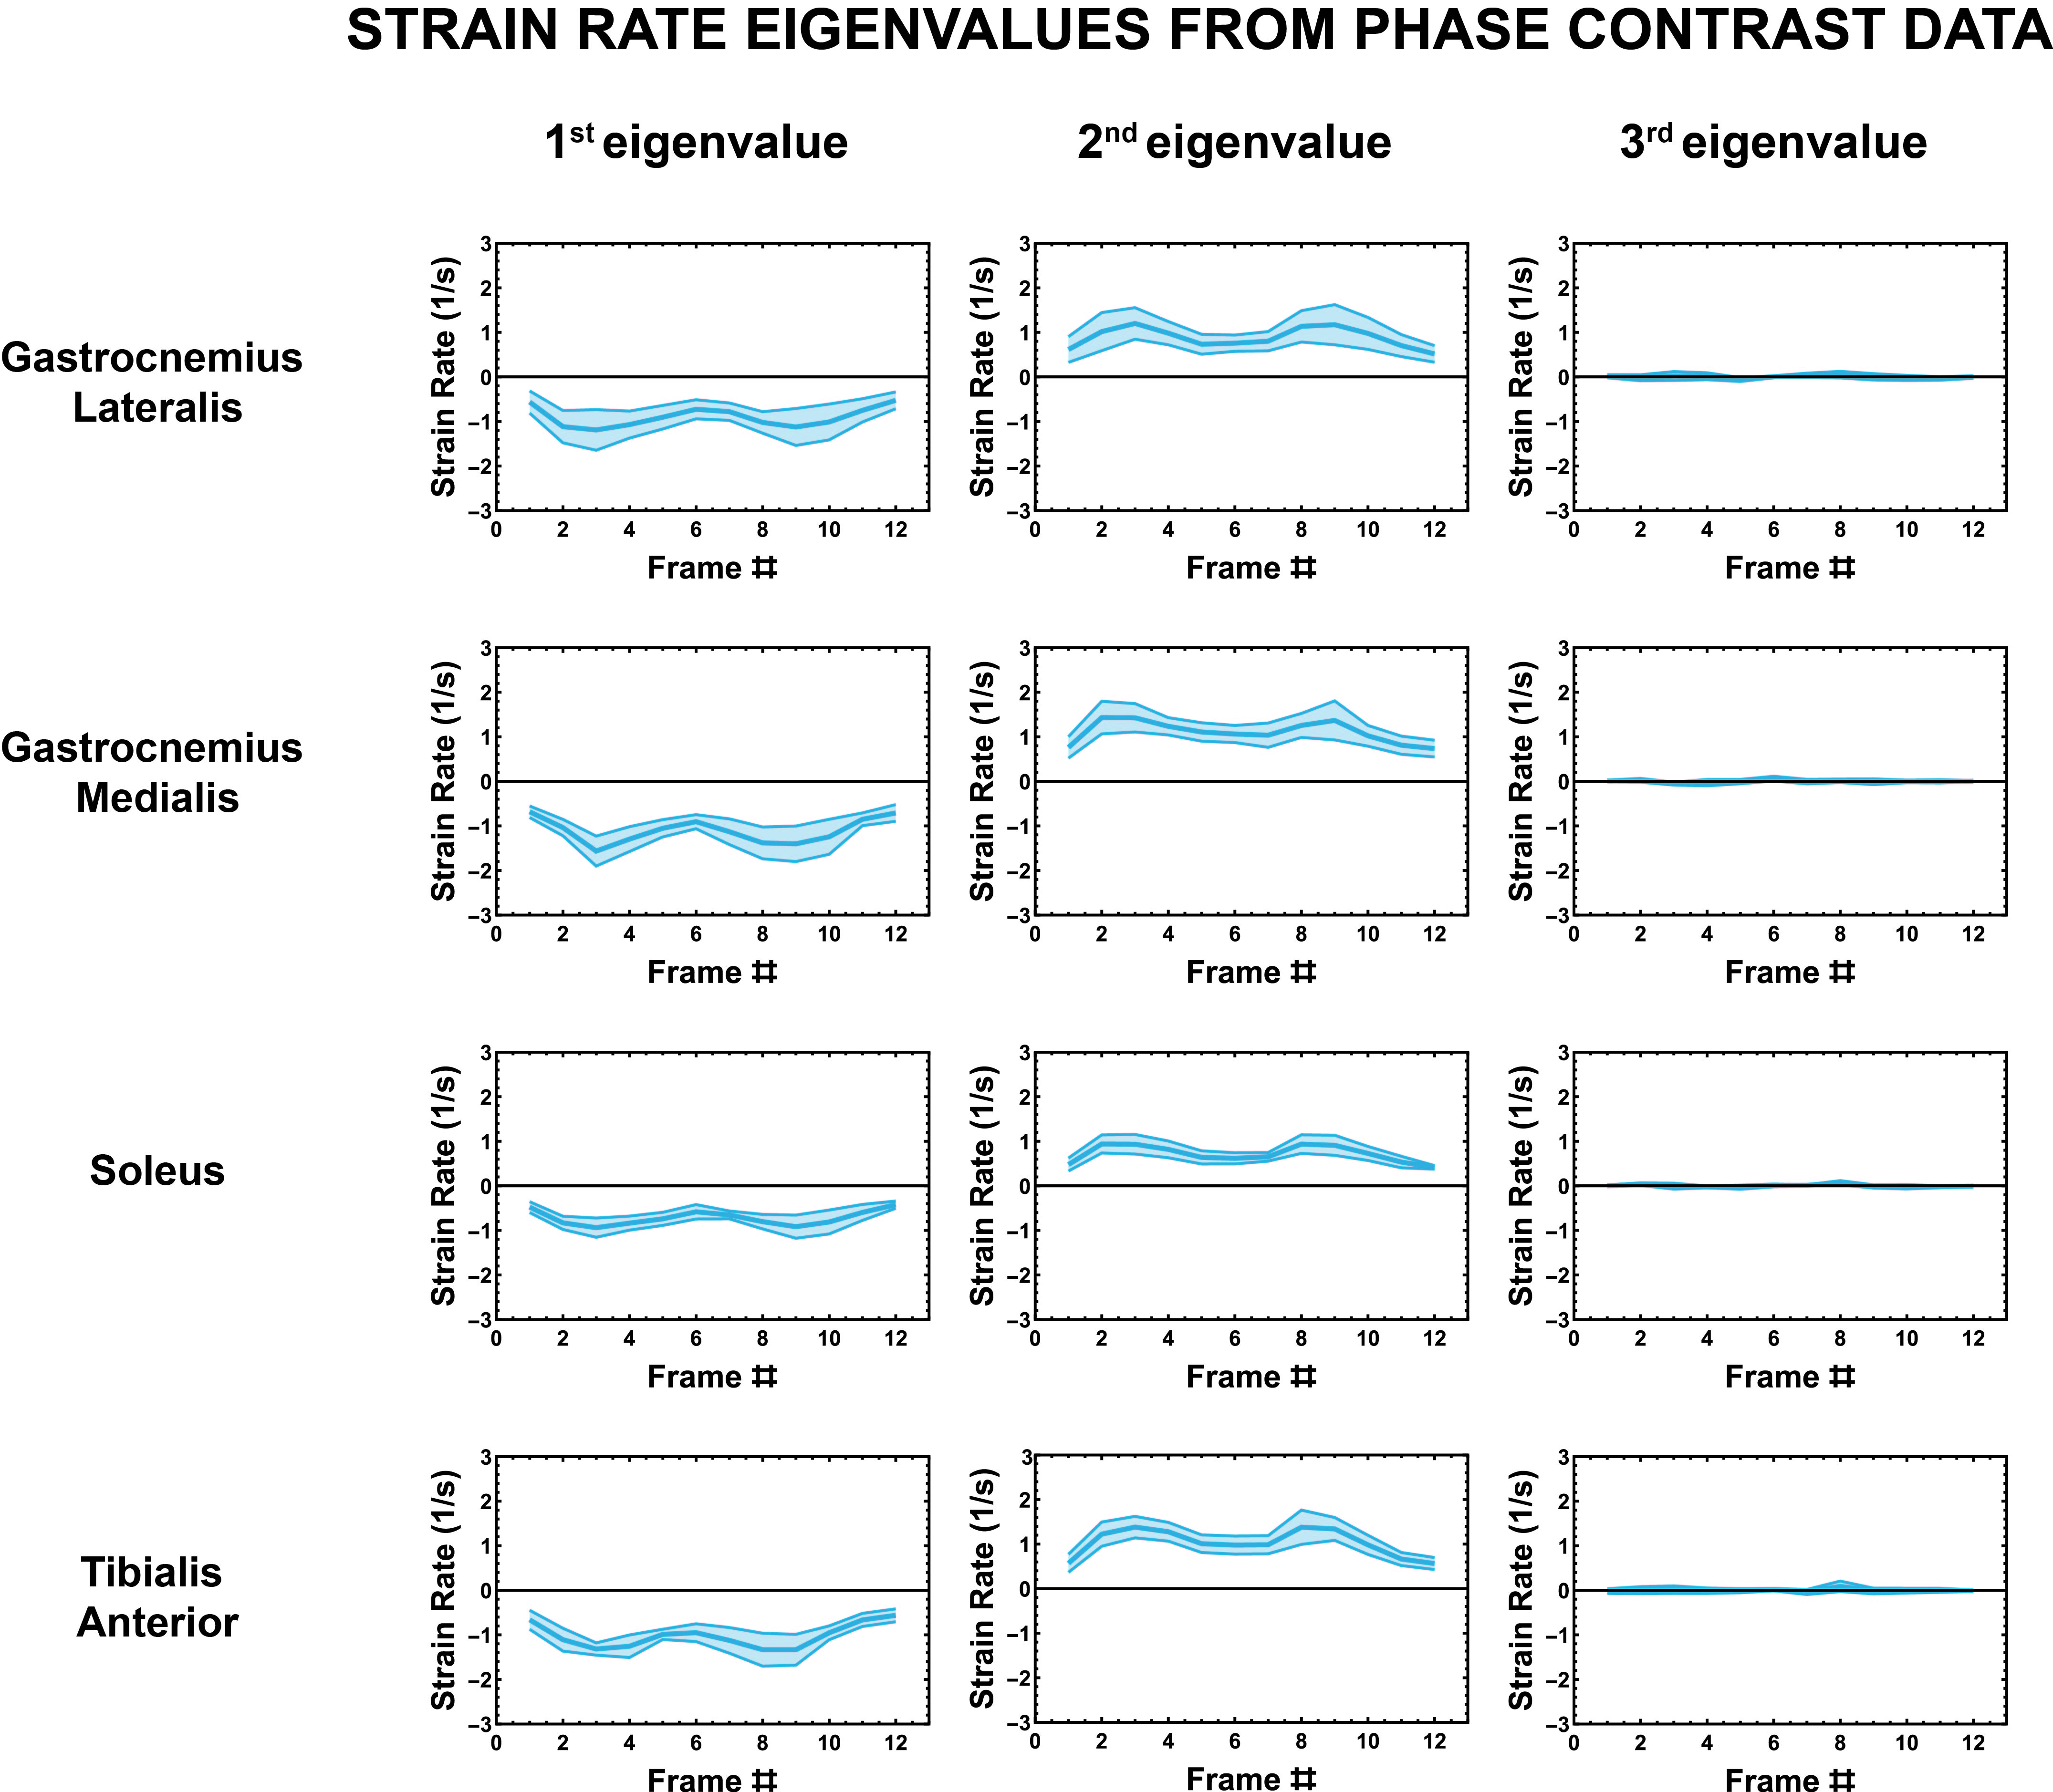
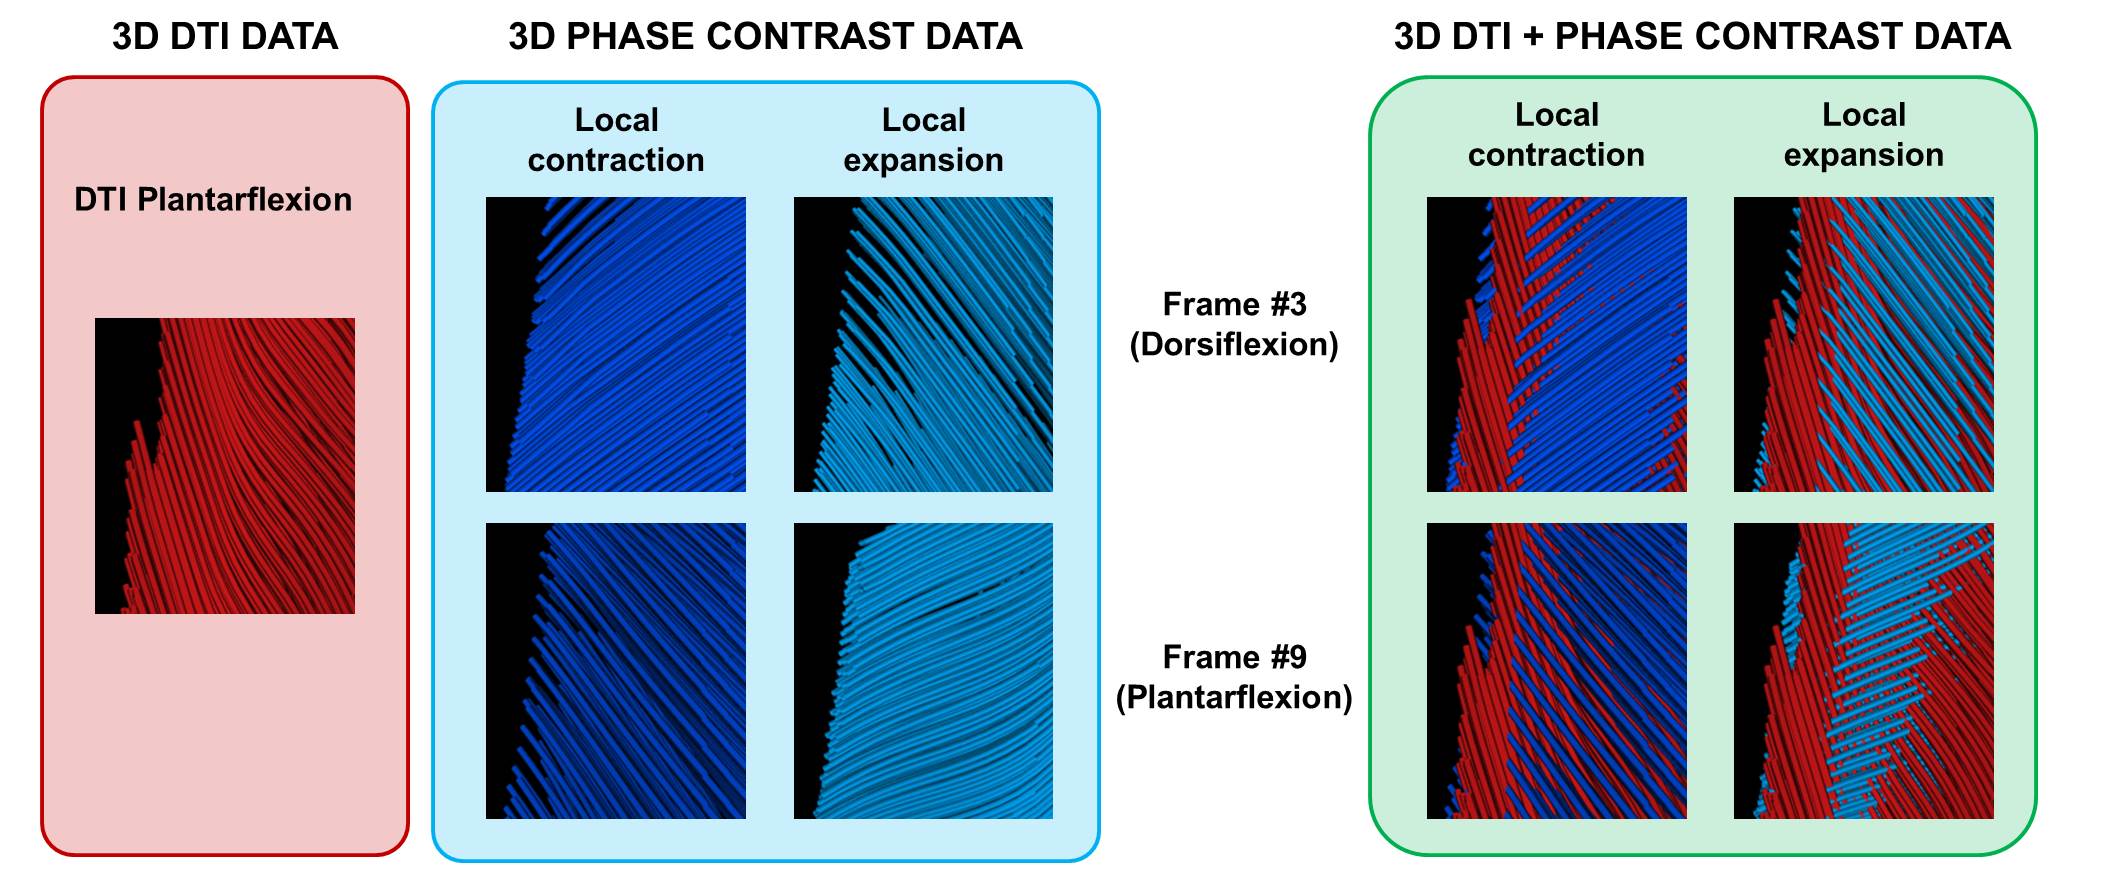
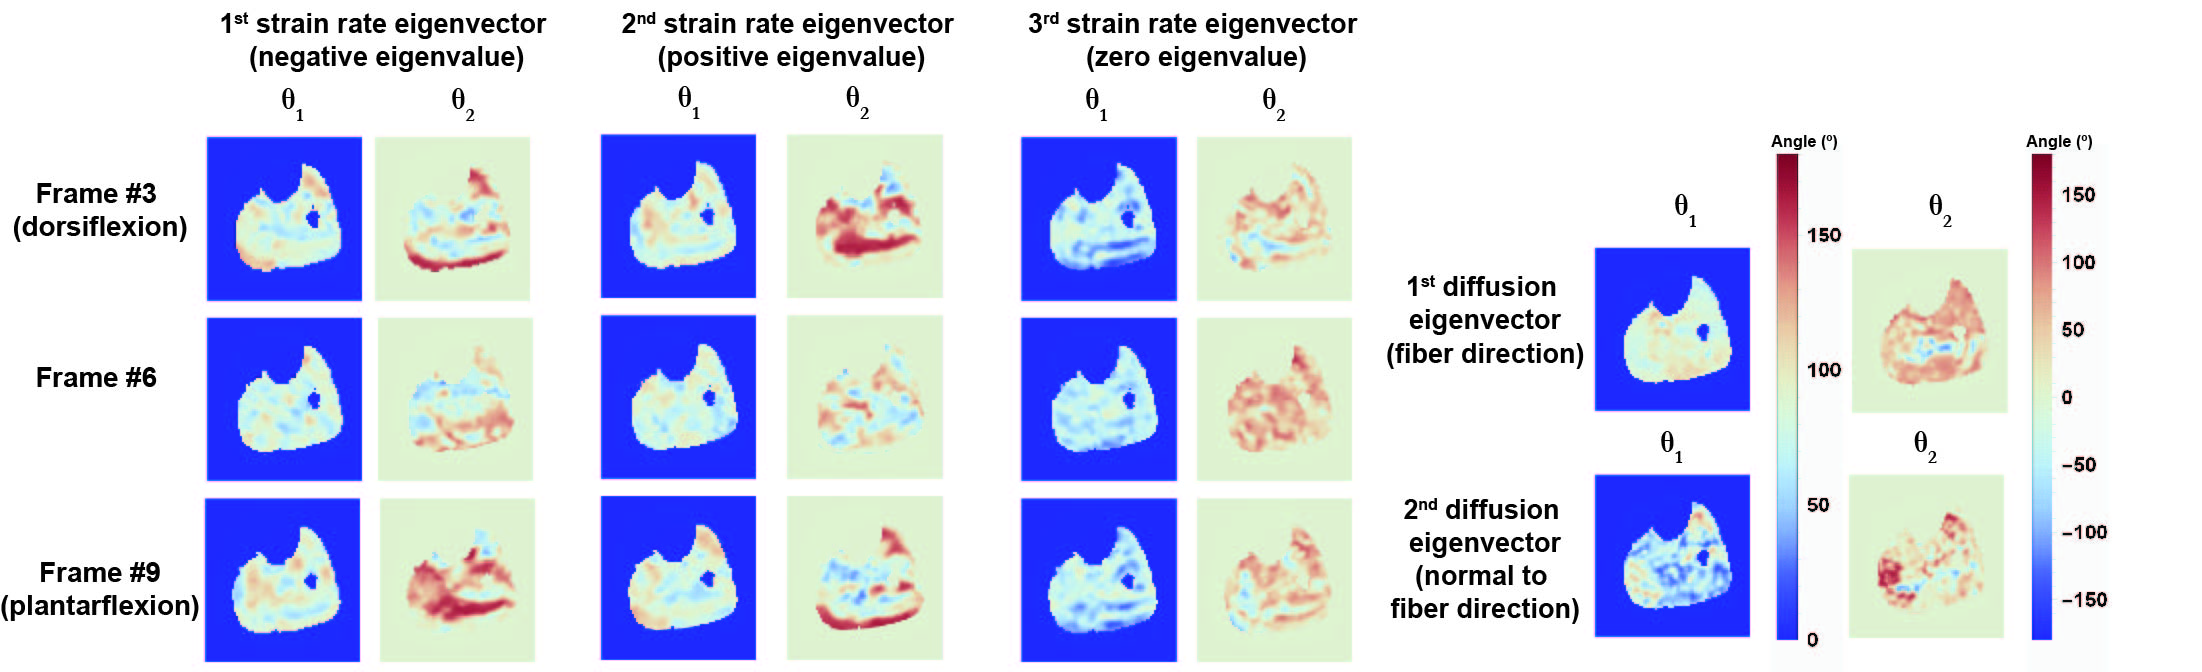
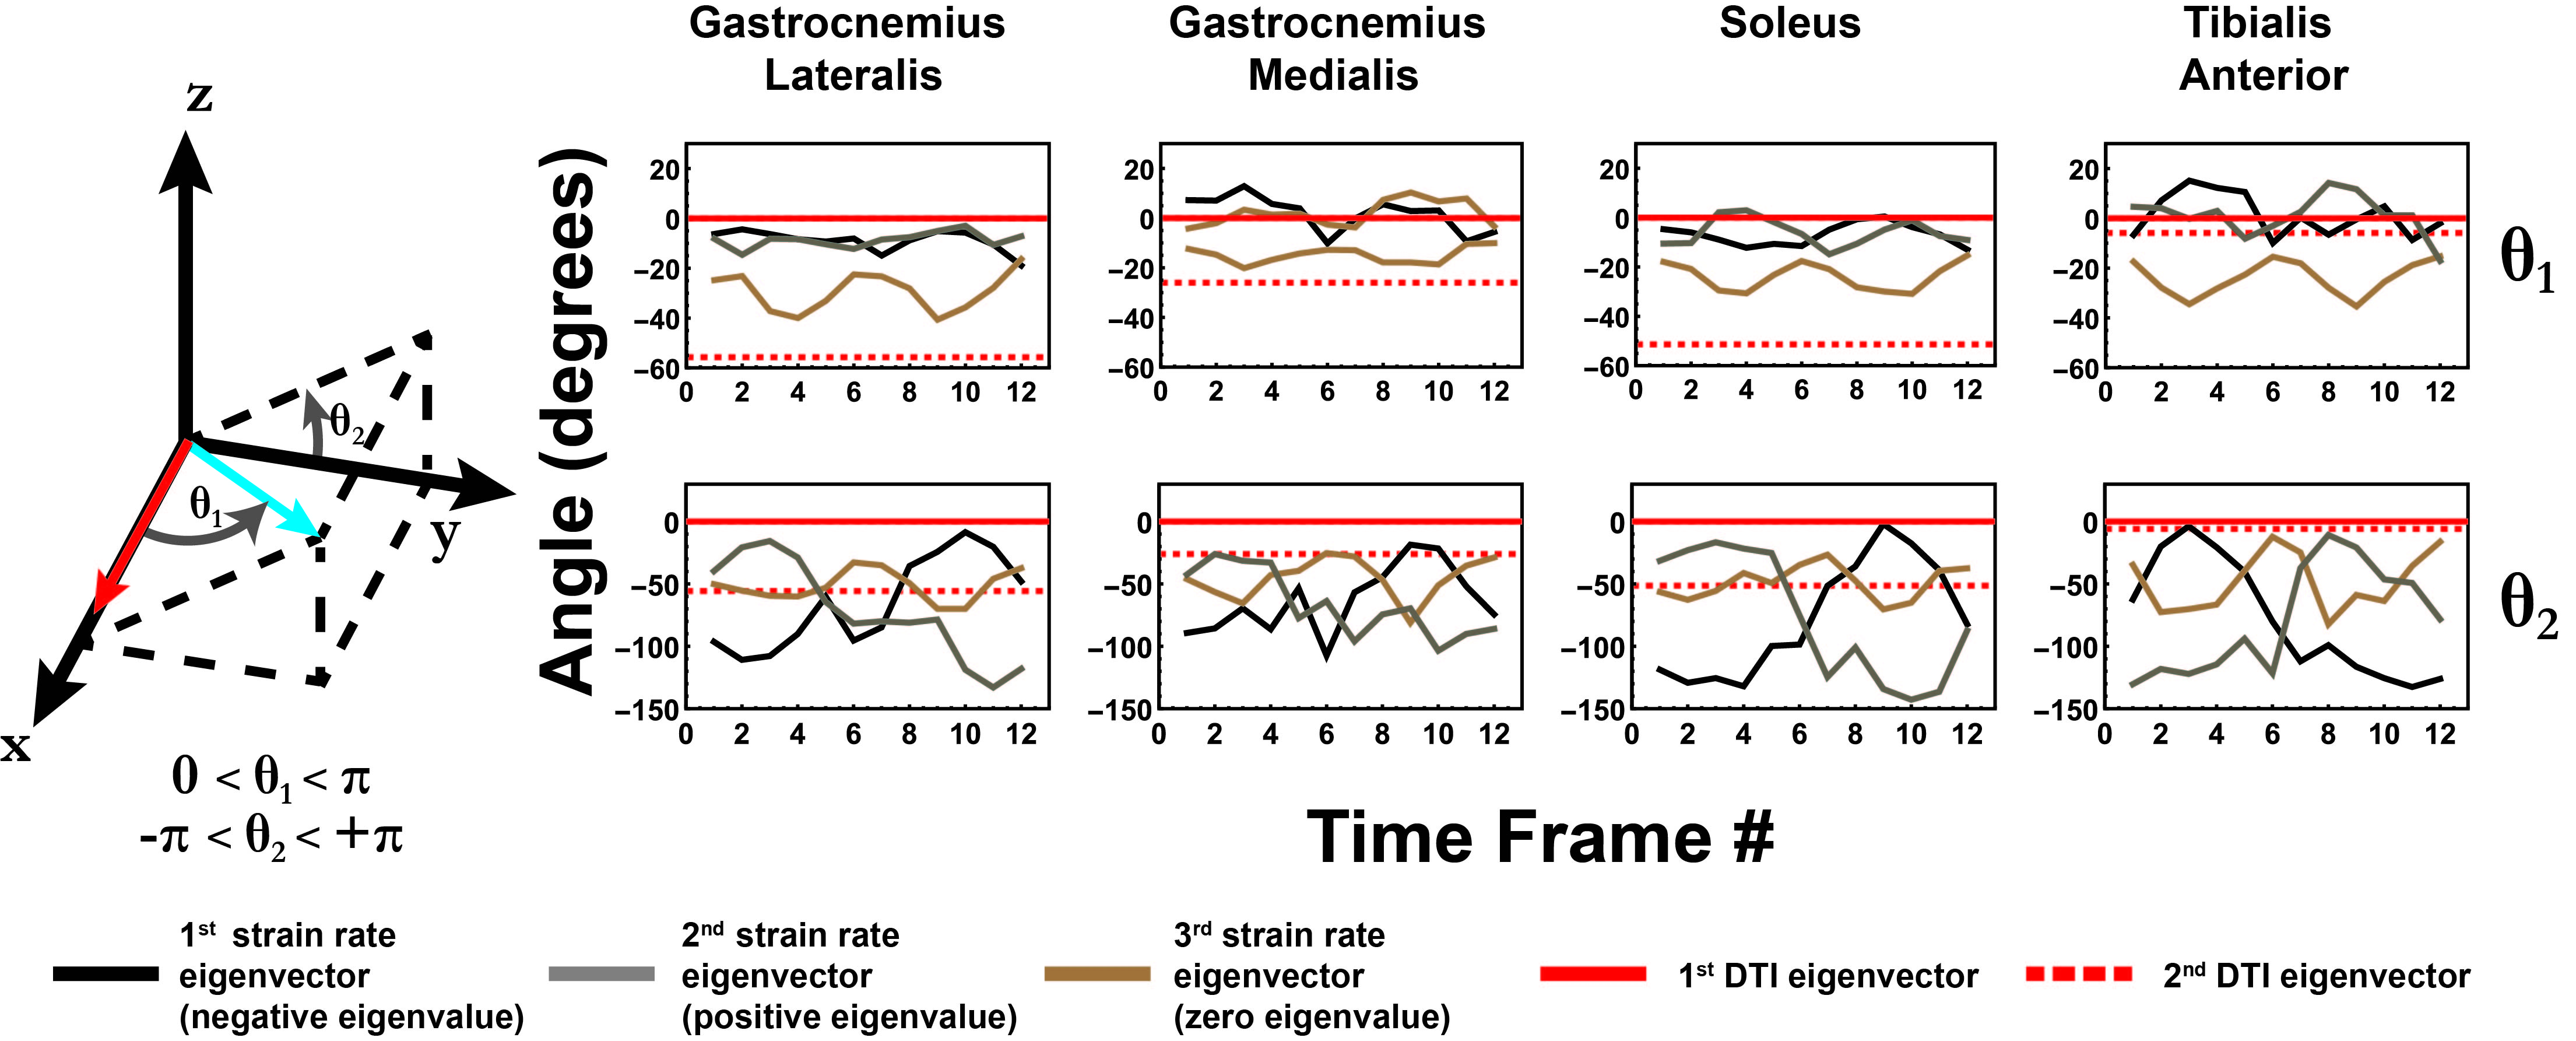
The strain rate tensor consistently resulted in one negative (local contraction, 1st eigenvalue), one positive (local expansion, 2nd eigenvalue) and one zero eigenvalue (3rd eigenvalue) (Figure 2). Tracking of the eigenvectors of strain rate and diffusion showed that during active contraction the principal direction of contraction is almost aligned to (but slightly deviates from) the local fiber direction (Figure 3). Figure 4 shows the time evolution of the strain rate eigenvectors in one representative volunteer during the dorsi/plantarflexion cycle with respect to the muscle fiber orientations (1st and 2nd DTI eigenvectors). Eigenvector directions are expressed in polar-coordinates. These maps suggest a complex and heterogeneous pattern of strain development in contracting and relaxing muscles. Furthermore, we found that the elevation angle θ2 of the principal direction of contraction closely aligned to fiber angle during contraction (frames #3 for Tibialis Anterior and frame #9 for Gastrocnemius Lateralis, Gastrocnemius Medialis and Soleus), while deviations between local fiber direction and strain rate directions were observed for the azimuthal angle θ1 (Figure 5).Discussion & conclusion
This study was the first to measure combined 4D strain rates and 3D muscle architecture with full coverage in the lower leg musculature. Due to the full 3D nature of DTI and PC acquisitions, strain directions could be compared to the fiber architecture at the voxel level, without requiring any assumptions on the nature of fiber arrangement and strain rate behavior. Our data revealed a planar but complex pattern of strain development in all the investigated muscles, in agreement with previous studies (4). The combination of strain rates with 3D muscle architecture obtained from DTI showed a complex and spatially heterogeneous pattern of strain development. This emphasizes the need for 3D analysis of fiber architecture and strain mechanisms. Furthermore, we observed angular deviations of strain rate directions from the local fiber direction, suggesting shearing between muscle fibers (5).
Taken together, these results can be used to obtain more accurate models of skeletal musculature, which in turn can lead to a deeper understanding of movement abnormalities and optimization of treatment strategies in muscle recovery and to improve intervention approaches to reduce loss of force production in aging processes.
Acknowledgements
No acknowledgement found.References
1 Blemker SS, Pinsky PM, Delp SL. A 3D model of muscle reveals the causes of nonuniform strains in the biceps brachii. J. Biomech. 2005;38:657–665. doi: 10.1016/j.jbiomech.2004.04.009.
2 Blemker SS, Asakawa DS, Gold GE, Delp SL. Image-based musculoskeletal modeling: Applications, advances, and future opportunities. J. Magn. Reson. Imaging 2007;25:441–451. doi: 10.1002/jmri.20805.
3 Asakawa DS, Blemker SS, Gold GE, Delp SL, Asakawa DS. In vivo motion of the rectus femoris muscle after tendon transfer surgery. J. Biomech. 2002;35:1029–1037. doi: 10.1016/S0021-9290(02)00048-9.
4 Englund EK, Elder CP, Xu Q, Ding Z, Damon BM. Combined diffusion and strain tensor MRI reveals a heterogeneous, planar pattern of strain development during isometric muscle contraction. Am. J. Physiol. Regul. Integr. Comp. Physiol. 2011;300:R1079–R1090. doi: 10.1152/ajpregu.00474.2010.
5 Sinha U, Malis V, Csapo R, Moghadasi A, Kinugasa R, Sinha S. Age-related differences in strain rate tensor of the medial gastrocnemius muscle during passive plantarflexion and active isometric contraction using velocity encoded MR imaging: Potential index of lateral force transmission. Magn. Reson. Med. 2015;73:1852–1863. doi: 10.1002/mrm.25312.
6 Finni T, Hodgson J a, Lai AM, Edgerton VR, Sinha S. Nonuniform strain of human soleus aponeurosis-tendon complex during submaximal voluntary contractions in vivo. J. Appl. Physiol. [Internet] 2003;95:829–37. doi: 10.1152/japplphysiol.00775.2002.
7 Gottwald et al, Compressed Sensing accelerated time-resolved 3D phase contrast MRI of the lower leg muscles during active dorsi- and plantarflexion, 0093, Proc. Intl. Soc. Mag. Reson. Med. 25 (2017)
8 Uecker, Martin, et al. "Berkeley advanced reconstruction toolbox." Proc. Intl. Soc. Mag. Reson. Med. 2015; Vol. 23.
9 Klein et al. Elastix: A toolbox for intensity-based medical image registration. IEEE Trans. Med. Imaging 2010;29:196–205.
Figures