5061
Do MR biomarkers for muscular fat infiltration and atrophy correlate with functionality and the DMPK CTG repeat length in myotonic dystrophy type 1?1Radiology and Nuclear Medicine, Radboud university medical center, Nijmegen, Netherlands, 2Neurology, Radboud university medical center, Nijmegen, Netherlands, 3Neuromuscular Reference Center, Henri Mondor university Hospital, Paris, France, 4Institute of Genetic Medicine, Newcastle University, Newcastle upon Tyne, United Kingdom, 5Radiology, Henri Mondor university Hospital, Paris, France, 6Institute for Ageing and Health, Newcastle University, Newcastle upon Tyne, United Kingdom, 7Institute of Molecular, Cell and System Biology, College of Medical, Veterinary and Life Sciences, University of Glasgow, Glasgow, United Kingdom
Synopsis
Quantitative MRI provides objective non-invasive biomarkers for muscle pathology in muscular dystrophy disorders. In this work we show that MR biomarkers for muscular fat infiltration and atrophy accurately reflect clinical outcomes for disease severity and physical capacity in myotonic dystrophy type 1 (DM1) patients. Furthermore, we found that 37% of the variation in fat infiltration in DM1 patients was explained by age. Interestingly, an additional 9.7% of the variation in fat infiltration was associated with the over life time increase in the DMPK CTG repeat length, i.e. the genetic defect causing DM1.
Purpose
Myotonic dystrophy type 1 (DM1) is an inherited muscular dystrophy with a prevalence of approximately 10:100,000.1 It is caused by an expansion of the trinucleotide (CTG) repeat in the DMPK gene, whereby the CTG repeat length correlates with disease severity.2,3 Muscles in DM1 patients show progressive fat infiltration and atrophy.4 This can be assessed quantitatively with MRI5, wherefore MRI provides objective non-invasive biomarkers for muscle pathology.6 These MR biomarkers have diagnostic relevance and may be used to assess disease interventions.7 As this has not yet been assessed for DM1 patients we investigated if MR biomarkers for muscular fat infiltration and atrophy reflect clinical outcomes for disease severity and physical capacity. Furthermore, we investigated if age and the DMPK CTG repeat length explain the between-subject variation in fat infiltration in muscles of DM1 patients.Methods
Subjects: We included 33 DM1 patients (18 men) with an average age of 45 years (range: 19-72y).
Data acquisition
MR acquisition: Subjects were examined using a 3T Siemens MR system and spine/phased array coil combination placed around the right or left lower extremity. We acquired a 3D DIXON sequence (TR=10ms; FA=3°; FOV=256x192mm; voxel size=1x1x5mm; number slices=32; 2pt-Dixon: TE1/TE2=2.45/3.675ms; 3pt-Dixon: TE1/TE2/TE3=2.31/3.68/5.07ms). This resulted in a reconstructed fat (F) and water image (W).
Disease severity and physical capacity: Disease severity was assessed by the DM1-specific muscle impairment rating score (MIRS)8. Physical capacity was tested by performing a six minute walking test (6MWT) and in 21 DM1 patients it was also assessed objectively with an accelerometer that was worn for two weeks. This accelerometer recorded the average activity over 24 hours, the most active and the least active five hours.
DMPK CTG repeat length: Blood samples were taken to determine the average CTG repeat length at time of visit (CTGvisit) and inherited CTG repeat length (CTGinherited) of the expanded allele.9 Somatic instability (CTGdiff) was determined as the difference between CTGvisit and CTGinherited.
Post-processing MRI
A fat fraction map (FFmap) was calculated voxel-wise as F/(F+W). Twelve thigh and eight calf muscles were manually delineated on five distal, middle and proximal slices of the 3D Dixon (Fig1), avoiding contamination of subcutaneous fat. For each muscle, the fat fraction (FF) was calculated as the average over all voxels on the FFmap and muscle volume (MV) as the number of voxels multiplied by the voxel volume. Thereafter, contractile muscle volume (cMV), i.e. the remaining muscle tissue being still able to contract, was calculated as muscle volume times the muscle fraction (1-FF). For each subject, the individual muscle outcomes were combined to a value for the whole lower extremity. We determined the average over all muscle for FF, while we took the sum of all muscles for MV and cMV.
Statistics
FF and cMV were correlated with MIRS, 6MWT, and accelerometer data using a Pearson or Spearman correlation. Furthermore, multivariate linear regression was applied to explain the variation in FF using age, CTGvisit, CTGinherited, and CTGdiff.
Results
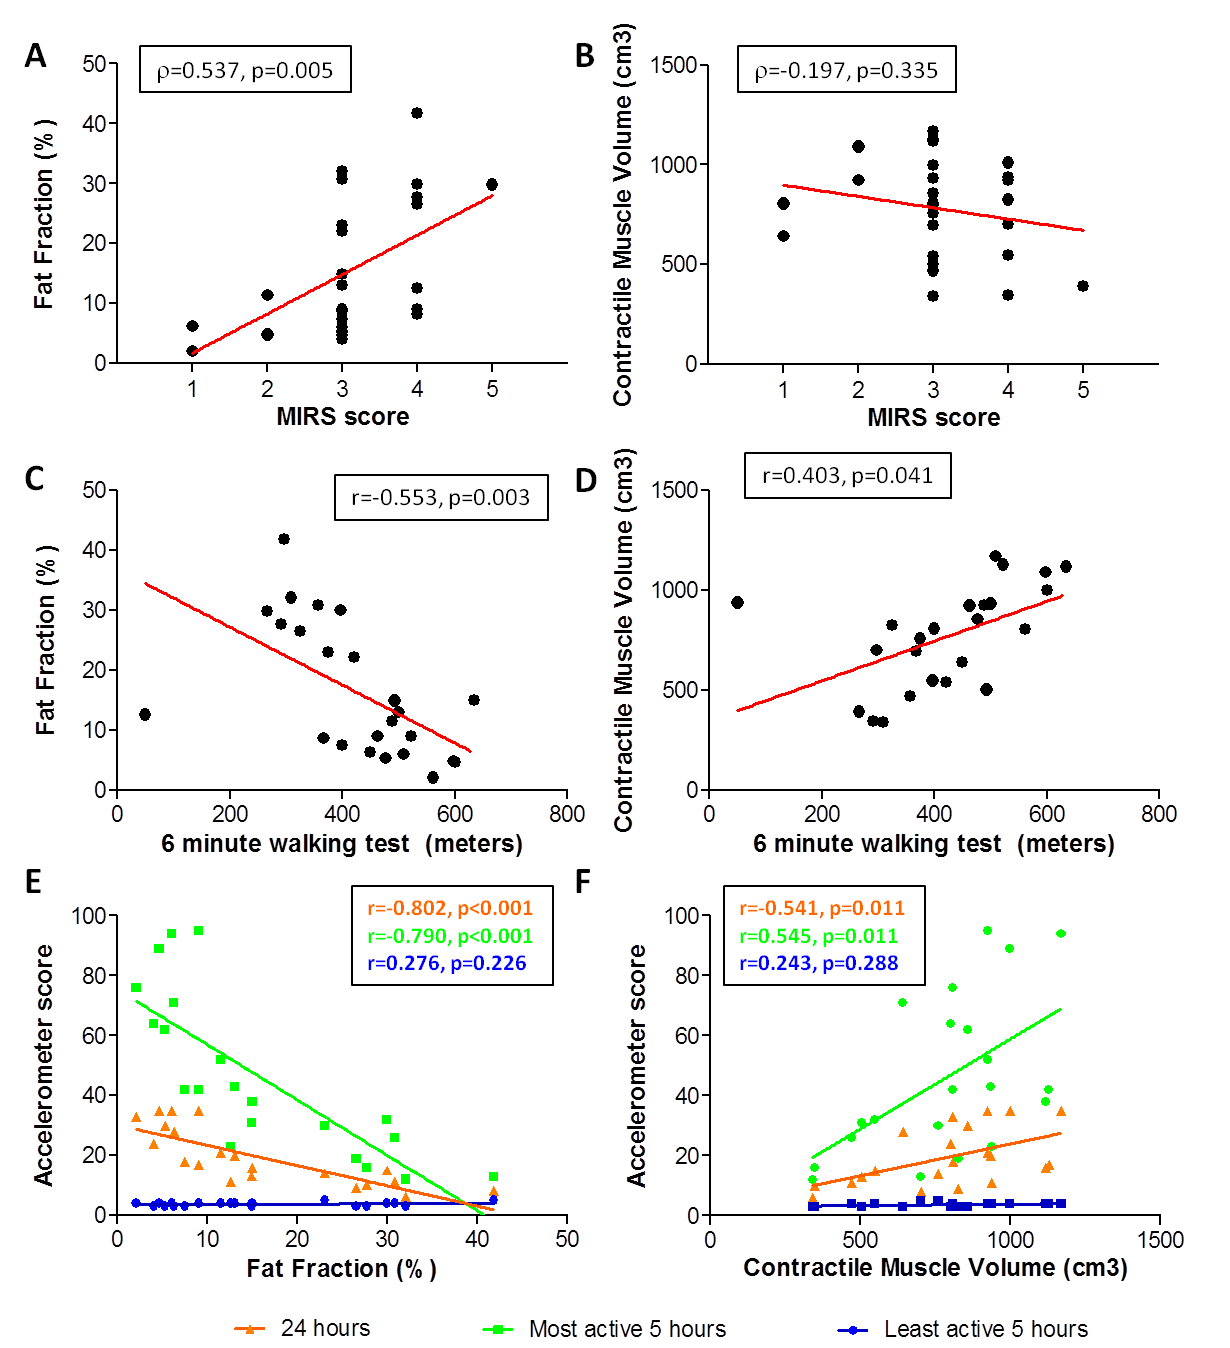
Quantitative MRI vs. disease severity and physical capacity (Fig2): MIRS only correlated significantly with FF (r=0.537; p=0.005), while 6MWT correlated significantly with both FF (r=-0.553; p=0.003) and cMV (r=0.403; p=0.041). Interestingly, we observe one outlier, where the patient had a very low 6MWT (50m), with a relatively normal FF and cMV (12.5% and 938 cm3). For the accelerometer data, average activity over 24 hours and most active five hours correlated significantly with FF (24h: r=-0.802, p<0.001; 5h: r=-0.790, p<0.001) and cMV (24h: r=0.541, p=0.011; 5h: r=-0.545, p=0.011), while, as expected, no correlation was found with the least active 5 hours.
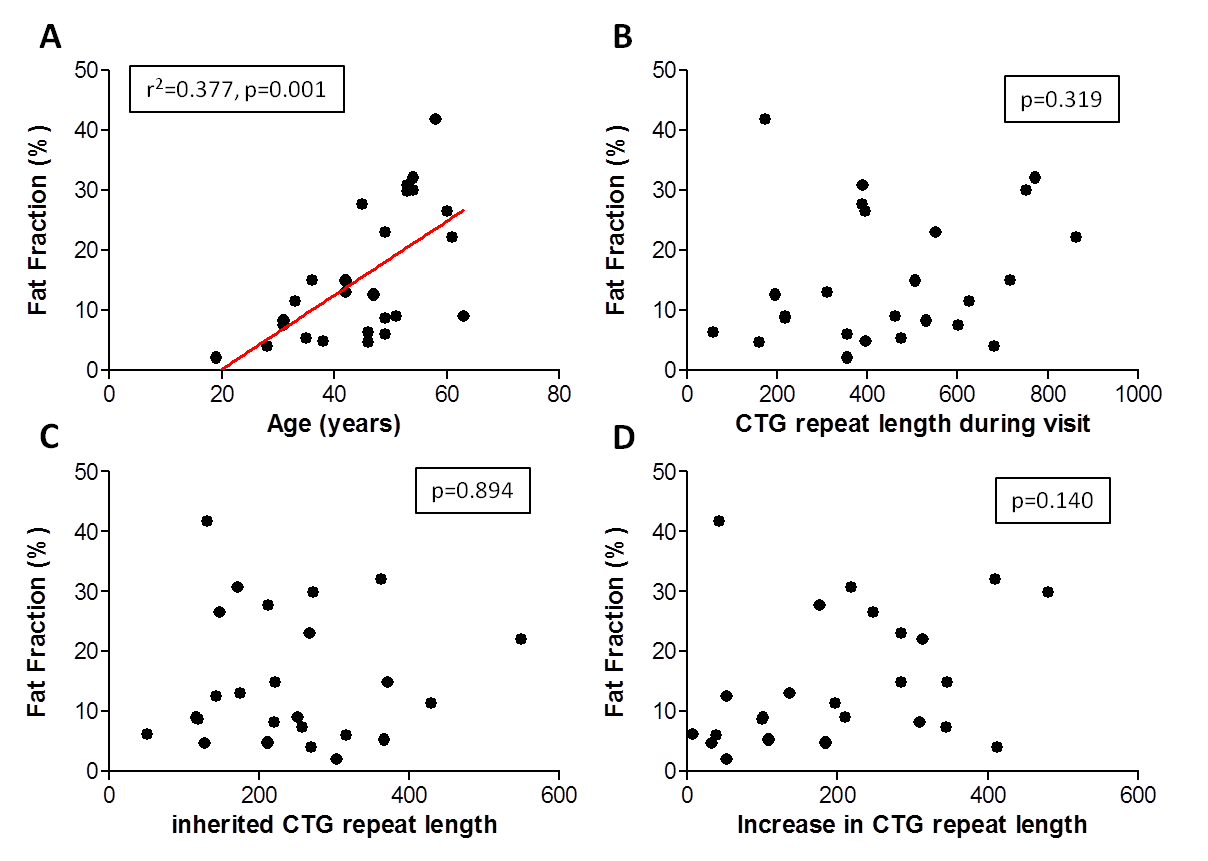
Quantitative MRI vs age and DMPK CTG repeat length (Fig3, Table 1): Linear regression models showed that age is the main predictor of FF (r2=0.377, p=0.001), while CTGvisit, CTGinherited, and CTGdiff did not explain any variation in FF. However, if CTGdiff is added to age it significantly explains an additional 9.7% of variation in FF (p=0.043).
Conclusion
Quantitative MRI derived fat fraction and contractile muscle volume in muscles from DM1 patients significantly correlates with clinical outcomes for disease severity (MIRS) and physical capacity (6MWT and accelerometer). This indicates that quantitative MR biomarkers accurately reflect patient’s muscle functionality measured with clinical tests as well as activity in daily life. Furthermore, as expected for a progressive disease, 37% of the variation in FF was explained by age. Interestingly, an additional 9.7% of the variation in FF was associated with the measure of somatic instability in blood. These data suggest that the very large somatic CTG expansions that accrue in muscle during the life time of the patient contribute directly toward disease development.Acknowledgements
We would like to thank all patients for their time and effort. This work was funded by the European Community's Seventh Framework Programme (FP7/2007– 2013), grant number 305697.
References
1Norwood FLM, Harling C, Chinnery PF, Eagle M, Bushby K, Straub V. Prevalence of genetic muscle disease in Northern England: In-depth analysis of a muscle clinic population. Brain. 2009;132:3175–3186.
2Chau A, Kalsotra A. Developmental insights into the pathology of and therapeutic strategies for DM1: Back to the basics. Dev. Dyn. 2015. p. 377–390.
3Brook JD, McCurrach ME, Harley HG, et al. Molecular basis of myotonic dystrophy: Expansion of a trinucleotide (CTG) repeat at the 3’ end of a transcript encoding a protein kinase family member. Cell. 1992;68:799–808.
4Dubowitz V, Sewry C. Muscle Biopsy: A Practical Approach. Neuropathol. Appl. Neurobiol. 2007.
5Heskamp L, van Nimwegen M, Bassez G, et al. Disease progression in skeletal muscles of Myotonic Dystrophy Type 1 evaluated using quantitative MRI. Proc ISMRM. Epub 2017.
6Carlier PG, Marty B, Scheidegger O, et al. Skeletal Muscle Quantitative Nuclear Magnetic Resonance Imaging and Spectroscopy as an Outcome Measure for Clinical Trials. J Neuromuscul Dis. 2016;3:1–28.
7Janssen B, Voet N, Geurts A, Van Engelen B, Heerschap A. Quantitative MRI reveals decelerated fatty infiltration in muscles of active FSHD patients. Neurology. 2016;86:1700–1707.
8Mathieu J, Boivin H, Meunier D, Gaudreault M, Bégin P. Assessment of a disease-specific muscular impairment rating scale in myotonic dystrophy. Neurology. 2001;56:336–340.
9Morales F, Couto JM, Higham CF, et al. Somatic instability of the expanded CTG triplet repeat in myotonic dystrophy type 1 is a heritable quantitative trait and modifier of disease severity. Hum Mol Genet. 2012;21:3558–3567.
Figures