5059
Decreasing Water T2 based on multi-TE single-voxel MRS in fatty infiltrated skeletal muscles of patients with neuromuscular diseases1Department of Diagnostic and Interventional Radiology, Technical University of Munich, Munich, Germany, 2Department of Diagnostic and Interventional Neuroradiology, Technical University of Munich, Munich, Germany, 3Friedrich-Baur-Institut, Ludwig Maximilian University, Munich, Germany, 4Department of Neurology, Technical University of Munich, Munich, Germany
Synopsis
Quantitative imaging techniques are emerging in the field of magnetic resonance imaging of neuromuscular diseases. Water T2 and proton density fat fraction are the most important imaging markers to assess edematous and fatty transformation in the patients’ muscle tissue. To validate the accuracy of quantitative methods 1H magnetic resonance spectroscopy can be used as a reference standard. The present study investigates water T2 of remaining muscle tissue in regions of higher proton density fat fraction in 42 patients with various neuromuscular diseases using multi-TE single-voxel MRS.
Purpose
Magnetic resonance imaging (MRI) has been emerging as a diagnostic and monitoring tool for patients with neuromuscular diseases (NMD)1. Qualitative imaging routinely based on T1-weighted sequences and T2-weighted STIR sequences enables assessment of three main, often simultaneously present findings: healthy, edematous and fatty muscle tissue2. To classify the extent of edematous muscular alterations and fatty infiltration, semi-quantitative rating scales are commonly used3,4. As semi-quantitative rating is highly reader-dependent, research efforts are expanded aiming to develop robust methods for quantitative imaging such as chemical shift encoding water/fat imaging5-7 or T2 mapping8. 1H magnetic resonance spectroscopy (MRS) can be used as a reference standard for robust quantification of water T2 (T2w) as it takes into account the spectral complexity of fatty-infiltrated muscles9. Previous work has concentrated on T2w elevation as a marker for disease activity in regions of low to moderate fatty infiltration8. However, it remains unknown how T2w behaves at higher fat fractions. Therefore, the purpose of the study was to investigate T2w based on multi-TE single-voxel 1H MRS in skeletal muscles of patients with NMD.Methods
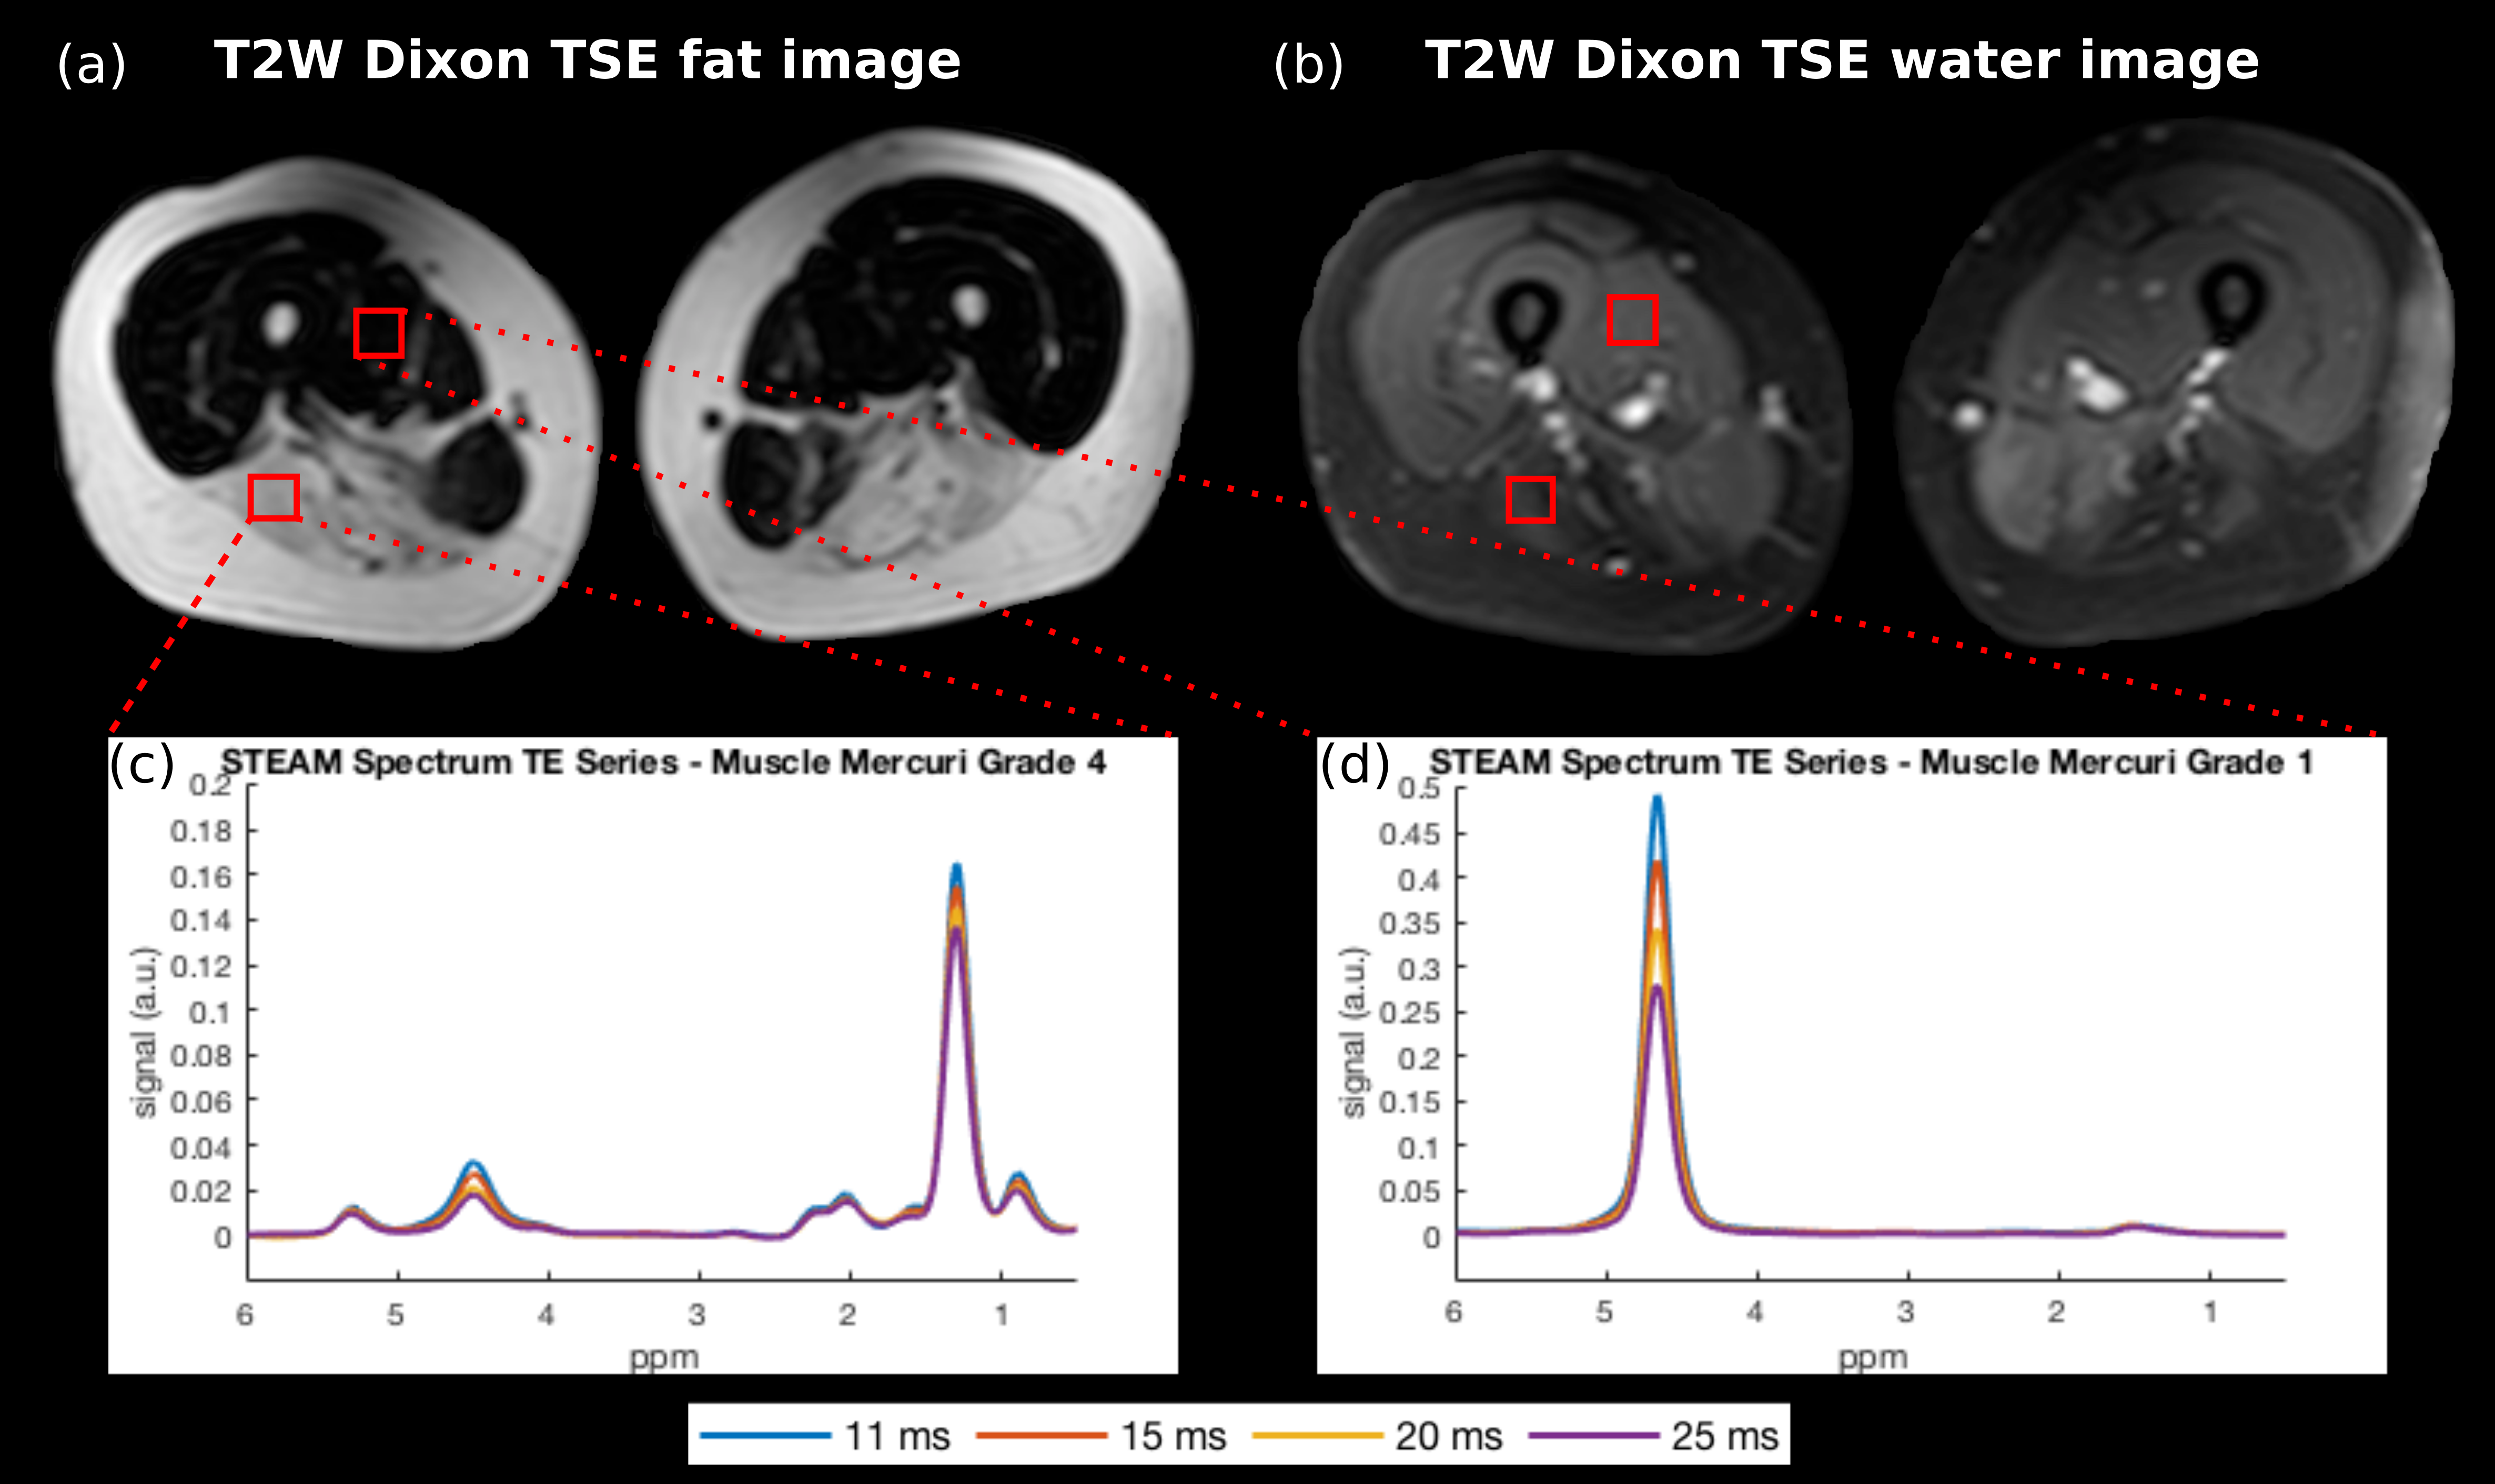
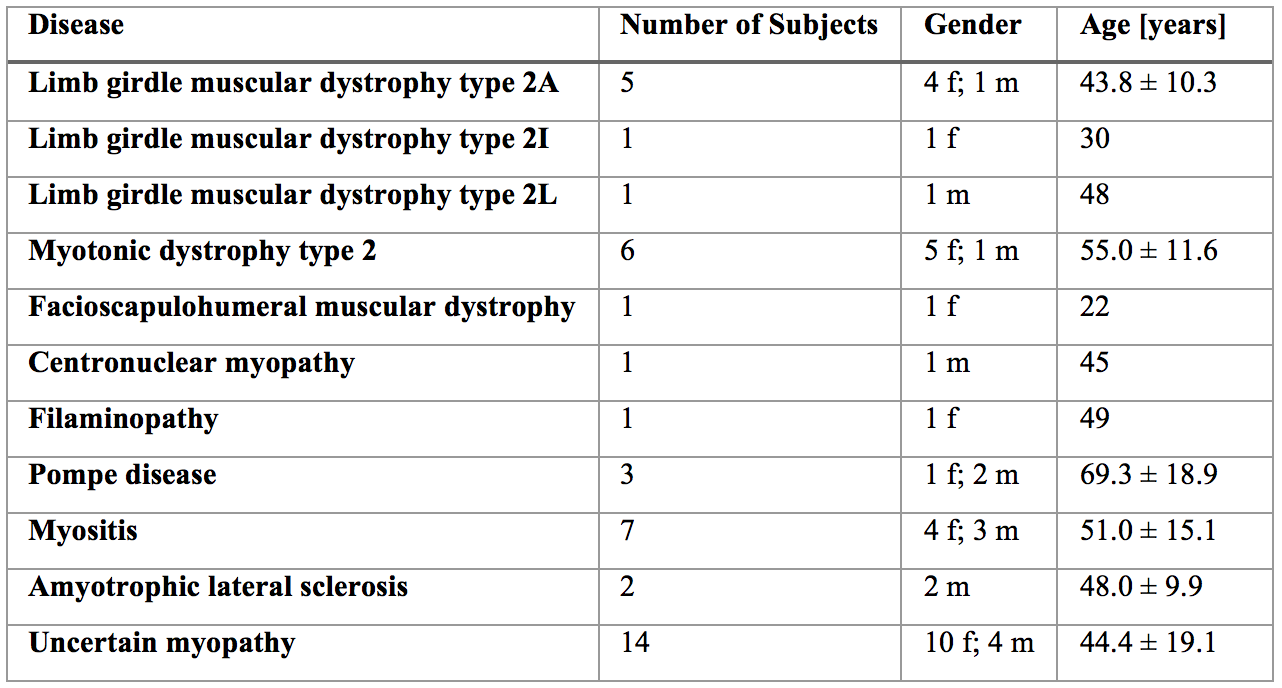
MR measurements: 42 patients (27/15 females/males, age: 48 ± 16.2) with varied NMD (Table 1) underwent MR measurements on a 3T system (Ingenia, Philips Healthcare, Best, Netherlands) using the whole-body coil, the built-in 12-channel posterior coil and a 16-channel anterior coil placed on top of the thigh region. A 2-echo 2D Dixon TSE to generate T2-weighted fat- and water-separated images was performed covering the whole body with 5 stacks: TR/TE/ΔTE = 3725/100/1.0 ms, FOV = 330x450x306 mm3, acquisition voxel size = 2.5x2.7x6.0 mm3, slices = 26, slice gap = 6 mm, TSE factor = 45, averages = 2. A multi-TE single voxel STEAM MRS (TR/TM = 6000/16 ms, VOI = 15x15x15 mm3, 8 averages per TE) was performed at four/five echo times (TE = 11/15/20/25(/35) ms) in regions of healthy, edematous and fatty muscle tissue, selected based on the T2-weighted fat- and water-separated images.
Post-processing: Water-fat separation of the TSE images was performed online using the vendor’s mDixon algorithm10. The processing of the MRS data was performed with in-house software and included zero order phasing, gaussian apodization and frequency alignment. Peak area quantification was performed considering eight to ten fat peaks (depending on the visibility of smaller fat peaks)11 and jointly incorporating the measurement of all four/five TEs12 with one fat T2 (T2f) for all fat peaks. The MRS quantification derived proton density fat fraction (PDFF), T2w and T2f.
Grading: The muscle tissue in the VOI was rated based on the T2-weighted fat- and water-separated images by one reader using the Mercuri and the Morrow grading scale13. MRS performed in regions with Morrow grade 1 or 2 indicating edematous changes were excluded to concentrate on the effect of fatty infiltration on T2w of remaining healthy muscle tissue.
Results
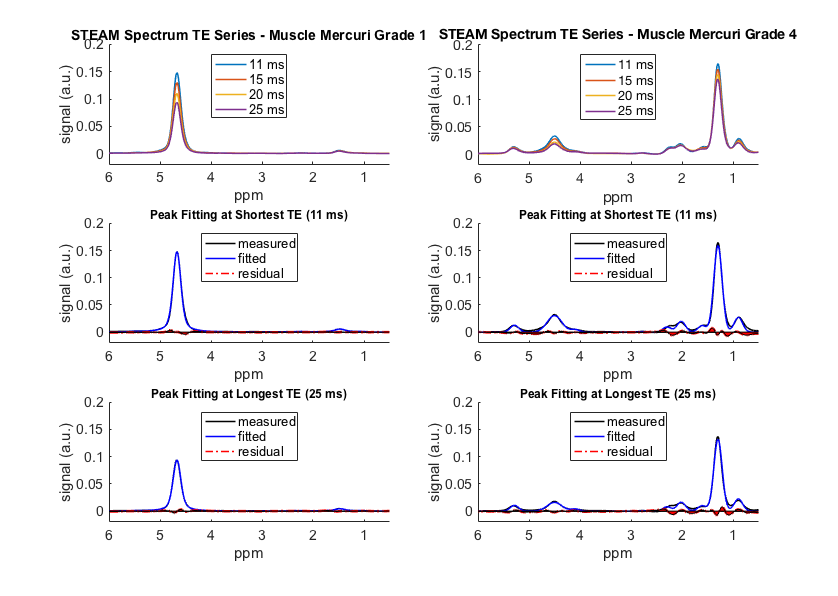
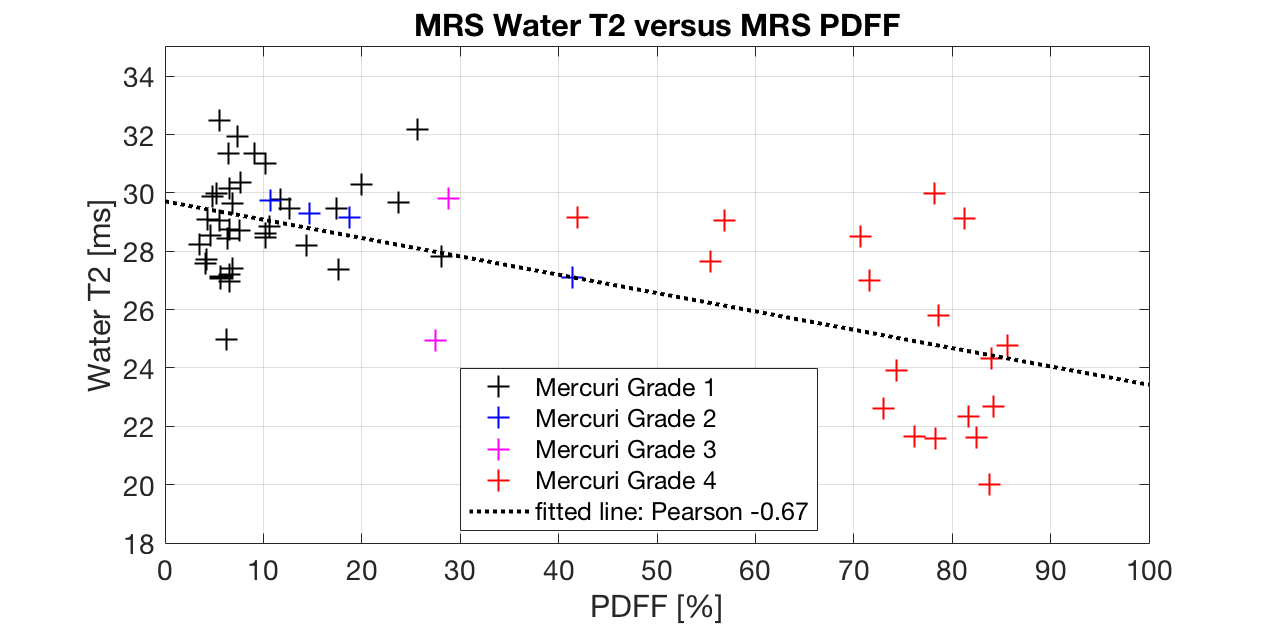
Figure 1 shows exemplary spectra and voxel locations in muscles graded with Mercuri grade 1 and 4 and Morrow grade 0 in a LGMD2A patient. Figure 2 shows exemplary MRS peak fitting results. The applied fitting was reliable in regions with low fatty infiltration and high fatty infiltration having minimal residuals especially at the water peak. Figure 3 shows the correlation analysis of MRS T2w and MRS PDFF. T2w is decreasing with increasing PDFF leading to a Pearson correlation coefficient of -0.67 (p<10-3).Discussion & Conclusion
To the best of the authors’ knowledge, 1H MRS-based T2w in high PDFF muscle regions has not been reported before. The results show that T2w of remaining muscle tissue is decreasing with increasing PDFF, especially in regions of fatty infiltration of more than 60%. The observed decrease of T2w might be related to tissue transformation during disease course or alterations in the energy exchange due to different microenvironment. Elevated T2w is currently seen as a marker for disease activity9. However, due to the typical heterogeneity of fatty-infiltrated muscles, the large MRS voxel could include edematous (with elevated T2w) as well as non-edematous (with reduced T2w) muscle tissue. Thus, the two effects could compensate each other and the overall T2w of the remaining muscle might have a T2w value similar to healthy muscle. The effect could be especially severe when the muscle tissue is highly infiltrated and heterogeneous. In conclusion, it is feasible to measure T2w with single-voxel MRS in fatty-infiltrated muscle tissue. However, when evaluating edematous changes single-voxel MRS could suffer from partial volume effects, especially when the voxel encloses edematous, non-edematous and fatty-infiltrated muscle tissue. Therefore, there is a high need for accurate and high resolution T2w mapping in patients with NMD.Acknowledgements
The present work was supported by the German Society for Muscle Diseases, the European Research Council (grant agreement No 637164 – iBack and grant agreement No 677661 – ProFatMRI) and Philips Healthcare.References
1Hollingsworth KG, de Sousa PL, Straub V, Carlier PG. Towards harmonization of protocols for MRI outcome measures in skeletal muscle studies: consensus recommendations from two TREAT-NMD NMR workshops, 2 May 2010, Stockholm, Sweden, 1-2 October 2009, Paris, France. Neuromuscular disorders: NMD. 2012;22 Suppl 2:S54-67.
2Poliachik SL, Friedman SD, Carter GT, Parnell SE, Shaw DW. Skeletal muscle edema in muscular dystrophy: clinical and diagnostic implications. Physical medicine and rehabilitation clinics of North America. 2012;23(1):107-22, xi.
3Mercuri E, Pichiecchio A, Allsop J, Messina S, Pane M, Muntoni F. Muscle MRI in inherited neuromuscular disorders: past, present, and future. Journal of magnetic resonance imaging : JMRI. 2007;25(2):433-40.
4Morrow JM, Matthews E, Raja Rayan DL, Fischmann A, Sinclair CD, Reilly MM, et al. Muscle MRI reveals distinct abnormalities in genetically proven non-dystrophic myotonias. Neuromuscular disorders : NMD. 2013;23(8):637-46.
5Karampinos DC, Yu H, Shimakawa A, Link TM, Majumdar S. T(1)-corrected fat quantification using chemical shift-based water/fat separation: application to skeletal muscle. Magnetic resonance in medicine. 2011;66(5):1312-26.
6Reeder SB, Hu HH, Sirlin CB. Proton density fat-fraction: a standardized MR-based biomarker of tissue fat concentration. Journal of magnetic resonance imaging : JMRI. 2012;36(5):1011-4.
7Burakiewicz J, Sinclair CDJ, Fischer D, Walter GA, Kan HE, Hollingsworth KG. Quantifying fat replacement of muscle by quantitative MRI in muscular dystrophy. Journal of neurology. 2017.
8Marty B, Baudin PY, Reyngoudt H, Azzabou N, Araujo EC, Carlier PG, et al. Simultaneous muscle water T2 and fat fraction mapping using transverse relaxometry with stimulated echo compensation. NMR in biomedicine. 2016;29(4):431-43.
9Carlier PG, Marty B, Scheidegger O, Loureiro de Sousa P, Baudin PY, Snezhko E, et al. Skeletal Muscle Quantitative Nuclear Magnetic Resonance Imaging and Spectroscopy as an Outcome Measure for Clinical Trials. Journal of neuromuscular diseases. 2016;3(1):1-28.
10Eggers H, Brendel B, Duijndam A, Herigault G. Dual-echo Dixon imaging with flexible choice of echo times. Magnetic resonance in medicine. 2011;65(1):96-107.
11Ruschke S, Kienberger H, Baum T, Kooijman H, Settles M, Haase A, et al. Diffusion-weighted stimulated echo acquisition mode (DW-STEAM) MR spectroscopy to measure fat unsaturation in regions with low proton-density fat fraction. Magnetic resonance in medicine. 2016;75(1):32-41.
12Dieckmeyer M, Ruschke S, Cordes C, Yap SP, Kooijman H, Hauner H, et al. The need for T(2) correction on MRS-based vertebral bone marrow fat quantification: implications for bone marrow fat fraction age dependence. NMR in biomedicine. 2015;28(4):432-9.
13Schlaeger S, Klupp E, Weidlich D, Cervantes B, Deschauer M, Schoser B, et al. T2-weighted Dixon TSE for accelerated simultaneous grading of whole body skeletal muscle fat infiltration and edema in patients with neuromuscular diseases. In proceedings of the 25th annual meeting of ISMRMHonolulu,Hawaii,USA 2017p5011.
Figures