5058
Comparison thigh skeletal muscles between snowboarding halfpipe athletes and healthy volunteers by using quantitative multi-parameter MR imaging at rest1Radiology, Shengjing Hospital of China Medical University, Shenyang, China, 2Shenyang Sport University, Shenyang, China, 3Philips Healthcare, Beijing, China
Synopsis
To quantitatively investigate thigh skeletal muscles difference between snowboarding halfpipe athletes and healthy volunteers via MRI.
Introduction
MR imaging provides a unique non-invasive diagnostic platform to quantify skeletal muscle physiological and biochemical variables at rest. MR relaxation parameters (T1, T2, T2*) are characteristic of tissue composition and metabolic changes; and fat fraction (FF) and cross-sectional area (CSA) of muscle is quantitative marker of muscle force and muscle damage.1-3 This study is to investigate thigh skeletal muscles difference between snowboarding halfpipe athletes and healthy volunteers via MRI.Methods
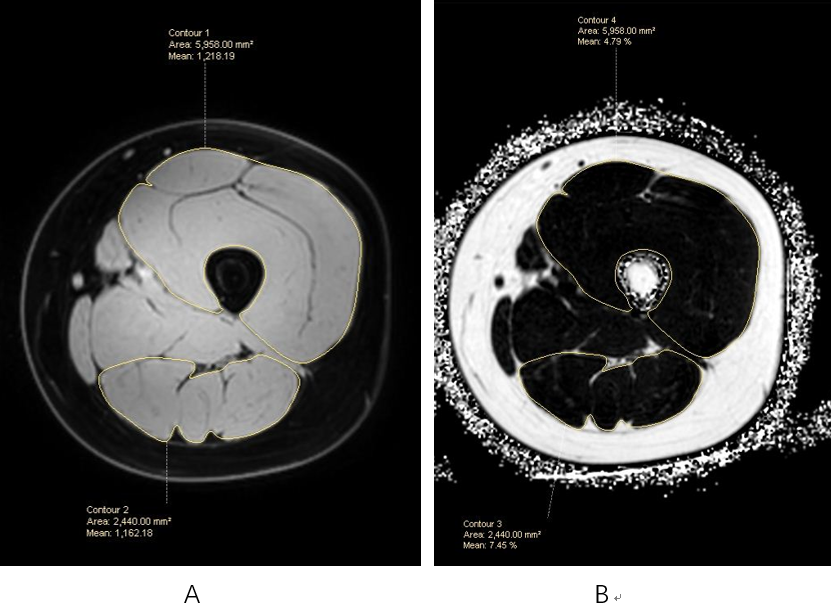
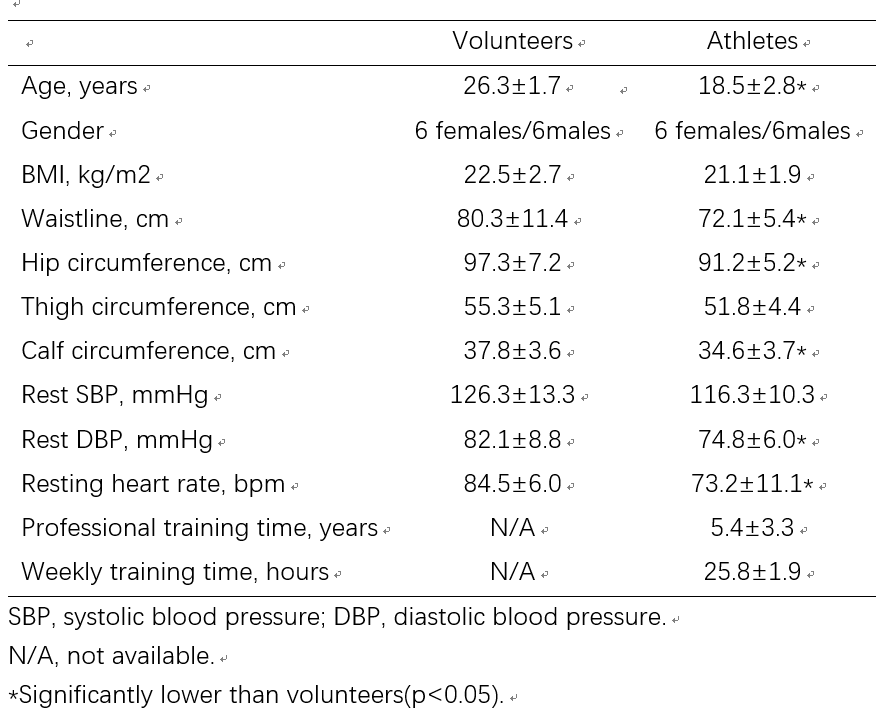
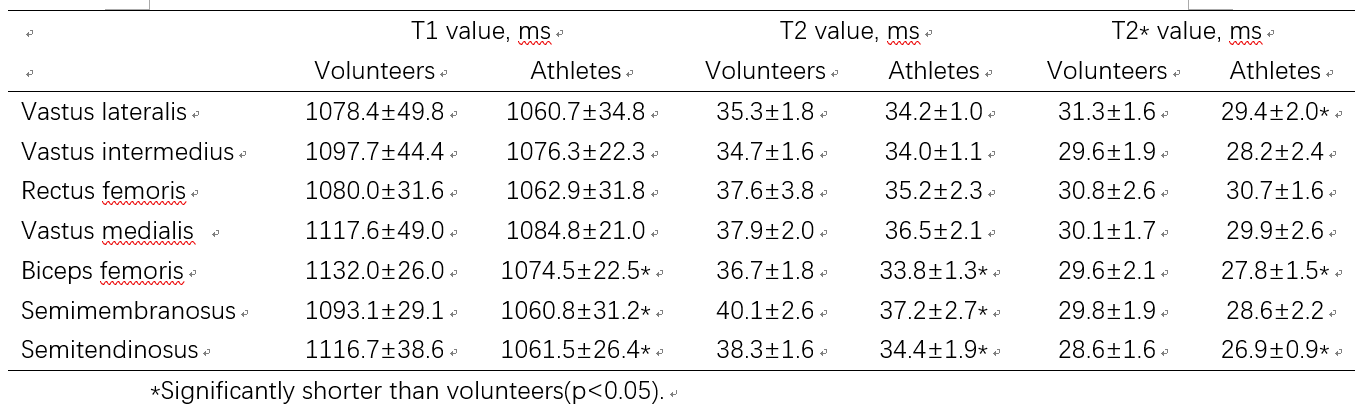
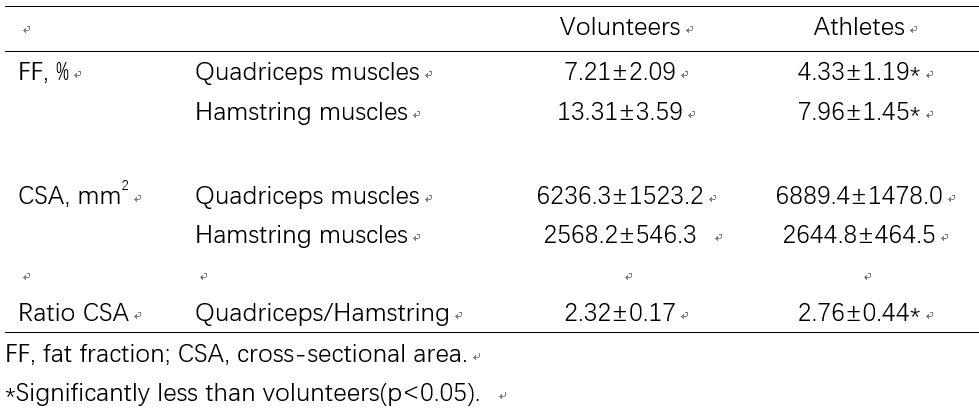
A comparative study of 12 healthy volunteers (age from 24 to 29 years, 6males) and 12 snowboarding halfpipe athletes (age from 15 to 25 years, 6males) was conducted. Demographic and physiological information for participants were collected prior imaging section. MR scanning targeted the left leg at the level of the proximal thigh on a 3.0T MR system (Philips Ingenia, Philips Medical System, the Netherlands). The CSA of quadriceps (rectus femoris, vastus intermedius, vastus medialis and vastus lateralis) and hamstring muscles (long head of biceps femoris, semimembranosus and semitendinosus) were compared between the two groups. Each subject was examined in the supine position with a phased-array body coil. Scanning ranged from the lower edge of the pubic symphysis to the distal 20cm. The scan protocol consisted of axial T1-weighted TSE sequence, coronal STIR TSE sequence and quantitative sequences. The latter included axial T1-mapping (TR/TE=2.2/1.01, slice thickness=10mm, matrix=204x148, FOV=410mmx298mm), axial T2-mapping (TR/TE=2010/n*20, slice thickness=4mm, matrix=140x229, FOV=414mmx250mm) and axial mDixon-Quant sequence (TR/TE/delta TE=9.3/1.5/1.2, flip angle=3°, echo number=6, matrix=384x254, FOV=420mmx280mm). The DICOM date of T1WI and all quantitative sequences were loaded into IntelliSpace Protal 8.0 (Philips Medical System, Netherlands) for evaluation (Figure 1,2). Statistical analysis was carried according to two independent sample t-test and Mann_Whitney test. All continuous variables were presented as mean±standard deviation (SD).Results
From body mass index(BMI) and thigh circumference, no statistical difference was found between the two group (Figure 3). The T1 and T2 of hamstring muscles were found to be significantly shorter (P<0.05) in the athlete group than the volunteer group, while they have no statistical difference in quadriceps femoris. T2* was found longer in volunteer group than the athlete group in vastus lateralis, long head of biceps femoris and semitendinosus and no statistical differences in other muscles (Figure 4). FF of muscle in the athlete group was obviously less than the volunteer group (P<0.001). Muscle CSA did not show statistical difference in subject groups, but the CSA ratio of quadriceps and hamstring muscles in athletes was greater than that in volunteer group (ratio were 2.76±0.44 and 2.32±0.17, respectively, P=0.006) (Figure 5).Discussion
In our study, the T1 and T2 relaxation times of athlete group is lower than volunteers group in hamstring muscles, while it had no statistical difference in quadriceps femoris. This result may be due to the increase in protein synthesis and glycogen reserve of athletes in hamstring muscles. Long-term muscle contraction training will lead to increased muscle force and muscle hypertrophy. Training-induced muscle hypertrophy is due to enhanced protein synthesis within the muscle fibers, mainly myofibrillar. Moreover, according to reports of biochemical studies, the levels of glycogen (66%), creatine phosphate (22%) and ATP (18%) were raised at rest after 5 months strength training on muscles.4 These macromolecules gathered in intracellular increased bound water and shorten T1 and T2 relaxation times.5 The Skeletal muscle blood oxygen level dependent (BOLD) effect observed in muscle tissue is not yet fully understood and can mainly be provoked by exercise and ischemia states, and the paramagnetic variation in MR can be measured by quantitative T2* map. T2* relaxation time changes can be attributed to changes of perfusion in the muscle microvasculature. FF of quadriceps and hamstring muscles in athlete group was obviously less than volunteers. This indicates that the absolute area and density of the muscle fibers are increased in athletes, leading to increased muscle force.6 And CSA ratio of quadriceps and hamstring muscles in athletes was greater than that in volunteer group, it shown that the average power of extensor muscle group is significantly greater than the flexor muscle group in the knee, which consistent with the results measured by the isokinetic force test system.Conclusion
The difference in MR measurements (T1, T2, T2*, FF and CSA) among athletes and control group matches the fact that athletes have stronger muscle explosive and buffer capacity; particularly the relaxation rates reflects glycogen and fibrin decomposition. Hence, these parameters reflect tissue composition and metabolic properties, and potentially indicate muscle strength.Acknowledgements
We thank Shenyang snowboarding halfpipe sports team and Philips Healthcare for the support to this study.References
1. de Sousa PL, Vignaud A, Fleury S, Carlier PG. Fast monitoring of T1, T2, and relative proton density(M0) changes in skeletal muscles using an IR-TrueFISP sequence. J Magn Reson Imaging. 2011;33(4):921-930.
2. Fischer MA, Pfirrmann CW, Espinosa N, Raptis DA, Buck FM. Dixon-based MRI for assessment of muscle-fat content in phantoms, healthy volunteers and patients with achillodynia: comparison to visual assessment of calf muscle quality. Eur Radiol. 2014;24(6):1366-1375.
3. D, Jubeau M, Gondin J. Fast measurement of the quadriceps femoris muscle transverse relaxation time at high magnetic field using segmented echo-planar imaging. J Magn Reson Imaging. 2017;45(2):356-368.
4. Curvo-Semedo L, Brito JB, Seco MF, Costa JF, Marques CB, Caseiro-Alves F. The hypointense liver lesion on T2-weighted MR images and what it means. Radiographics. 2010;30(1):e38.
5. MacDougall JD, Ward GR, Sale DG, Sutton JR. Biochemical adaptation of human skeletal muscle to heavy resistance training and immobilization. J Appl Physiol Respir Environ Exerc Physiol. 1977;43(4):700-703.
6. Fukuta S, Tsutsui T, Amari R, Wada K, Sairyo K. Tendon retraction with rotator cuff tear causes a decrease in cross-sectional area of the supraspinatus muscle on magnetic resonance imaging. J Shoulder Elbow Surg. 2016;25(7):1069-1075.
Figures