5056
Improved 3D T1rho and T2 Mapping with Synovial Fluid Suppression for the Knee Cartilage on 3T1Department of Radiology, Albert Einstein College of Medicine and Montefiore Medical Center, Bronx, NY, United States, 2Philips Healthcare, Gainesville, FL, United States, 3Department of Biomedical Engineering, Cleveland Clinic, Cleveland, OH, United States
Synopsis
T1rho and T2 values of synovial fluid are more than twenty times larger than those of the normal cartilage tissue at 3T. The potential signal contamination originated from synovial fluid within the joints adjacent to the concerned articular cartilage could be a major source of errors associated with current T1rho and T2 mapping sequences in clinical research. In this study, we presented a long-T2-selective suppression module to null synovial fluid signal while preserve cartilage signal for acquisition. Its performance in 3D continuous-wave T1rho, adiabatic T1rho, and T2 mapping sequences was evaluated in phantom and human studies.
Introduction
T1rho (T1ρ) and T2 mapping MRI techniques have been shown to be potential imaging biomarkers for the diagnosis and prognosis of osteoarthritis (OA). They could also be sensitive non-invasive evaluation tools for treatment monitoring, particularly for the early stage of cartilage change. OA cartilage generally have both increased T1rho and T2 values compared to normal cartilage. Both technique, however, are compromised by the potential contaminations of the large T1rho and T2 (more than twenty times compared to that of cartilage) of synovial fluid (SF) adjacent to the cartilage, typically more abundant for OA patients. T1rho and T2 values of cartilage can be artificially increased due to partial-volume effect along both slice and phase-encode directions, as well as potential imaging blurring due to transient effect along the phase encode direction(s) when multiple acquisitions are performed after one shared T1rho or T2 preparation. Traditional inversion recovery techniques can be prohibitively time-consuming with severely compromised SNR. We presented earlier a fast SF suppression (SFS) approach and verified its feasibility in traditional continue-wave T1rho (CW-T1rho) mapping on human knee at 3T [1]. Here we present its phantom and human test results on CW-T1rho, adiabatic T1rho (adiab-T1rho) mapping, and T2 mapping sequences and compare with their traditional non-SF suppressed (non-SFS) counterparts [2].Methods
To suppress SF while preserve as much cartilage signal, a T2-preparation module (with TE=100ms) followed by an inversion recovery RF pulse was employed here. The combination of the pulse sequence train generates an effective saturation pulse (~90°) for relatively short T2 tissue (i.e., cartilage), and an inversion pulse (~180°) for long T2 species (i.e., SF) [3]. CW-T1rho, adiabatic pulse train-T1rho, and T2-preparation were applied before 3D gradient-echo data acquisitions and corresponding T1rho and T2 maps were generated. Bloch simulation was performed to optimize sequence timing to achieve maximum SNR efficiency for the cartilage. The optimal cycle time was determined to be around 3400 ms for non-SFS, and 5000 ms for SFS T1rho and T2 sequences with TI=1480ms. All imaging was performed on a 3T Philips Achieva clinical MR scanner with an 8-channel knee coil. The CW-T1rho preparation module had 90°-SL/2-180°-SL/2-90° RF pulse train, with spin lock B1=500Hz and TSL=0, 40, 40ms. The adiab-T1rho preparation module had adiabatic HS-8 pulse trains with TSL=5, 65, 85ms, and the T2 preparation module had TE=0, 24, 48ms. More details of the 3D imaging parameters can be found in [1]. Both SFS and non-SFS sequences were tested on an agar phantom and asymptomatic human subjects. The scan duration was about 7:40 min for the SFS scans, and about 5:07 min for the non-SFS scans.Results
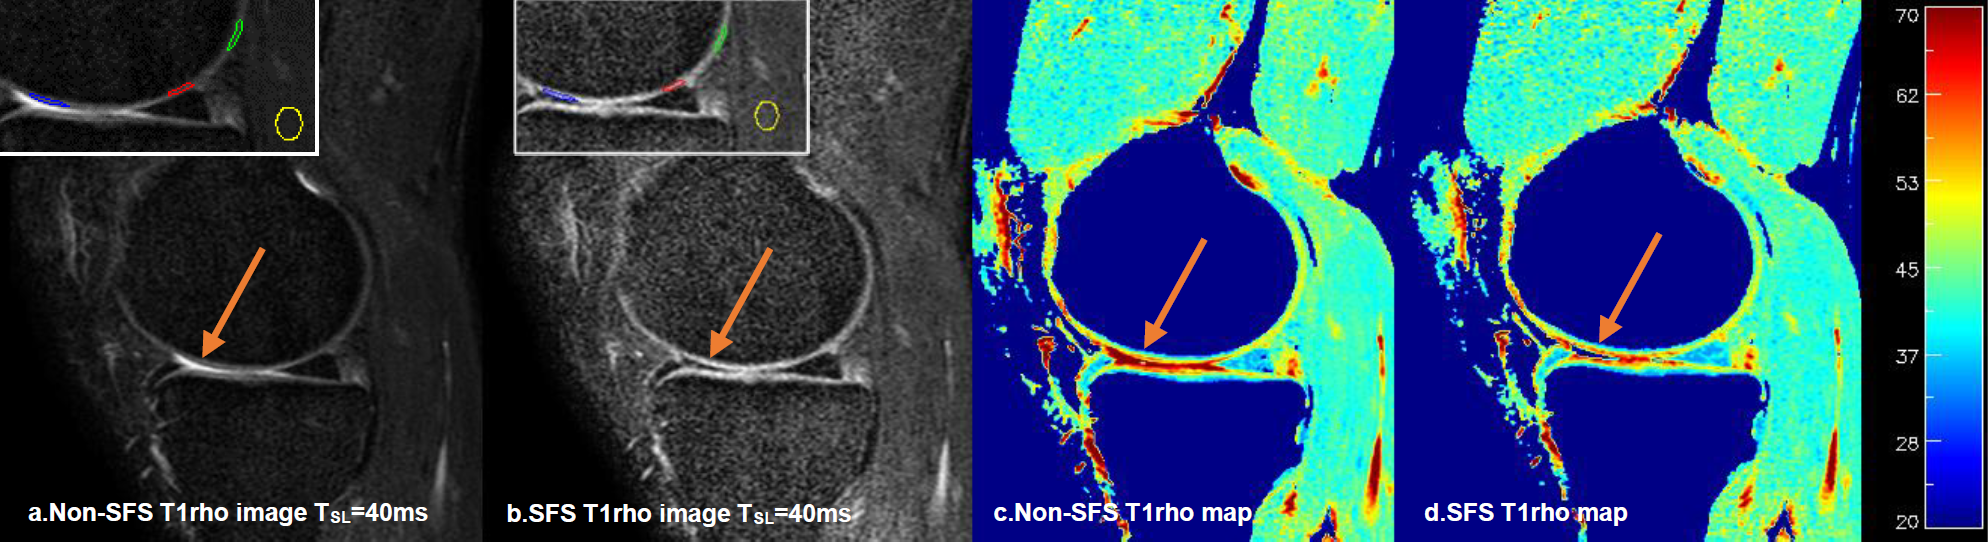
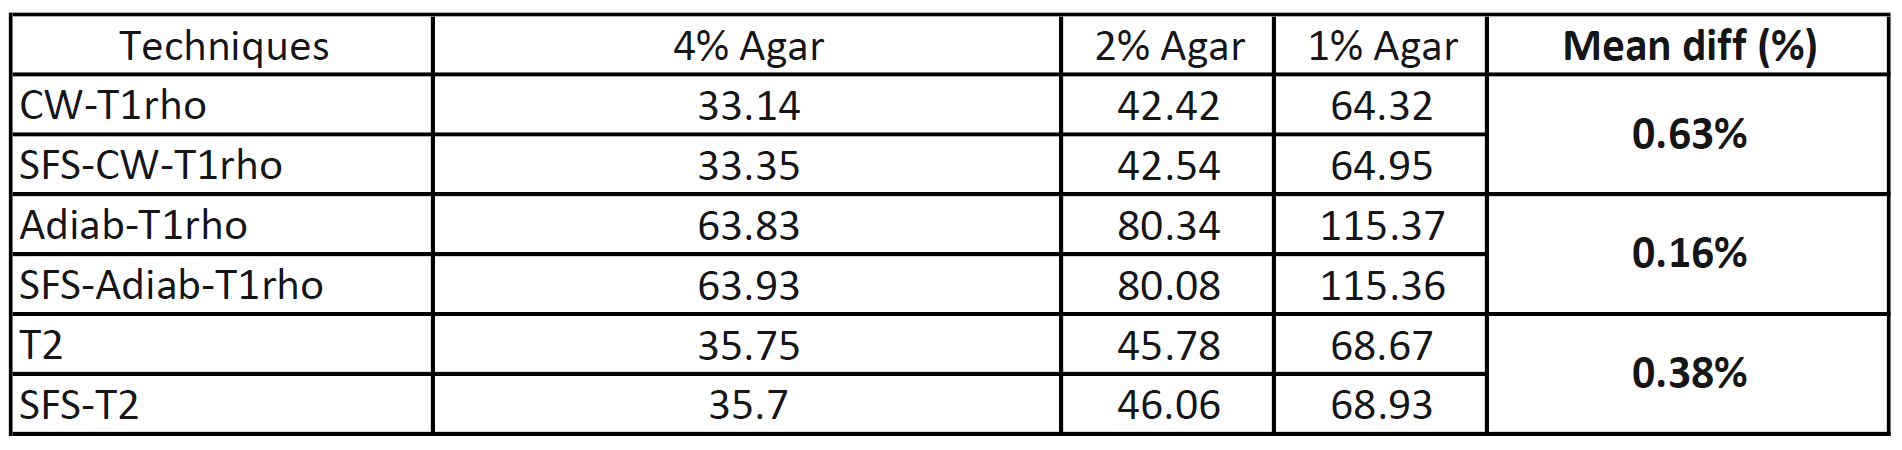
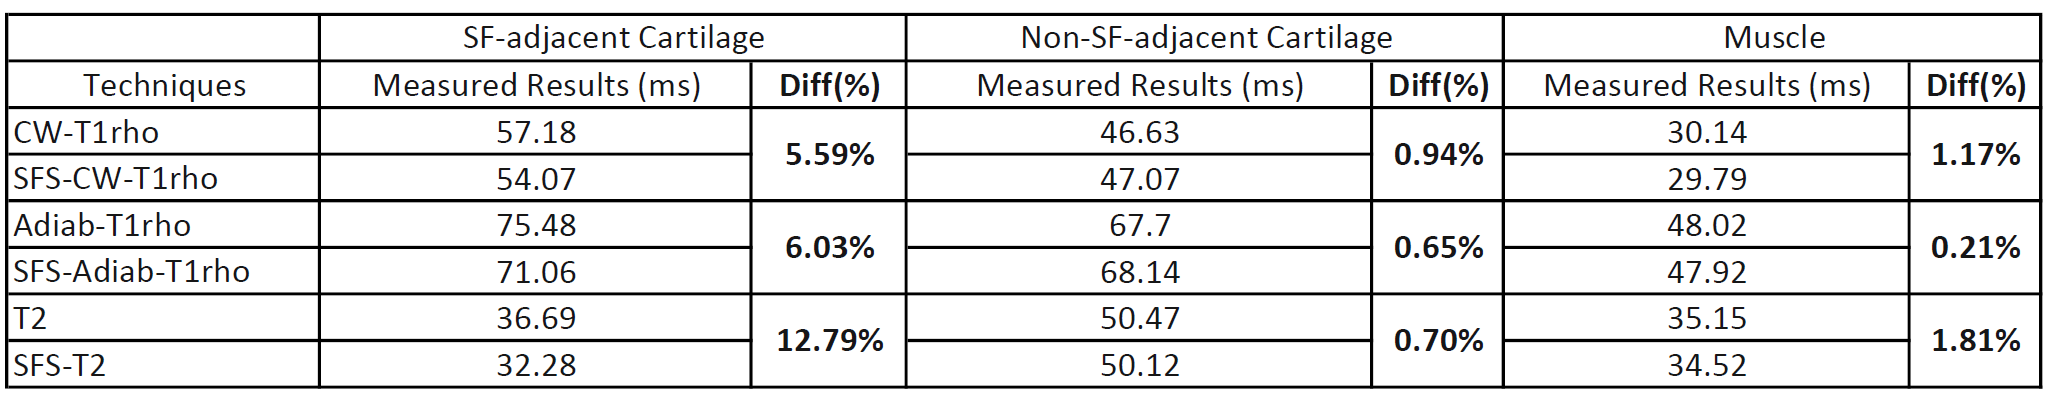
Phantom results showed highly consistent quantitative results (mean difference all under 0.7%) using SFS and non-SFS for all CW-T1rho, adiab-T1rho, and T2 mapping sequences, as summarized in Table 1. Typical SF-to-cartilage (middle layer) contrast changed from ~2.5 on the non-SFS images to ~0.4 on the SFS CW-T1rho images with TSL=40ms, as shown in Figure 1a, b. Region of interests (ROIs) were drawn on superficial layer of the cartilage areas adjacent to (but not including) SF, and cartilage areas not adjacent to SF (See Figure 1a, b). Mean CW-T1rho, adiab-T1rho, and T2 values on ROIs adjacent to SF were all more than 5% higher measured from the non-SFS sequence, compared to the SFS sequence. The corresponding values from ROIs not adjacent to SF were comparable between non-SFS and SFS sequences (less than 1% difference). Mean values on muscle ROIs were also comparable between non-SFS and SFS sequences (all less than 2% difference). See Table 2 for detailed human study results.
Discussion
It is shown in this work that this SFS approach can be used as a general solution for 3D CW-T1rho, adiab-T1rho, or T2 mapping techniques for improved quantitative cartilage imaging. With this technique, high-resolution 3D T1rho mapping with SFS can be obtained on clinical 3T scanners within reasonably acceptable scan duration. SFS is particularly important to generate high quality quantitative cartilage maps in the segmented gradient echo sequences where part of the k-space acquisitions are acquired during signal transient phase. With SFS, potential signal contaminations on the superficial layer of the cartilage from very strong SF signal can be minimized, so that T1rho or T2 measurements can be more accurate and consistent, as shown in this study. It may also dramatically reduce the measurement variability in longitudinal clinical studies by suppressing the impact of the change of SF over time surrounding the cartilage. This improved technique for T1rho and T2 mapping techniques may facilitate their clinical applications, particularly in evaluating early cartilage changes at the superficial layer of the cartilage, and in monitoring of therapeutic interventions.Acknowledgements
No acknowledgement found.References
1. Peng Q, et al, Fast Synovial Fluid Suppressed 3D T1ρ Imaging of the Knee Cartilage on 3T. in ISMRM Workshop on Advanced Musculoskeletal MRI (2017). 2. Li X, et al. MRM 2008;59:298–307. 3. Wong EC, et al, MRM 2001:45:529–532Figures