5055
Texture features from T2 mapping of talar dome cartilage in normal volunteers and dancers1Radiological Sciences, University of California, Irvine, CA, United States, 2Science and Health in Artistic Performance, Ohio University, Athens, OH, United States, 3Arts-Dance, University of California, Irvine, CA, United States
Synopsis
This study demonstrates a feasibility of texture analysis based on T2 mapping of the talar-dome cartilage. Some of the investigated texture features showed statistically significant differences between healthy volunteers and ballet dancers that are regional in nature and also very much dependent on how the spatial distribution of T2 pixels is defined during calculation of texture features. More conventional analytic approach, such as comparison based on cartilage-averaged T2 value, failed to show any difference between the groups. The results in this study demonstrate an alternative analytical approach based on texture features as surrogate variables for the evaluation of cartilage properties.
Purpose:
Many dancers begin their training several years before skeletal maturity. This causes ankle pain, and can lead to ankle arthritis in experienced ballet dancers. However, ankle problems of dancers are often treated sub-clinically and MRI is rarely used for diagnosis, despite its superior soft-tissue contrast and non-invasive nature. Quantitative assessment of degenerative changes in cartilage based on T2 mapping is becoming a widely used MRI technique that has been previously utilized in study of the articular cartilage, which usually relies on calculation of arithmetic means of T2 relaxation time within regional or entire cartilage-based region of interest (ROI). Analysis based on texture features describes the spatial distribution of relaxation times within ROI and already has demonstrated its value as surrogate variables in various imaging studies.1-3 The purposes of this study were to present texture features from T2 mapping of talar dome cartilage and assess their value as surrogate variables that are capable of differentiating dancers from age-matched volunteers.Materials and Methods:
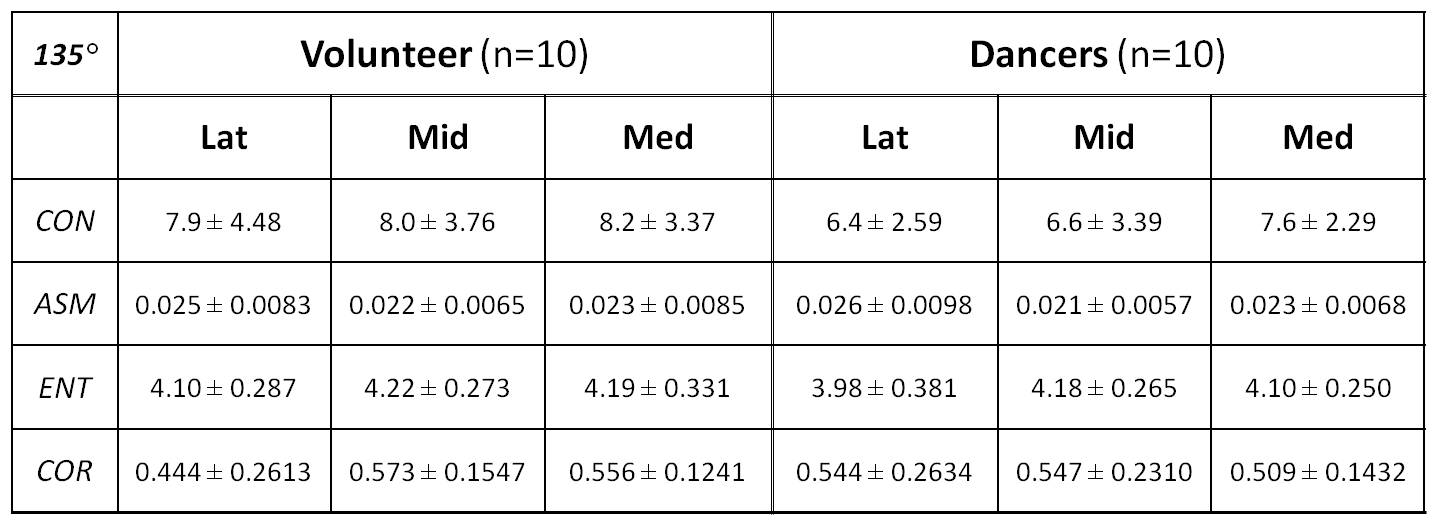
The study protocol was approved by the institutional review board, and all subjects gave written informed consent. Ten healthy female volunteers (mean: 20.4 yrs, range: 19-24) and 10 dancers (mean: 21.7 yrs, range: 19-30) were enrolled and scanned, with an equal number of left and right ankles in each group. All MR studies were performed on a 3T scanner (Achieva, Philips Healthcare, Netherlands) using an 8-channel, dedicated ankle/foot coil. T2 mapping was performed in sagittal orientation using FOV, image-matrix, number of slices, and slice-thickness set at 140mm, 512, 20, and 3mm, respectively. T2 mapping was based on 2D TSE sequence with 7 different echo times (TEs: 13-91 in steps of 13 ms). Manual cartilage segmentation of the entire talar dome on randomized T2 images was performed by one experienced radiologist using MIPAV package (National Institute of Health, Bethesda, Maryland, USA). Texture features based on GLCM4 (Gray-Level Co-occurrence Matrix) were generated for each segmented slice using a custom software in Matlab (MathWorks, Natick, USA). Four of the most common texture features were obtained from the 5 mid-segmented slices: contrast (CON), angular second moment (ASM), entropy (ENT), and correlation (COR), based on each of the four available pixel-offset definitions at 0°, 45°, 90°, and 135°. The texture features and cartilage averaged T2 values were compared between the volunteers and dancers using 3 of the 5 mid-slices: the most medial (Med), the middle (Mid), and the most lateral (Lat).Results:
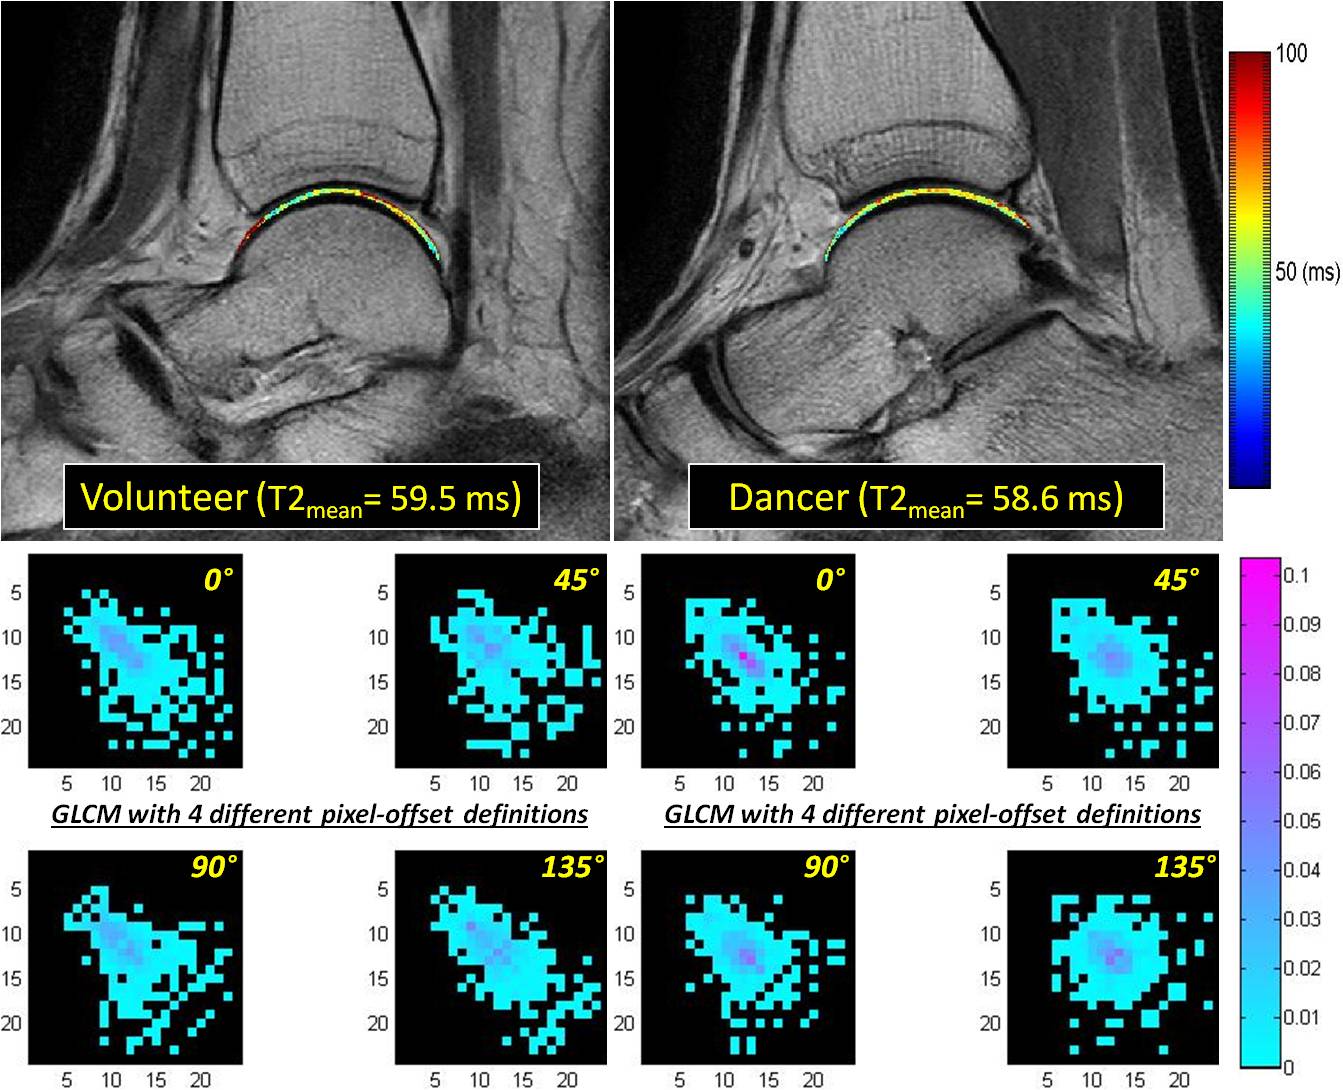
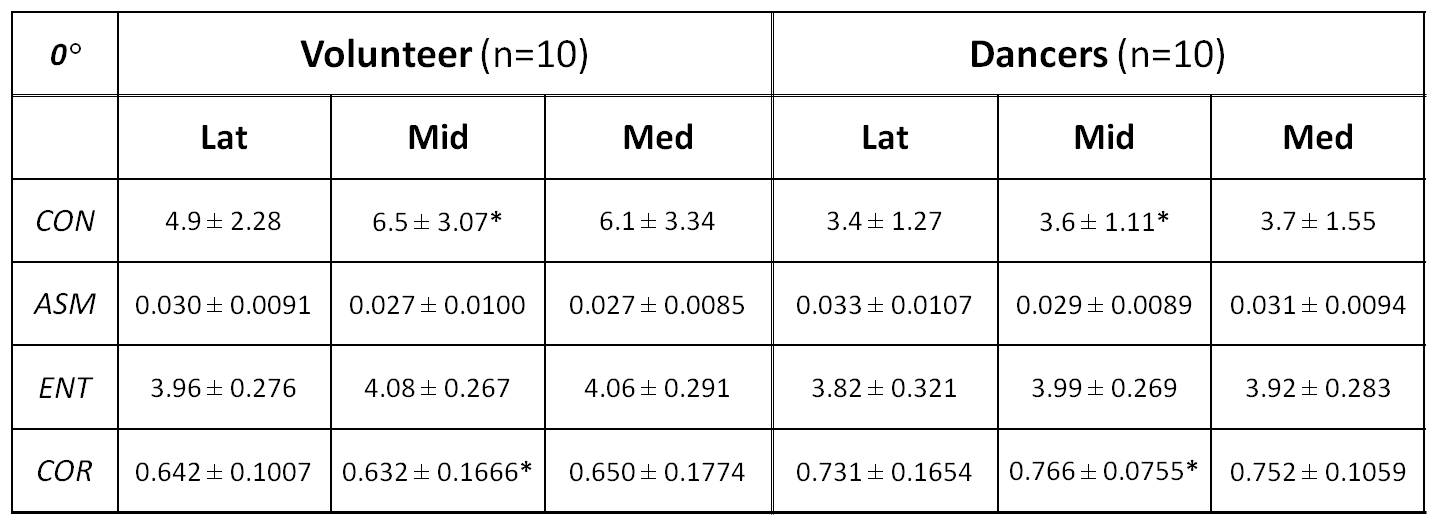
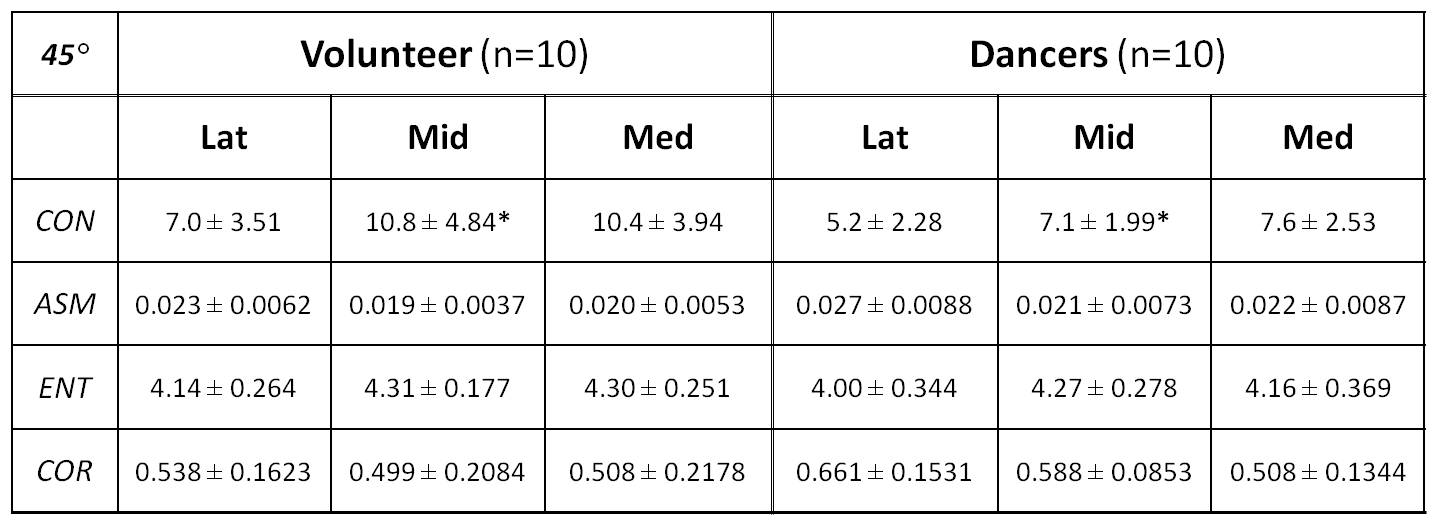
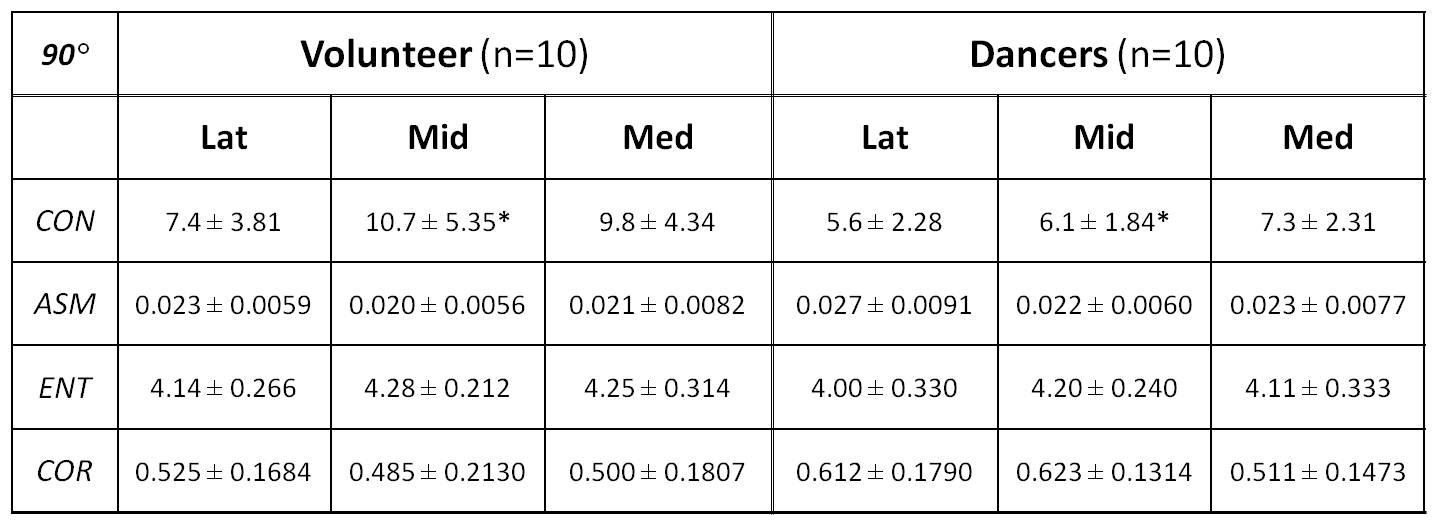
Cartilage segmentation was demonstrated in T2 images along with the corresponding talar dome T2 map overlaid, as shown in top row of Fig. 1 for a volunteer and dancer, respectively. Normalized GLCM created from each of the talar-dome T2 maps with 4 different pixel-offset definitions are shown in bottom row of Fig. 1 for the same 2 slices. The GLCM clearly demonstrates its dependency on pixel-offset definition. None of the cartilage-averaged T2 values [ms] were significantly different between the volunteers (V) and dancers (D): 50±5.6 (V) vs. 55±7.7 (D) in Lat, 53±3.5 (V) vs. 55±4.8 (D) in Mid, 53±3.4 (V) vs. 55±4.5 (D) in Med. Group-averaged texture features based on cartilage T2 relaxation time from the 3 slices (Med, Mid, Lat) are summarized in Tables 1-4 for each of the 4 pixel-offset definitions. A statistically significant (P < 0.05) difference between the volunteers and dancers was observed for two of the 4 texture features (CON & COR) only in the middle slice (Mid), which also was pixel-offset dependent.Discussion:
Three out of the 4 texture features investigated in this study, CON, ASM, and COR, can be considered as classifiers that express visual textual characteristics of the image. CON measures the local variations, and COR measures the linear dependencies in grey-level. ASM measures the image homogeneity. ENT, which is based on information theory, is a measure of disorder or randomness in grey-level. Pixel-offset during GLCM creation defines the direction along which two adjacent pixels are considered as pixel pairs: 0° along A/P, 45° along the 45-degree diagonal direction off of A/P, 90° along S/I, and 135° along the 45-degree diagonal direction off of S/I in sagittal orientation. Despite the small sample size, texture analysis was able to demonstrate differences in ballet dancers that were regional and depended on pixel-offset definition when compared to age-matched healthy volunteers. However, more conventional analytical approaches, such as comparing group difference based on cartilage-averaged T2 values, failed to demonstrate any differences.Conclusion:
This study demonstrates a feasibility of texture analysis based on T2 mapping of the talar dome cartilage using normal volunteers and ballet dancers.Acknowledgements
No acknowledgement found.References
1. Nie K, Chen JH, Yu HJ, et al. Quantitative Analysis of Lesion Morphology and Texture Features for Diagnostic Prediction in Breast MRI. Acad Radiol. 2008;15(12):1513-1525.
2. Kruggel F, Paul JS, Gertz HJ. Texture-based segmentation of diffuse lesions of the brain’s white matter. Neuroimage. 2008;39(3):987-996.
3. Lv D, Guo X, Wang X, et al. Computerized characterization of prostate cancer by fractal analysis in MR images. J Magn Reson Imaging. 2009;30(1):161-168.
4. Castellano G, Bonilha L, Li LM, et al. Texture analysis of medical images. Clinical Radiology. 2004;59(12):1061-1069.
Figures