5054
Sodium Imaging of Untreated Cartilage Lesions in the Knee Joint: 3-months and 6-months Follow-up Study at 7T1High Field MR Center, Department of Biomedical Imaging and Image-Guided Therapy, Medical University of Vienna, Vienna, Austria, 2Research Unit of Medical Imaging, Physics and Technology, University of Oulu, Oulu, Finland, 3CD Laboratory for Clinical Molecular MR Imaging, Vienna, Austria, 4Department of Orthopaedics, Medical University of Vienna, Vienna, Austria, 5Novartis Institutes for Biomedical Research, Basel, Switzerland, 6Division of Radiological Physics, Department of Radiology, University of Basel Hospital, Basel, Switzerland, 7Department of Traumatology, Medical University of Vienna, Vienna, Austria, 8Medical Research Center, University of Oulu and Oulu University Hospital, Oulu, Finland, 9Department of Diagnostic Radiology, Oulu University Hospital, Oulu, Finland
Synopsis
Sodium MRI was used for the follow-up of patients with cartilage lesions at 7T. MRI was obtained at baseline, 8-days, 3-months and 6-months follow-up. Regions-of-interest evaluations were performed in weight-bearing, non-weight-bearing and lesion area of femoral cartilage. Sodium values were significantly lower in lesion than in weight-bearing and non-weight-bearing regions at all follow-up measurements. On the other hand, weight-bearing and non-weight-bearing cartilage regions showed stable sodium values over the follow-up time. Sodium imaging allows noninvasive in vivo monitoring of changes in cartilage GAG content and thus can be useful for the evaluation of cartilage degeneration or cartilage regenerating therapies.
Introduction
Cartilage degeneration is a complex and not entirely understood process. It is generally accepted that biochemical alterations in the extracellular matrix of cartilage (e.g. loss of glycosaminoglycans (GAG)) precede morphological changes. MRI techniques able to detect the onset of cartilage degeneration are therefore very attractive for studies aiming to reverse this degeneration cascade. Noninvasive sodium MRI proved to be sensitive to changes in the cartilage GAG concentration.(1) Sodium imaging was previously used for the evaluation of cartilage in patients after cartilage repair surgery(2) and in patients with osteoarthritis(3). The present 7T study aims to perform cross-sectional and longitudinal evaluation of different cartilage regions in patients with untreated low-grade chondral lesions during the period of 6 months.Methods
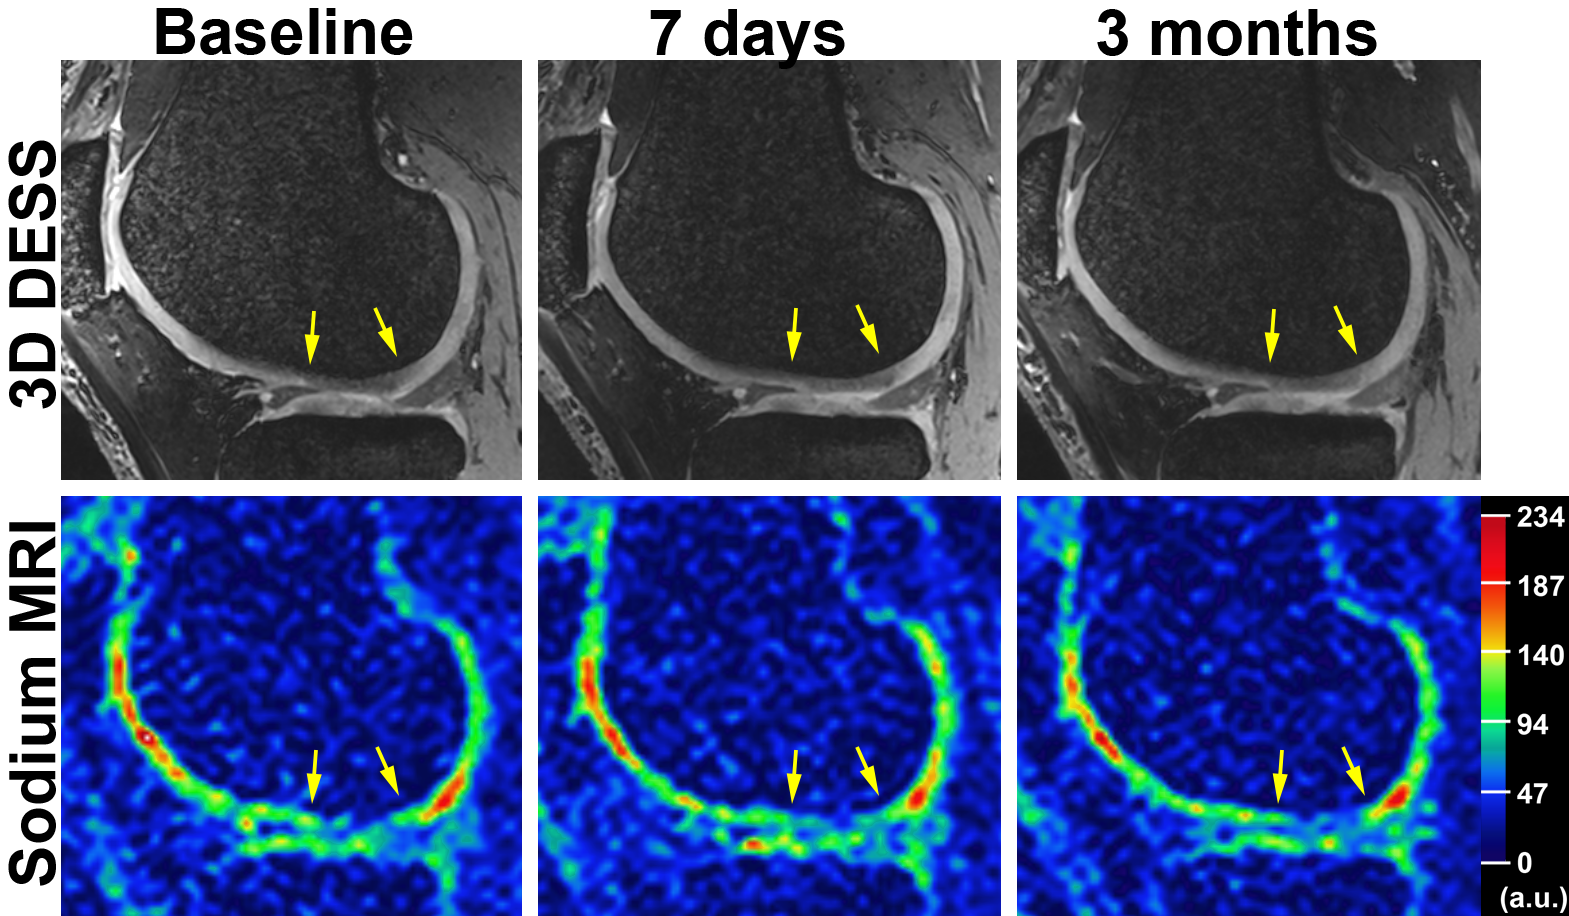
This study was approved by the Institutional Review Board. Thirteen patients (7 females; mean age, 49 years; mean BMI, 25.3 kg/m2; 9 right knees) with risk factors for cartilage lesion (e.g. knee injury, partial meniscectomy) were prospectively enrolled in this follow-up study. Most focal cartilage lesions (ICRS Grade I or II) were located in weight-bearing femoral cartilage (6 at lateral and 6 at medial condyle). All MRI measurements were performed on a 7T system (Siemens Magnetom, Erlangen, Germany) at different follow-up times: baseline, 7-days, 3-months, 6-months. Sodium images were acquired using a 15-channel sodium-only knee array coil and a 28-channel knee array coil was used for proton imaging (both from Quality Electrodynamics, Cleveland, OH, USA). For sodium MRI measurements, a spoiled gradient echo sequence with variable echo times was employed(4): TEMIN/TEMAX= 1.22/1.82 ms; TR= 9.2 ms; resolution= 1.6×1.6×3.0 mm3; bandwidth= 100 Hz/pixel; flip angle= 51°; measurement time= 25 min) (Fig. 1). For morphological evaluation of cartilage, 3D DESS was measured: TR= 8.68 ms; TE= 2.55 ms; resolution= 0.5 mm isotropic; measurement time= 3:58 min (Fig. 1). All sodium images were corrected for the spatially variable sensitivity of the knee coil using sodium images of a homogeneous phantom. The cartilage lesion in each patient was identified on routine 3T morphological images by an expert musculoskeletal MRI radiologist. Furthermore, the same expert marked the lesion on the corresponding DESS images obtained at 7T. Region-of-interest (ROI) evaluations were performed in the lesion area, in weight-bearing and in non-weight-bearing area of normally-appearing femoral condyle (opposite to the condyle containing lesion). All ROIs were manually selected on the DESS images and transferred to the corresponding sodium images. Finally, mean sodium signal intensities from ROIs were corrected for partial volume effects using the cartilage thickness from DESS images as described by Moon and colleagues(5) to calculate corrected signal intensities (cSI). For statistical evaluations, analysis of covariance models with pair-wise comparisons was calculated.Results
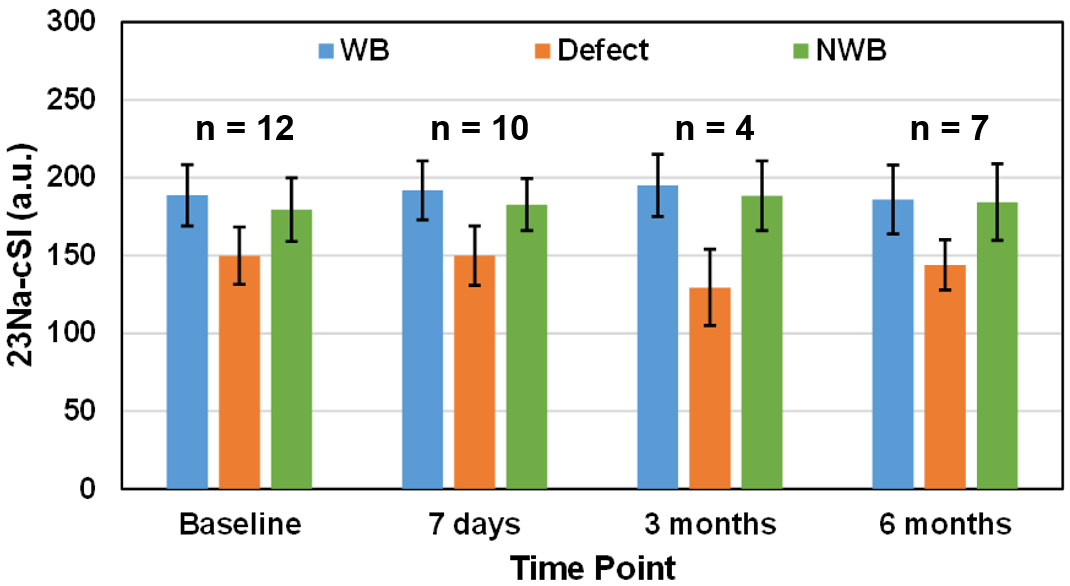
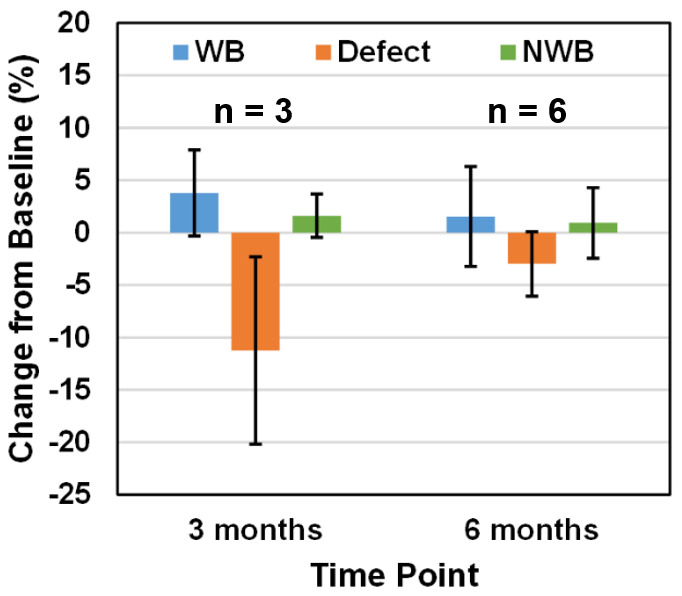
The cross-sectional comparison between different cartilage ROIs was performed (Fig. 2). Sodium cSI values in the lesion site were significantly lower than in weight-bearing and non-weight-bearing regions at all follow-up times (all p-values < 0.01). No statistically significant differences were found between weight-bearing and non-weight-bearing regions at any of the follow-up intervals. The longitudinal comparison was performed by evaluating the change from baseline calculated as percentage difference in sodium cSI values between baseline and 3-months or 6-monthts follow-up measurements (Fig. 3). A significant decrease in sodium cSI values (~11%) was observed in lesion area at 3-months follow-up (p < 0.01). However, no significant change from baseline was found in lesion ROIs at 6-months follow-up. Stable sodium cSI values were observed between the baseline, 3-months and 6-months measurements in weight-bearing and non-weight-bearing regions.Discussion
Our results demonstrate that sodium MRI can be used to distinguish between untreated low-grade chondral lesions and normal-appearing cartilage. Furthermore, stable sodium cSI values in weight-bearing and non-weight-bearing regions suggest that the GAG content did not change during follow-up measurements. Although significantly lower sodium cSI values were found in lesion ROIs at 3-months, no significant change was found at 6-months follow-up. This discrepancy could be due to drop-out of some patients for 3-months follow-up or due to the different time intervals between the baseline measurement and the time of injury in different patients.Conclusion
The results of this study indicate that sodium imaging is a robust method suitable for the noninvasive monitoring of cartilage in patients with low-grade chondral lesions. Sodium imaging may therefore serve as a valuable noninvasive method for the follow-up of changes in cartilage GAG content during the process of cartilage degeneration or during the evaluation of novel therapies for cartilage regeneration.Acknowledgements
No acknowledgement found.References
1 Borthakur A., et al., Sensitivity of MRI to proteoglycan depletion in cartilage: comparison of sodium and proton MRI. Osteoarthritis Cartilage. 2000; 8: 288-93.
2 Zbyn S, et al., Evaluation of native hyaline cartilage and repair tissue after two cartilage repair surgery techniques with 23Na MR imaging at 7 T: initial experience. Osteoarthritis Cartilage. 2012; 20: 837-45.
3 Madelin G., et al., Articular Cartilage: Evaluation with Fluid-suppressed 7.0-T Sodium MR Imaging in Subjects with and Subjects without Osteoarthritis. Radiol. 2013; 268, 481-91.
4 Deligianni X., et al., High-Resolution Fourier-Encoded Sub-Millisecond Echo Time Musculoskeletal Imaging at 3 Tesla and 7 Tesla. Magn Reson Med. 2013; 70, 1434-39.
5 Moon C.H., et al., Quantitative 23Na MRI of Human Knee Cartilage Using Dual-Tuned 1H/23Na Transceiver Array Radiofrequency Coil at 7 Tesla. J Magn Reson Imaging. 2013; 38, 1063-72.
Figures