5053
Accelerated T1ρ Dispersion Data Acquisition for Correlation Time Mapping of Cartilage at 3T1Research Unit of Medical Imaging, Physics and Technology, University of Oulu, Oulu, Finland, 2Medical Research Center, University of Oulu and Oulu University Hospital, Oulu, Finland, 3Department of Diagnostic Radiology, Oulu University Hospital, Oulu, Finland, 4Department of Applied Physics, University of Eastern Finland, Kuopio, Finland, 5Clinical Imaging Center, Kuopio University Hospital, Kuopio, Finland
Synopsis
Correlation time (τc) is novel MRI parameter that can be calculated from time demanding dispersion measurements of longitudinal relaxation times in the rotating frame (T1ρ). Therefore methods able to accelerate data acquisition are needed for τc mapping of cartilage in vivo. Present results demonstrate that partial k-space acquisition and Parallel Imaging can reduce imaging time while having small influence on τc values. Although long TurboGRE readout train significantly decreases τc values, it allows the τc mapping of cartilage in clinically acceptable measurement times. The τc mapping may therefore serve for the noninvasive in vivo evaluation of cartilage at 3T.
Introduction
Novel MRI parameter, correlation time (τc), has recently demonstrated its sensitivity to changes in macromolecular composition of articular cartilage in the in vitro studies at 9.4 Tesla.(1,2) Unfortunately, time demanding dispersion measurements of longitudinal relaxation times in the rotating frame (T1ρ) are necessary for the τc mapping of cartilage. Therefore methods able to accelerate data acquisition (e.g. Parallel Imaging, partial k-space acquisition, long readout trains) are needed for τc mapping of cartilage in vivo. The aim of this study is to evaluate i) different T1ρ magnetization preparation modules, ii) influence of methods for accelerated T1ρ data acquisition on τc mapping of cartilage samples at 3T.Methods
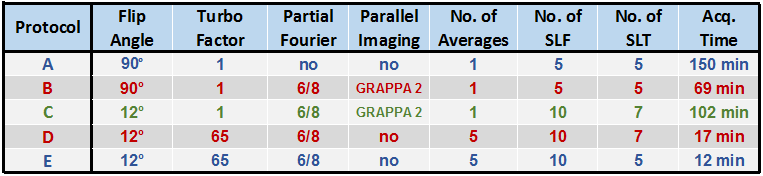
Three human osteochondral samples acquired during knee joint replacement and four cylindrical agarose phantoms (1.4, 1.9, 2.9, 3.9% of weight) were used for the evaluation of T1ρ sequences and measurement protocols. Two versions of continuous wave (CW) Refocused Rotary Echo T1ρ magnetization preparation(2) were programmed in IDEA (VE11C, Siemens Medical Solutions) and implemented into the Spoiled Gradient Echo sequence. In -Z preparation, magnetization is flipped along –Z axis, while in +Z preparation, magnetization is flipped along +Z axis at the end of the T1ρ magnetization preparation block. All MRI measurements were performed on a 3 Tesla MR system (Siemens Skyra, Erlangen, Germany) using a 15-channel knee array coil (Quality Electrodynamics, Cleveland, OH, USA). For morphological reference, T2-weighted 3D DESS images were measured. Different CW T1ρ sequences with +Z and –Z preparation were acquired with following constant measurement parameters: TR= 3300 ms; TE= 3.35 ms; resolution= 1.6×1.6×3.0 mm3; field-of-view= 79×79 mm2; bandwidth= 330 Hz/pixel. The T1ρ dispersion data were acquired by varying spin-lock times (TSL) from 0 to 100 ms and spin-lock frequencies (SLF) from 0 to 800 Hz. In order to evaluate the influence of methods for accelerated data acquisition on the T1ρ dispersion and τc mapping of cartilage, five different measurement protocols (Protocol A, B, C, D and E) with +Z preparation were compared (more details in Fig. 1). All T1ρ maps were fitted pixel-by-pixel using two-parametric mono-exponential function. The τc maps were calculated by fitting the T1ρ dispersion data to a Lorentzian function(3)
$$\frac{1}{T_{1\rho}} = \frac{3A \tau_c}{1+4\omega_{SL}^{2}\tau_c^{2}}+B$$
where A, B and τc are the fitting parameters. All maps were calculated using in-house written Matlab scripts. The T1ρ dispersion data obtained with the protocol E were further used to investigate the influence of reducing the number of SLF on τc mapping. The τc maps resulting from all possible combinations for certain number of SLF were compared pixel-by-pixel to reference data-set (10 SLF). The percentage of the absolute mean difference between the tested map and reference τc map was used to find optimal set of SLF.
Results
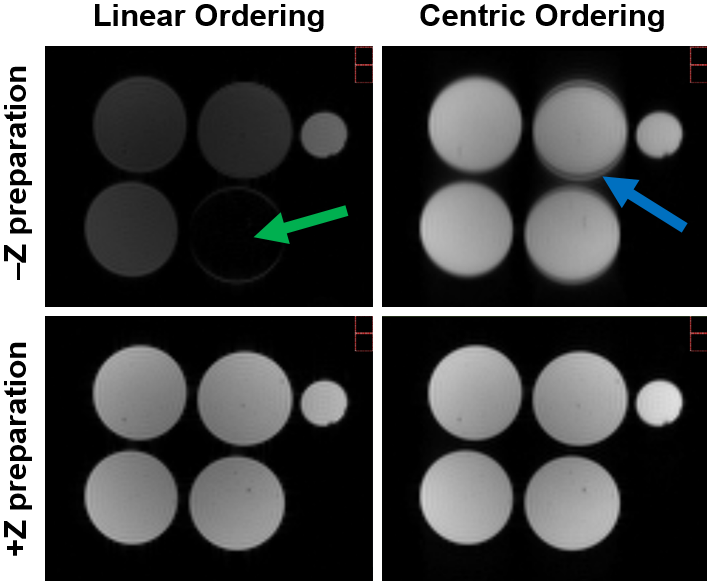
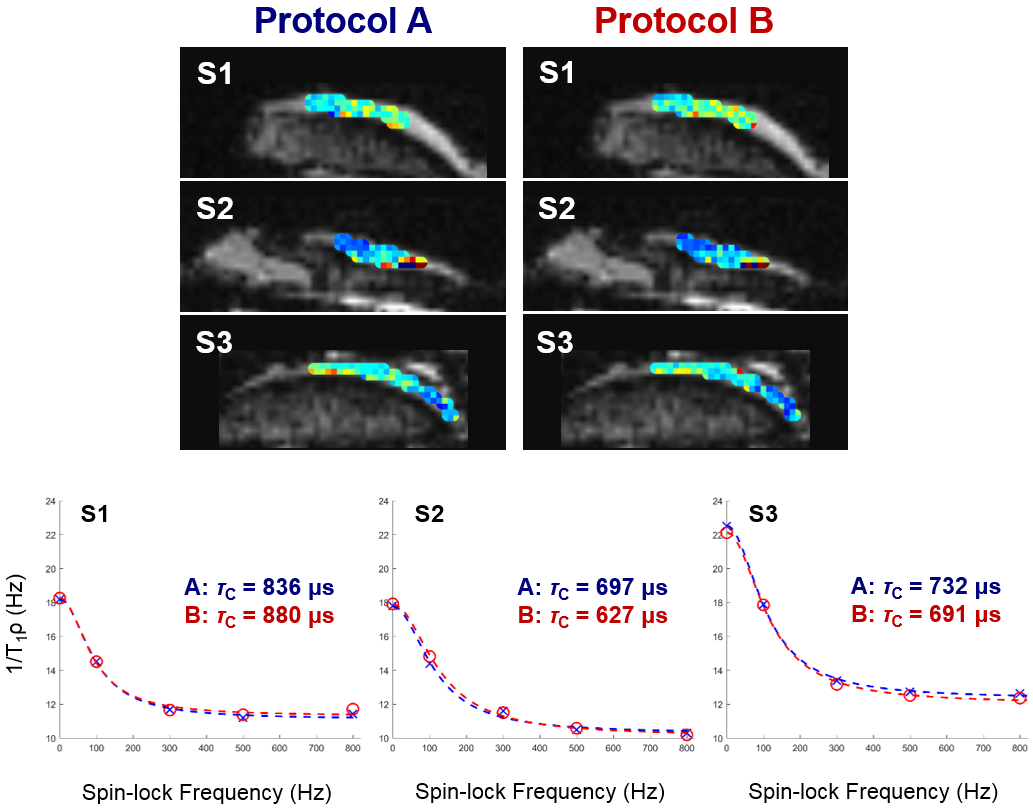
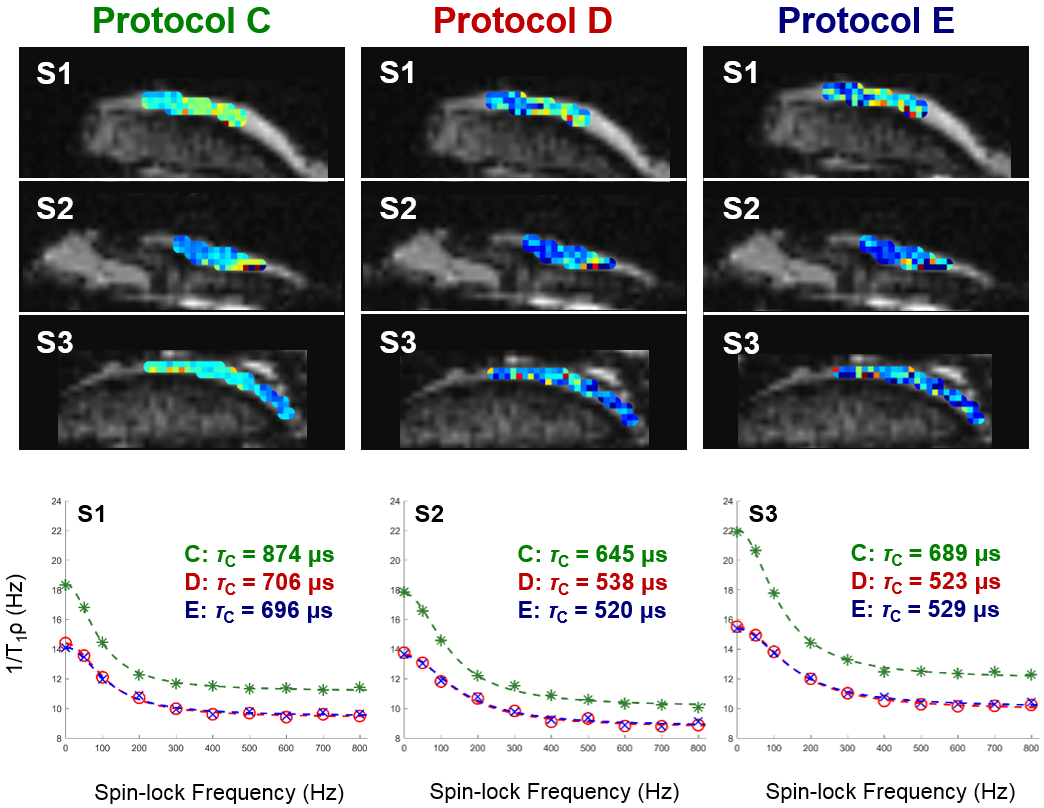
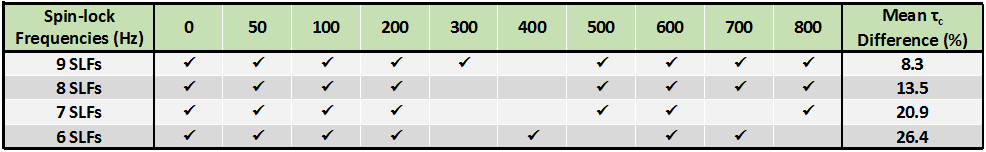
Since –Z magnetization preparation is prone to imaging artifacts when combined with long TurboGRE readout trains (Fig. 2), further evaluations were performed with +Z magnetization preparation module. Employing Parallel Imaging and Partial Fourier (Protocol B vs. A) resulted into small change in mean τc values of individual osteochondral samples (Sample1: 6%; Sample2: 6%; Sample3: 4%) (Fig. 3). Significant decrease in mean τc values of samples was found when employing long TurboGRE readout trains (Protocol D vs. C) (Sample1: 19%; Sample2: 28%; Sample3: 28%) (Fig. 4). No large differences were observed when comparing τc values calculated from T1ρ maps acquired with seven (0, 10, 20, 40, 60, 80, 100 ms, Protocol D) and five TSL (0, 20, 40, 60, 100 ms, Protocol E) (Sample1: 1%; Sample2: 1%; Sample3: 4%) (Fig. 4). The optimal set of T1ρ dispersion data using 9, 8, 7 and 6 SLF resulted in τc maps with absolute mean difference of 8, 14, 21 and 26% compared to reference data, respectively (Fig. 5). Here, 300 and 400 Hz SLF had small effect on resulting τc values (Fig. 5).Discussion
Our results demonstrate that methods for accelerated data acquisition such as Parallel Imaging and partial k-space acquisition can reduce imaging time to less than half while having small influence on the T1ρ dispersion and τc values in cartilage. Although long TurboGRE readout train significantly decreases τc values, it also reduces acquisition time and allows the τc mapping of cartilage in clinically acceptable measurement times. Careful selection of SLF for T1ρ dispersion measurements can further decrease acquisition time with little effect on τc values.Conclusion
The methods for accelerated acquisition of T1ρ dispersion data allow τc mapping of cartilage in clinically acceptable acquisition times. Recently introduced τc mapping may serve as a novel imaging parameter for the noninvasive in vivo evaluation of cartilage at clinical 3T MR systems.Acknowledgements
Financial support from Jane and Aatos Erkko Foundation, Medical Research Center Oulu and the Academy of Finland (#285909, #293970) is gratefully acknowledged.References
1 Elsayed H, Zbyn S, Nissi MJ, Rautiainen J, Hanni M, Nieminen MT. Correlation Time Mapping of Articular Cartilage: correlation with tissue composition and structure. Proc Int Soc Magn Reson Med. 2017; 25: 658.
2 Kajabi AW, Nissi MJ, Ketola J, Sarin JK, Casula V, Töyräs J, Weeren RV, Brommer H, Malda J, Mancini I, Hanni M, Nieminen MT. Correlation time mapping of articular cartilage degeneration in equine model. Proc Int Soc Magn Reson Med. 2017; 25: 1541.
3 Witschey II WRT, Borthakur A, Elliott MA, Mellon E, Niyogi S, Wallman DJ, Wang C, Reddy R. Artifacts in T1ρ-weighted imaging: Compensation for B1 and B0 field imperfections. J Magn Reson. 2007; 186(1): 75–85.
4 Blicharska B, Peemoeller H, Witek M. Hydration water dynamics in biopolymers from NMR relaxation in the rotating frame. J Magn Reson. 2010; 207(2): 287-293.
Figures