5052
Ultra-high-field (7 Tesla) MRI study of the articular cartilage in normal subjects1Radiology, University of Pisa, Pisa, Italy, 2Imago 7 foundation, Pisa, Italy, 3Neuroradiology, University of Pisa, Pisa, Italy, 4Radiology, University Hospital of Pisa, Pisa, Italy
Synopsis
Ultra High Field MRI gives the opportunity to study in vivo articular cartilage with optimal signal-to-noise ratio, contrast-to-noise ratio and spatial resolution in comparison with lower field strength systems. We obtained the mean T2 and T2* maps values for under and over 50 years aged healthy subjects, both mean values increase with the subjects' age. With dedicated multichannel coils and specific cartilage sequences, it is possible to make both a qualitative and a quantitative evaluation of early and pre-clinical cartilage ageing-related changes in estimating the water content and the integrity of the cartilage matrix.
Introduction
MRI has been established as the standard cartilage imaging technique and it is the only modality that allows direct visualization of cartilage with sufficient contrast. It has already been recognized as the most important non-invasive diagnostic modality in particular for the assessment of anatomical and morphological cartilage status. Anyway changes in cartilage physiology prior to morphological ones, cannot be visualized or measured with conventional MRI, although detecting these subtle changes is a priority due to the importance of diagnosing and managing OA at its earliest stages1. For their suitability for quantitative assessment of cartilage status, MR sequences have to present high SNR, CNR and high-spatial resolution; they should minimize image distortions and should be fast. Using 7 T MRI permits to reach the magnification of some characteristics necessarily required for cartilage imaging. The larger susceptibility effect of UHF results in more informative images with an increased contrast between different components of the same volume; the linear SNR increase with the field strength guarantees a better spatial resolution and a faster scanning speed2.
Purpose
To optimize cartilage-dedicated sequences for in vivo articular cartilage imaging at 7 Tesla MRI and to investigate the diagnostic potential of UHF in detecting early changes of the articular cartilage related to the physiological aging, focusing on the feasibility and the results of in vivo T2 and T2* mapping.Materials and methods
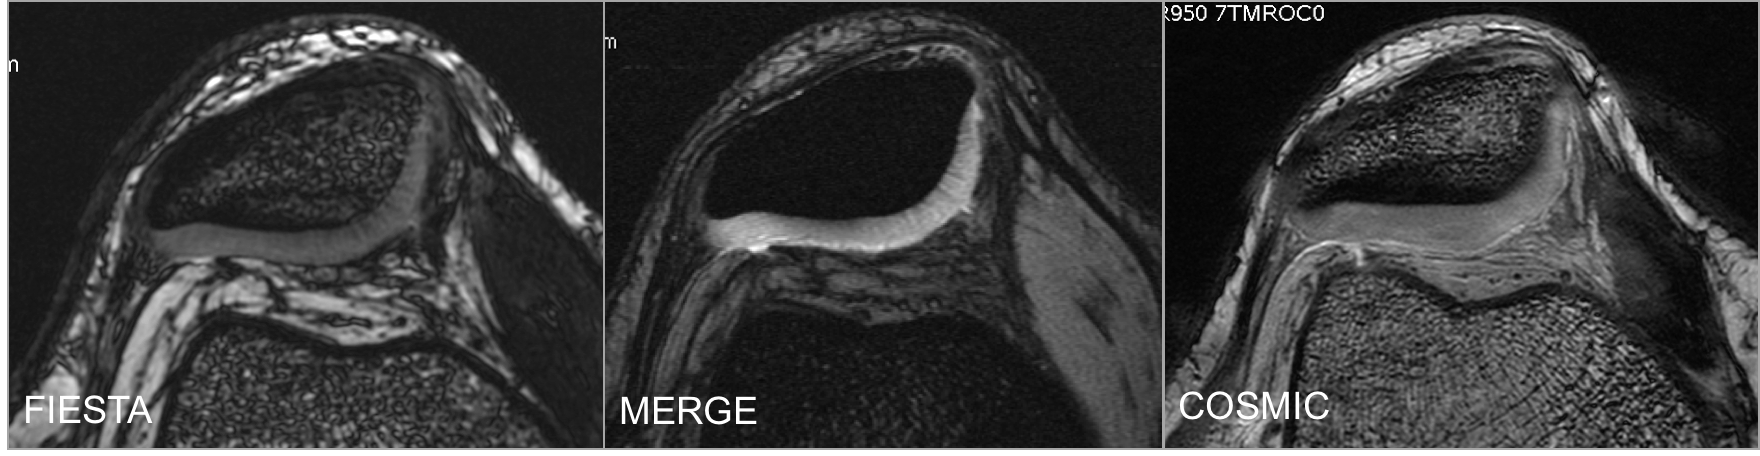
We have recruited 17 healthy subjects of different ages (<50 yrs, n=10, mean age: 39; >50 yrs, n=7, mean age= 57). Inclusion criteria were absence of clinical symptoms and no history of previous knee surgery or significant knee trauma. All the subjects underwent MR knee examination at 7 T whole-body system. We used a 8-channel volume coil, called Kneena, created by IMAGO 7 team, to explore the whole knee joint. MR protocol included: 3D bSSFP fast imaging employing steady-state acquisition (FIESTA), multiple-echo recombined gradient echo (MERGE), coherent oscillatory state acquisition for the manipulation of image contrast (COSMIC), 3D T2 star-weighted angiography (SWAN) for T2* Mapping, multi-echo SE T2 for T2 Mapping, Dixon-type pulse sequence Iterative Decomposition of water and fat with Echo Asymmetry and Least-squares estimation (IDEAL) for fat-saturation images. For T2 relaxation, a sagittal, me-SE sequence with 8 echoes was performed, whereas T2* relaxation was obtained by an axial 3D T2 SWAN. For each subject, T2 and T2* mapping were obtained with an homemade software in Matlab, respectively in sagittal and axial projection, including patellar, femoral and tibial cartilage. We have manually drawn the region of interest (ROI) on the maps, at the maximum thickness of the cartilage, using Horos3 program. In the T2* maps for the layout of the tibial articular cartilage, we have drawn the ROIs only on the patellar and femoral cartilage excluding the tibial compartment, which generates errors because its orientation is parallel to the slices acquired. Statistical data analysis was performed using JMP version 7.0 (SAS) statistics software. One-way Anova analysis of variance was used to compare the different distribution of T2 and T2* map values between groups. A statistical comparison between age and measurements was performed by bivariate test, and a p-value of 0.05 or less was considered to indicate significance.
Results
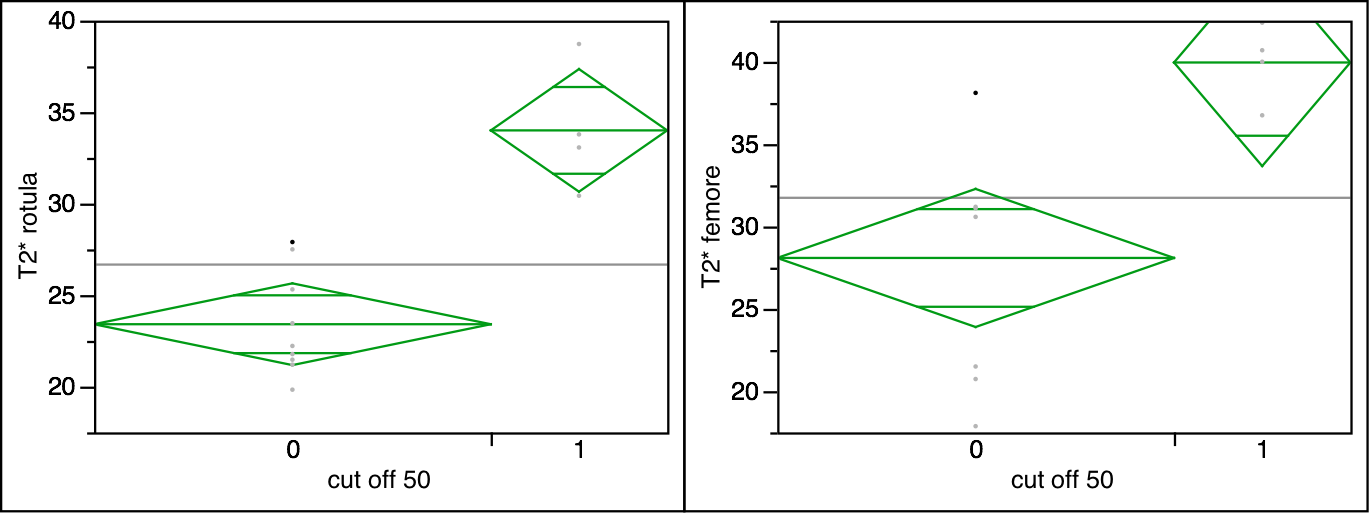
The mean T2 and T2* maps values were obtained for all 17 subjects. The average T2 maps values for the patellar and femoral cartilage were 33,1 ms ± 4,9 and 38,2 ms ± 6,9 respectively for under 50 years and over 50 years aged subjects. The mean T2* maps values were 25,75 ms ± 5,46 and 36,9 ms ± 4,2 for under 50 years and over 50 years aged volunteers respectively. Our data revealed a significant correlation between both the increase in the T2 and T2* maps values and subjects age (p= 0.0104 for the patellar cartilage and p= 0.0016 for the femur cartilage in T2 maps; p=0,0001 e p= 0,0054 in T2* maps). As regards tibial cartilage, no significant values were obtained in T2 mapping (p > 0,005).Conclusions
Our data revealed the T2 and T2* values increase with the subjects' age as far as concerned patellar and femoral cartilage. 7 T MRI gives the opportunity to study in vivo articular cartilage with better SNR and CNR than lower field strength systems. By setting up suitable multichannel coils and more specific cartilage sequences it is possible to make both a qualitative and a quantitative evaluation of early cartilage ageing-related changes in estimating the water and indirectly the matrix cartilage content.Acknowledgements
No acknowledgement found.References
1. Link TM, Stahl R, Woertler K. Cartilage imaging: motivation, techniques, current and future significance Eur Radiol (2007) 17: 1135–1146
2. Moser E. et al. Ultra-high-field magnetic resonance: Why and when? World J Radiol 2010; 2(1): 37-40
3. Horos Project (2015). DICOM image viewing and measuring. [Horos]. http://www.horosproject.org/
Figures
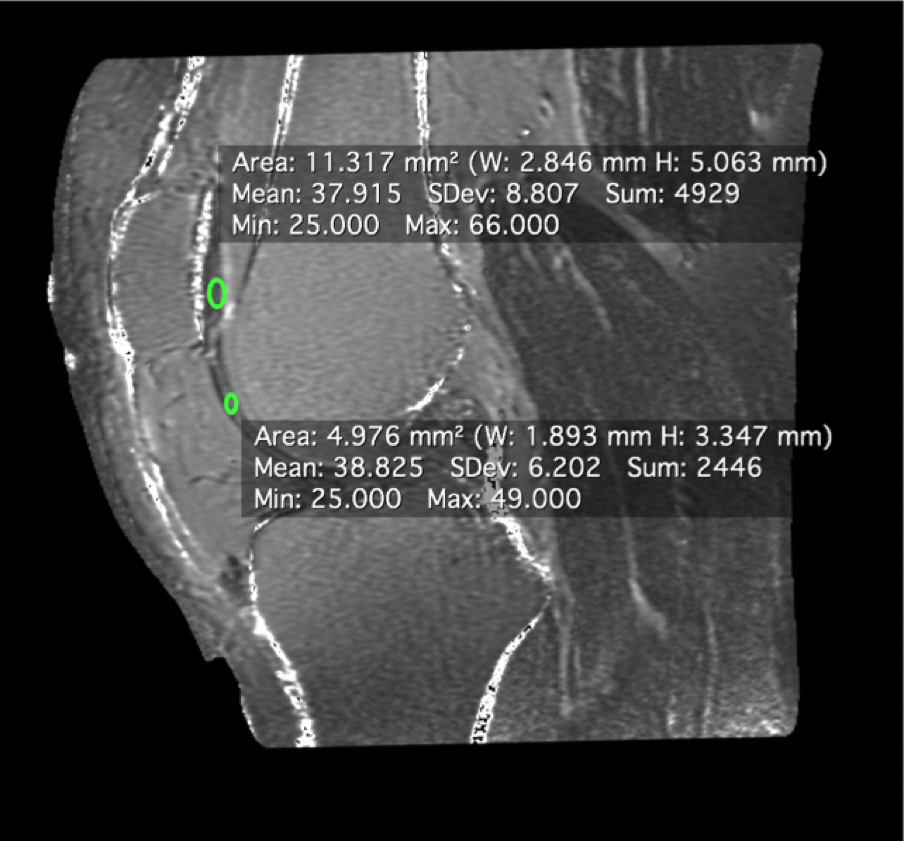
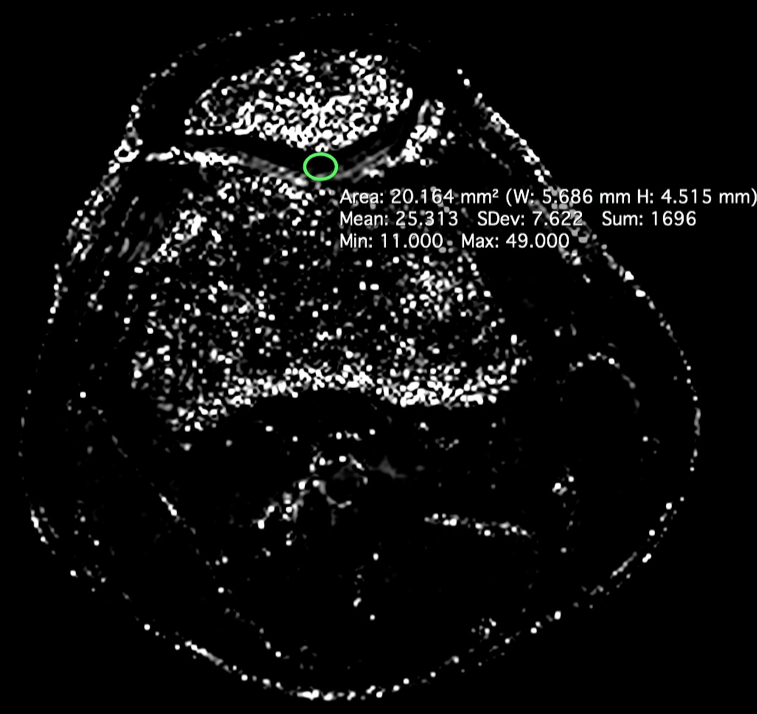
Example of a sagittal T2 map created from the quantitative T2 SE-ME sequence, where we selected the ROIs to calculate segmental cartilage T2 values.
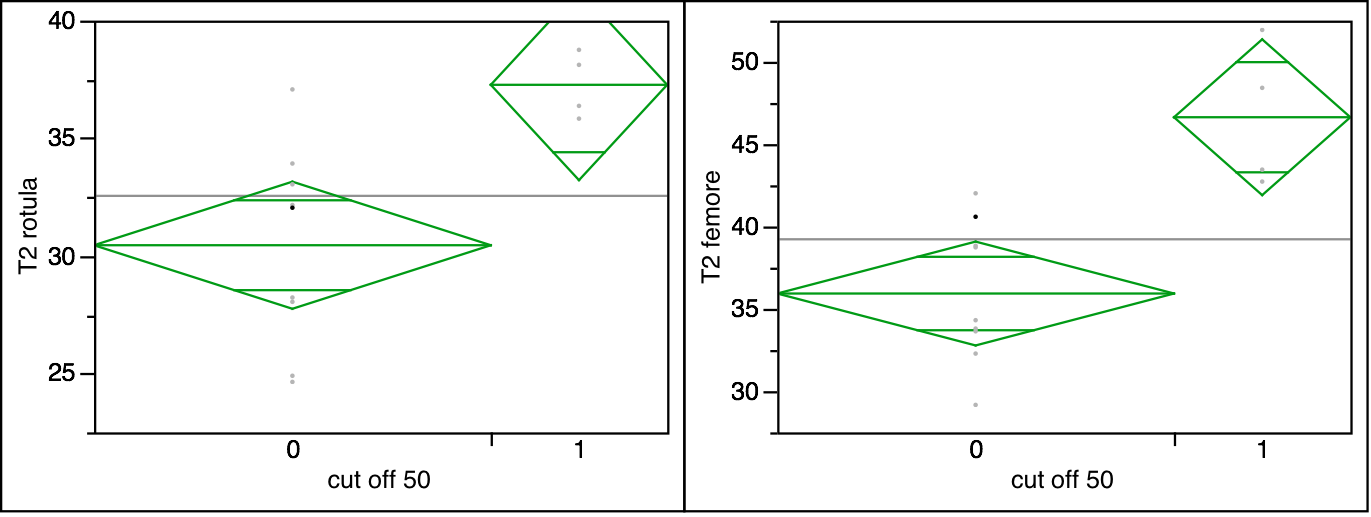
Graphs showing the mean values of T2 maps of patellar and femoral cartilage in subjects <50 and >50 years old.