5051
Orientation anisotropy of qMRI parameters in degenerated human articular cartilage1Research Unit of Medical Imaging, Physics and Technology, University of Oulu, Oulu, Finland, 2Department of Applied Physics, University of Eastern Finland, Kuopio, Finland, 3Medical Research Center Oulu, Oulu University Hospital and University of Oulu, Oulu, Finland, 4Department of Diagnostic Radiology, Oulu University Hospital, Oulu, Finland
Synopsis
Quantitative MR relaxation parameters have been used for evaluation of composition and structure of articular cartilage, and demonstrated to have variable sensitivity to orientation of the tissue in magnetic field. The orientation dependence of multiple relaxation parameters was assessed in human cartilage of varying degree of degeneration, and correlated with biomechanical testing. T2 and CW-T1ρ at 400Hz spin-lock demonstrated most clear anisotropy patterns which varied among the samples of different cartilage quality.
Purpose
Multiple quantitative MRI parameters have been shown to be sensitive to tissue orientation in the main magnetic field B0 1. Generally, T1 is not affected by tissue orientation 2 while T2 has the strongest orientational dependence 3–6. Similarly, continuous wave (CW-) T1ρ 7 and adiabatic T1ρ have been studied as potential markers for cartilage degeneration 8,9 and they both demonstrate varying degree of orientation sensitivity 1,6. The purpose of this study was to investigate how degeneration of cartilage affects the orientation anisotropy of these qMRI parameters.Methods
Cylindrical osteochondral patella plugs (n = 15) from human cadaveric joints (Ethical permission: KUH 34/2015, 58/2013) were extracted. Indentation testing on a custom material testing setup was performed to compute the biomechanical parameters 10. First, a 3-step stress-relaxation protocol by applying 5% of compression and 15 minutes relaxation with initial 12.5 kPa prestress and preconditioning (2% of thickness, 5 times) was conducted 11. Equilibrium modulus between 2nd and 3rd step was computed. Next, dynamic modulus was computed from sinusoidal loading (4 cycles, 1 Hz), as the ratio of the stress and strain amplitudes.
MRI was performed at 9.4 T using a 19 mm quadrature RF volume transceiver and VnmrJ3.1 Varian/Agilent DirectDrive console. The samples were immersed in perfluoropolyether (Galden HS 240, Solvay Solexis, Italy) in a custom-built holder, which allowed rotation of the specimens with respect to the main imaging magnetic field (B0) from outside the scanner. The samples were imaged at three different orientations; 0, 55 and 90 degrees with respect to B0. Relaxation time measurements were realized using a global preparation block coupled to a single slice fast spin echo readout (TR=5s, ESP=5.5ms, ETL=8 with centric echo ordering, matrix=256x80, FOV=16x16mm and 1mm slice, yielding a resolution of 62.5µm along cartilage depth). A single imaging slice was positioned at the center of the specimen, perpendicular to the axis of specimen rotation, and was rotated with the specimen. The measurements included FSE T1 relaxation time with inversion recovery (TI = 0.2, 0.5, 0.8, 1.1, 1.4 and 3s); CW-T1ρ with ten spin-lock amplitudes 12 (range 0-2500Hz), of which zero spin-lock was used as a T2 measurement; adiabatic T1ρ with pulses from the hyperbolic secant HSn family (HS1 and HS4 pulses, τp=4.5ms, and γB1,max/2π =2.5 and 1.2kHz, respectively 13). CW-T1ρ was measured with spin-lock durations of 0, 24, 48, 96 and 192ms; adiabatic T1ρ was measured with pulse trains of 0, 4, 8, 12 and 24 pulses using MLEV4 phase cycling. All measurements were repeated for every orientation. After the MRI studies, the samples were fixed in 10% formalin for histology measurements.
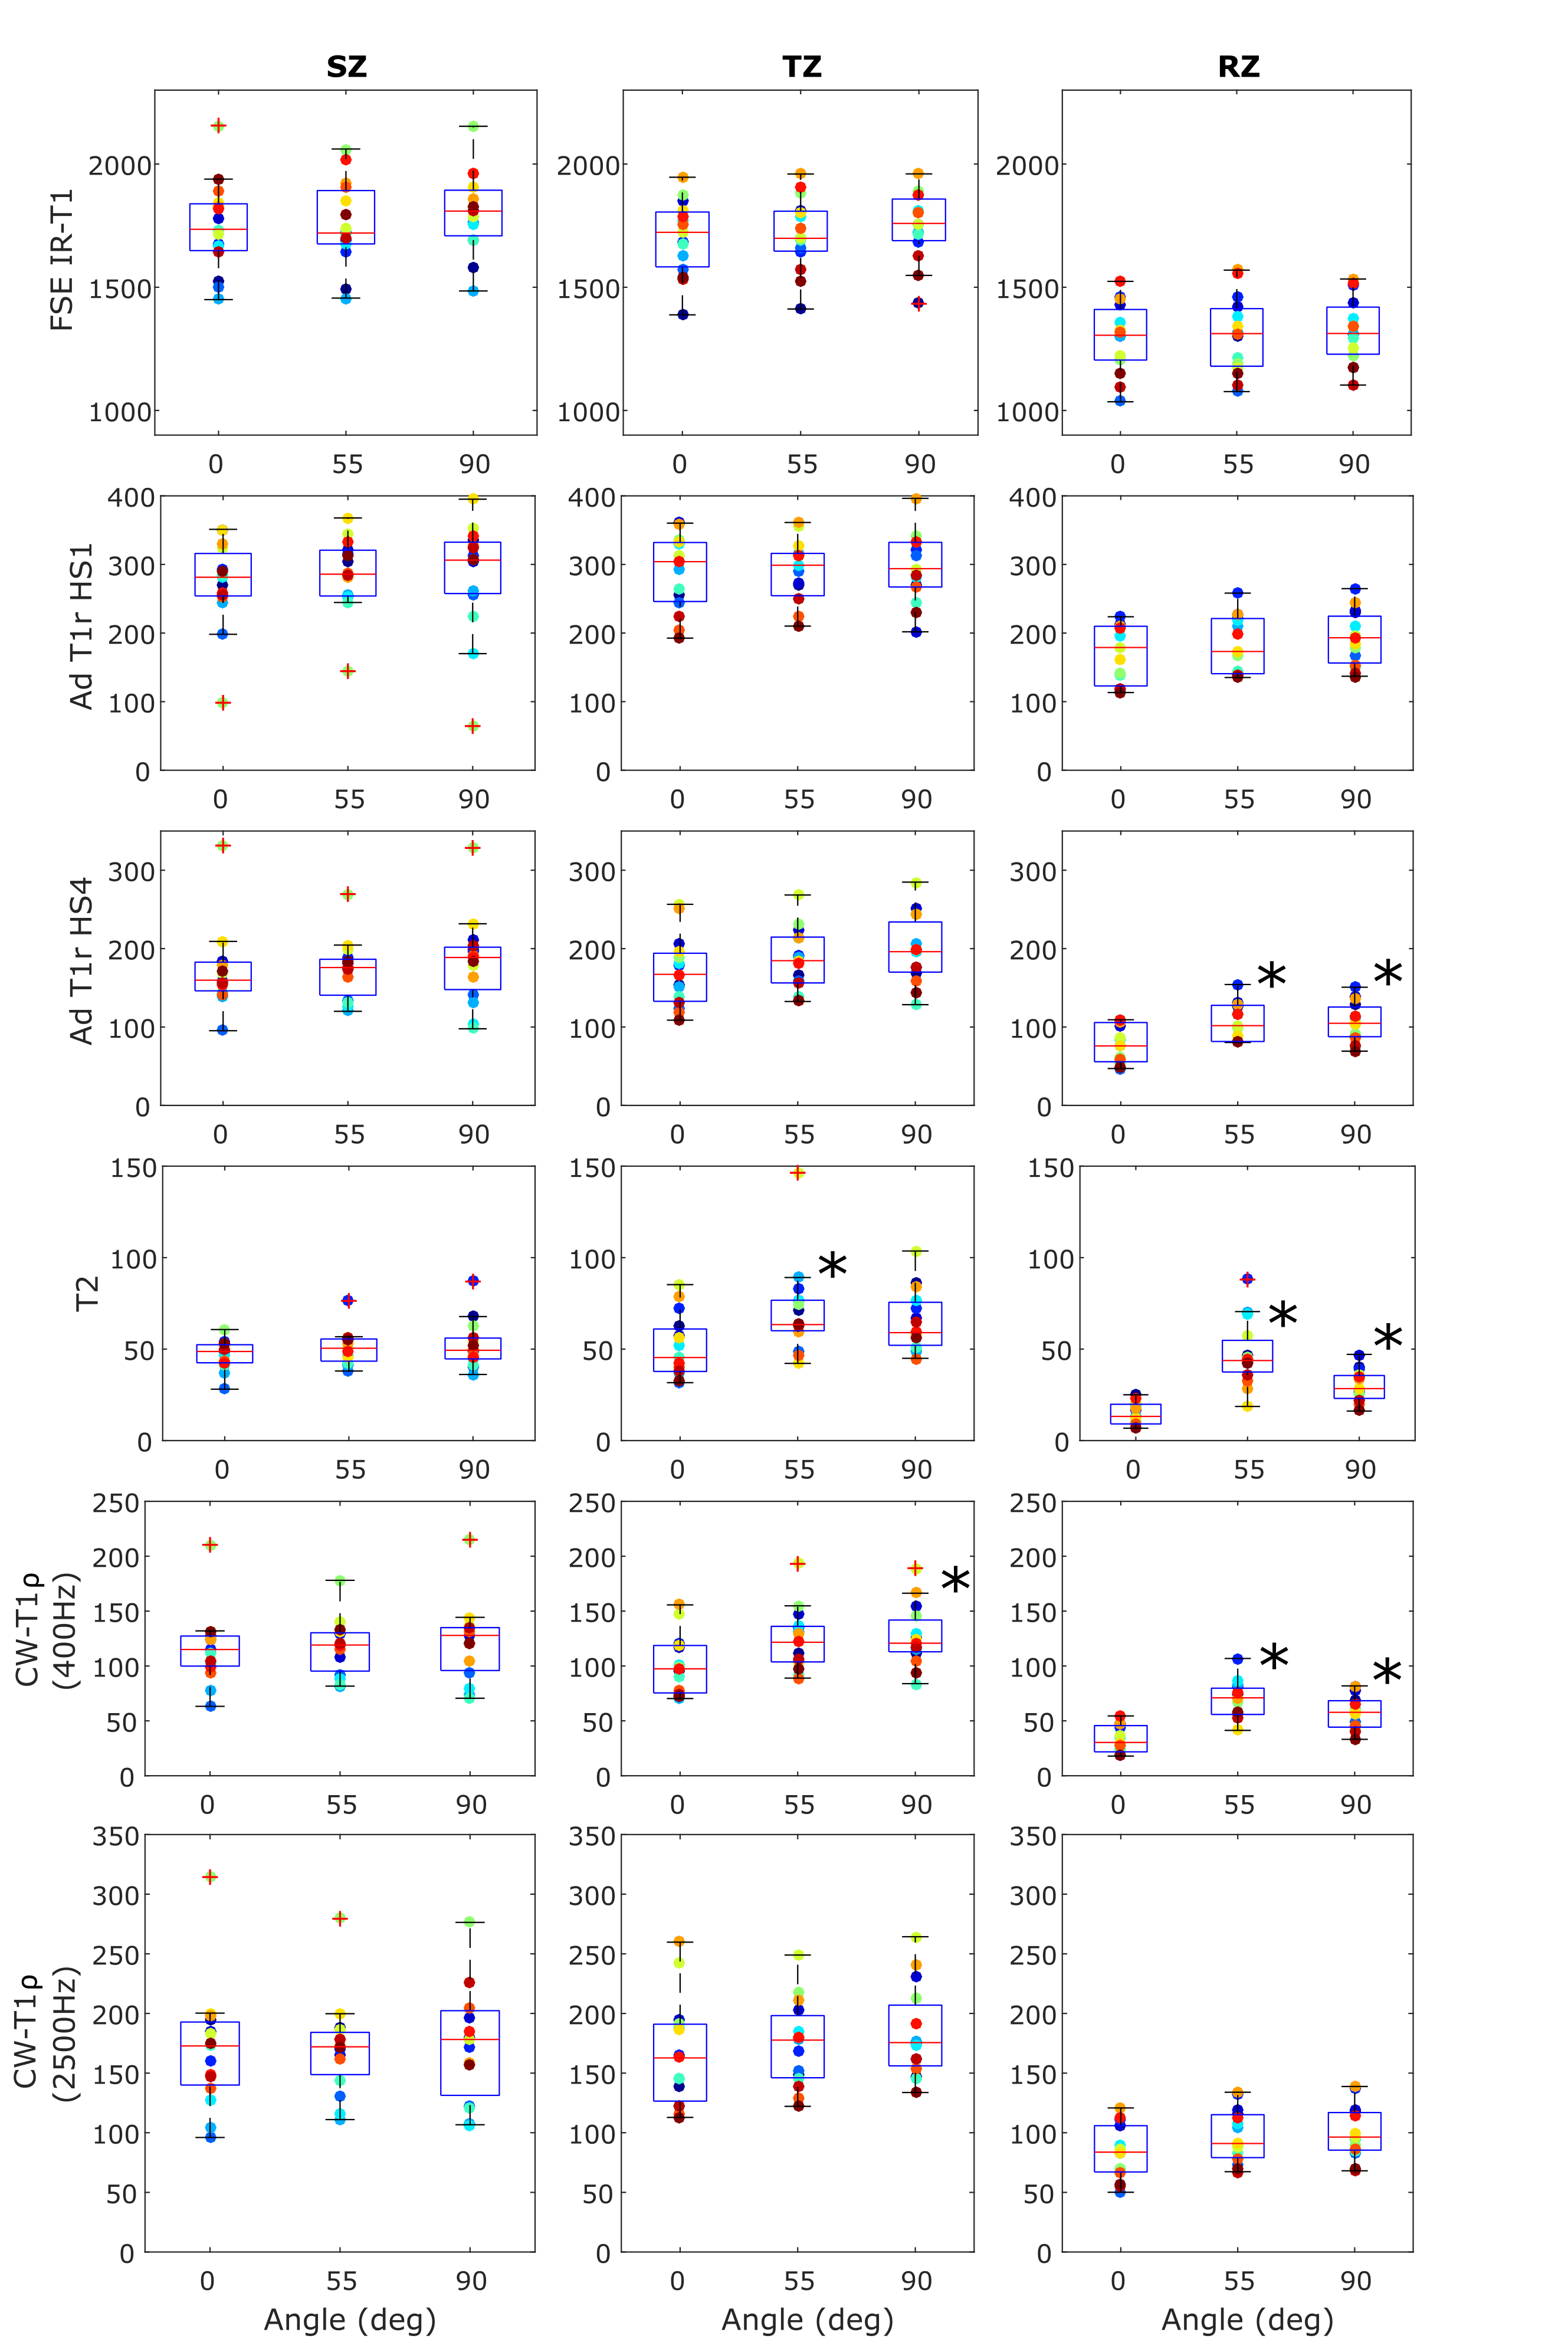
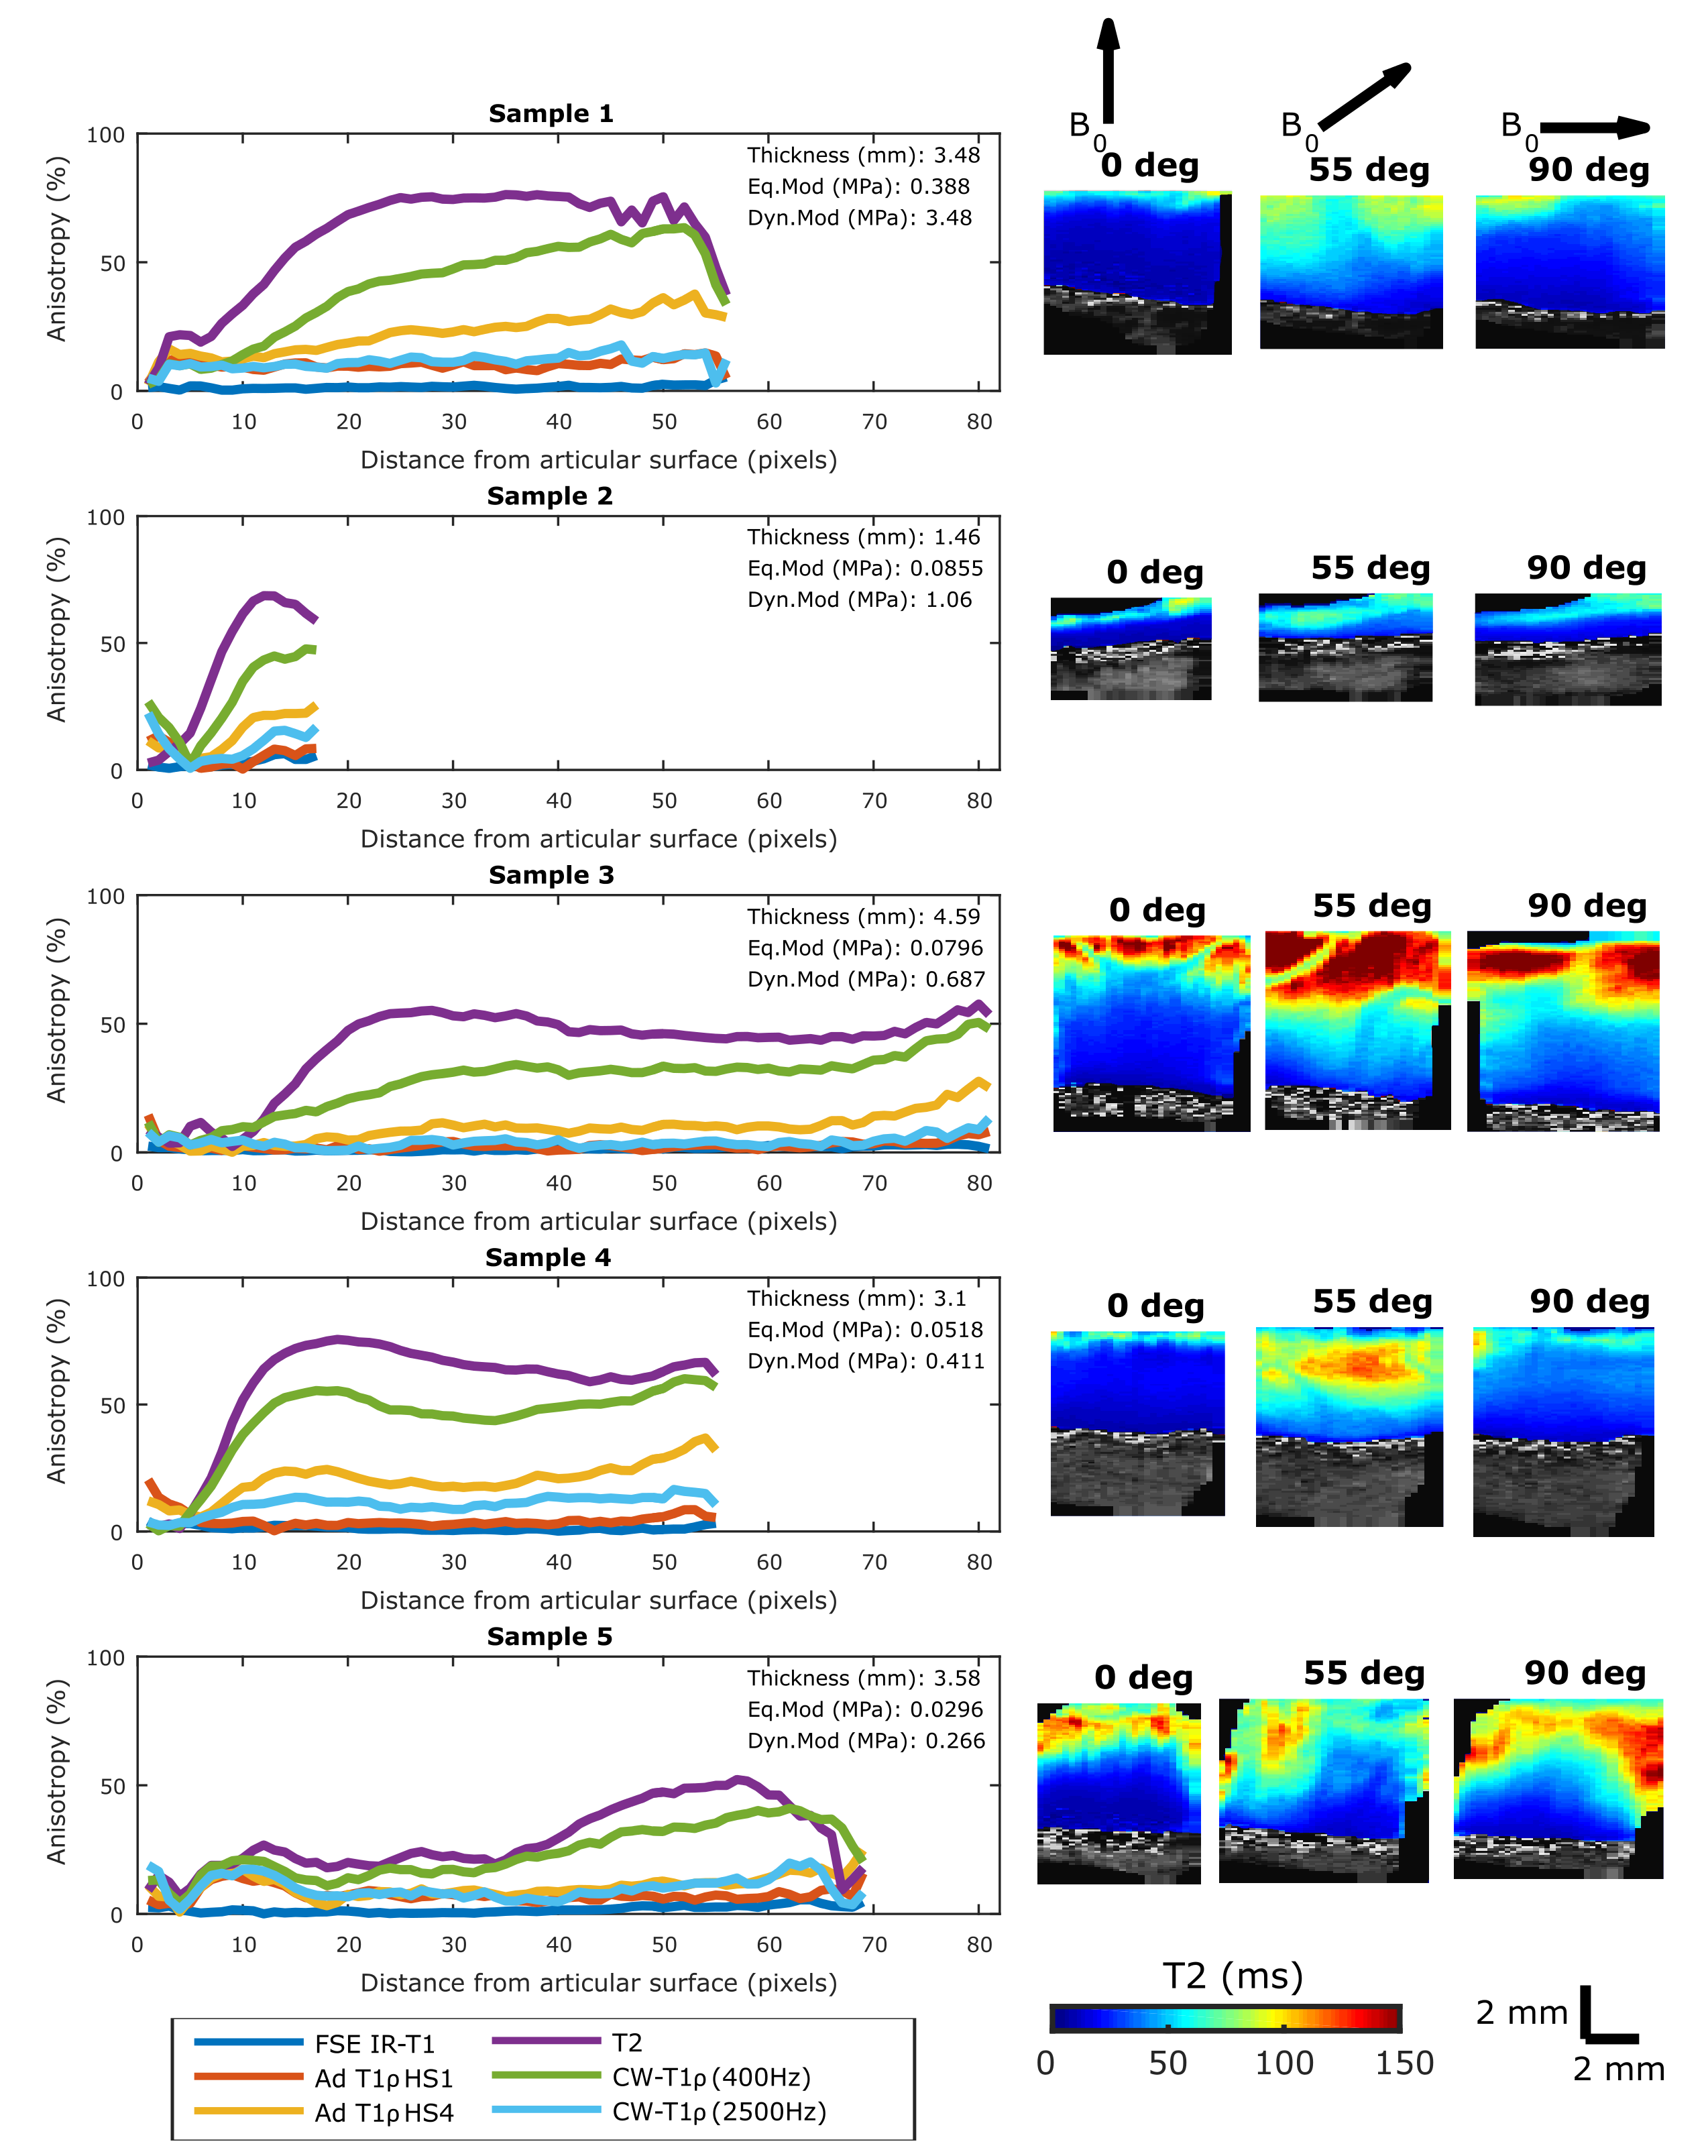
Relaxation time constants were fitted in a pixel-wise manner using the respective signal equations and in-house developed Matlab plugin functions for Aedes (http://aedes.uef.fi). ROIs were defined for superficial, tangential and radial zones and depth-wise profiles were averaged through 7 pixels at the center axis of the cartilage plug. Anisotropy profiles for the MRI parameters were calculated for each sample as Michelson contrast 1,14,15.
Results
Varying cartilage quality of the samples resulted in varying spread of the relaxation time values in different layers of cartilage (Fig 1). Mean values of relaxation times at different orientations were statistically different in the radial zone for T2, CW-T1ρ at 400Hz and adiabatic T1ρ with HS4 pulse, also indicating orientation anisotropy was present for these parameters (Fig 1). Shapes of anisotropy profiles of relaxation parameters followed the previously noted pattern (1), but sample integrity clearly affected the shape of the curve and the maximum anisotropy in the deep zone, especially for the most orientation sensitive parameters, T2 and CW-T1ρ at 400Hz (Fig 2).Discussion and Conclusion
Orientation anisotropy is present in degenerated human cartilage, as also Shao et al. have previously observed 6. In this study, we noticed that cartilage thickness did not affect anisotropy, as even degenerated thin cartilage could demonstrate similar anisotropic pattern as less degenerated and thick cartilage (Fig 2, Sample 2). However, samples with low values of equilibrium and dynamic moduli tended to have lower maximum anisotropy (Fig 2). Orientation anisotropy results from the strict organization of collagen fibers in cartilage, and weakening of this structure would assumably cause decrease of anisotropy. However, exceptions to this were also found, for example in Sample 4 in Figure 2.
Cartilage quality affects relaxation time parameters and their orientation dependence. Reduced orientation sensitivity could be a potential marker for cartilage degeneration in osteoarthritis, and at the same time make diagnosis less prone to magic angle effect. However, in order to validate and explain this relation, more research will be needed.
Acknowledgements
Support from the Academy of Finland (grants
#297033, #285909 and #293970) and Instrumentarium Science Foundation (170033)
is gratefully acknowledged. The authors wish to thank Mr. Hassaan Elsayed for producing
the 3D-printed sample-rotation holder.
References
1. Hänninen N, Rautiainen J, Rieppo L, Saarakkala S, Nissi MJ. Orientation anisotropy of quantitative MRI relaxation parameters in ordered tissue. Sci Rep. 2017;7(1):9606.
2. Xia Y. Relaxation anisotropy in cartilage by NMR microscopy (µMRI) at 14-µm resolution. Magn Reson Med. 1998;39(6):941–9.
3. Xia Y, Moody JB, Alhadlaq H. Orientational dependence of T2 relaxation in articular cartilage: A microscopic MRI (µMRI) study. Magn Reson Med. 2002;48(3):460–9.
4. Akella SVS, Regatte RR, Wheaton AJ, Borthakur A, Reddy R. Reduction of residual dipolar interaction in cartilage by spin-lock technique. Magn Reson Med. 2004;52(5):1103–9.
5. Wang N, Xia Y. Dependencies of multi-component T2 and T1ρ relaxation on the anisotropy of collagen fibrils in bovine nasal cartilage. J Magn Reson. 2011;212(1):124–32.
6. Shao H, Pauli C, Li S, Ma Y, Tadros AS, Chang EY, ym. Magic angle effect plays a major role in both T1rho and T2 relaxation in articular cartilage. Osteoarthr Cartil. 2017;1–9.
7. Le J, Peng Q, Sperling K. Biochemical magnetic resonance imaging of knee articular cartilage: T1rho and T2 mapping as cartilage degeneration biomarkers. Ann N Y Acad Sci. 2016;1383:34–42.
8. Rautiainen J, Nissi MJ, Liimatainen T, Herzog W, Korhonen RK, Nieminen MT. Adiabatic rotating frame relaxation of MRI reveals early cartilage degeneration in a rabbit model of anterior cruciate ligament transection. Osteoarthr Cartil. 2014;22(10):1444–52.
9. Rautiainen J, Nissi MJ, Salo E-N, Tiitu V, Finnilä M a J, Aho O-M, ym. Multiparametric MRI assessment of human articular cartilage degeneration: Correlation with quantitative histology and mechanical properties. Magn Reson Med. 2014;74(May):249–59.
10. Hayes WC, Keer LM, Herrmann G, Mockros LF. A mathematical analysis for indentation tests of articular cartilage. J Biomech. 1972;5(5):541–51.
11. Korhonen RK, Laasanen MS, Töyräs J, Lappalainen R, Helminen HJ, Jurvelin JS. Fibril reinforced poroelastic model predicts specifically mechanical behavior of normal, proteoglycan depleted and collagen degraded articular cartilage. J Biomech. syyskuuta 2003;36(9):1373–9.
12. Nissi MJ, Salo EN, Tiitu V, Liimatainen T, Michaeli S, Mangia S, ym. Multi-parametric MRI characterization of enzymatically degraded articular cartilage. J Orthop Res. 2016;34(7):1111–20.
13. Garwood M, DelaBarre L. The return of the frequency sweep: designing adiabatic pulses for contemporary NMR. J Magn Reson. 2001;153:155–77.
14. Michelson AA. Studies in Optics. Chicago: The University of Chicago Press; 1927.
15. Rieppo J, Hallikainen J, Jurvelin JS, Kiviranta I, Helminen HJ, Hyttinen MM. Practical considerations in the use of polarized light microscopy in the analysis of the collagen network in articular cartilage. Microsc Res Tech. 2008;71(4):279–87.
Figures