5048
T2 Relaxometry of Cartilage and Meniscus and Semi-Quantitative Assessment of the Osteoarthritic Knee using a fast 3D Quantitative DESS Scan1Radiology & Nuclear Medicine, Erasmus University Medical Center, Rotterdam, Netherlands, 2Stanford University Medical Center, Stanford, CA, United States, 3Orthopedic Surgery, Erasmus University Medical Center, Rotterdam, Netherlands
Synopsis
In this study, we investigated quantitative and semi-quantitative MR imaging biomarkers of knee OA, obtained with a 5-minute DESS sequence, in increasing stages of knee OA. 54 patients were included: 20 patients with no knee OA, 18 patients with mild knee OA and 16 patients with moderate knee OA. All patients were scanned using DESS and a routine clinical knee MRI protocol. Simultaneous quantitative T2 and morphological assessment of cartilage and meniscus with a 5-minute DESS-sequence showed consistent outcomes with increasing stages of degeneration, making this sequence a useful tool for OA research.
Purpose
Quantitative MRI measures such as T2 relaxation times of cartilage and meniscus, and semi-quantitative assessments such as MRI Osteoarthritis (OA) Knee Score (MOAKS)1, are commonly used to track spatial and temporal changes of knee OA2-4. Acquiring these biomarkers currently requires multiple MR sequences, resulting in long acquisition times5. We evaluated the double-echo steady-state (DESS) sequence, with an acquisition time of only five minutes. DESS generates two echoes, separated by a spoiler gradient, per repetition time; the first DESS echo (S+) has a T1/T2 contrast, which resembles a proton-density (PD) contrast in the knee, and the second DESS echo (S-) has additional T2 weighting. The sum of the two signals (S+ and S-) can be used to generate axial and coronal reconstructions. DESS has been showed to generate accurate morphology and T2 measurements as well as MOAKS scores in most tissues6. While promising, the evaluation of DESS in OA subjects is needed. In this study, we investigated quantitative and semi-quantitative MR imaging biomarkers of knee OA, obtained with a 5-minute DESS sequence, in increasing stages of knee OA. Patients with no, mild and moderate knee OA were assessed using simultaneous T2 relaxometry of cartilage and meniscus, and MOAKS scoring performed with DESS.Methods and Materials
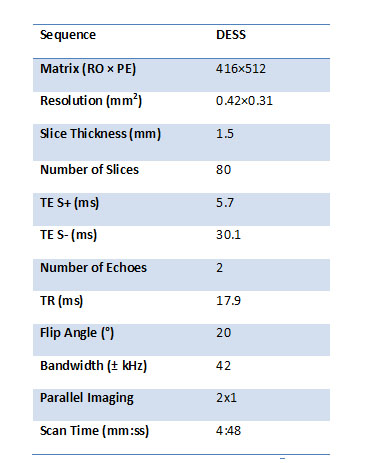
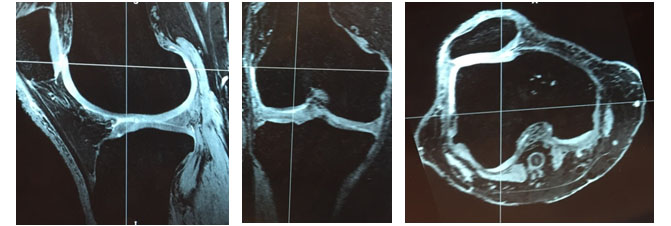
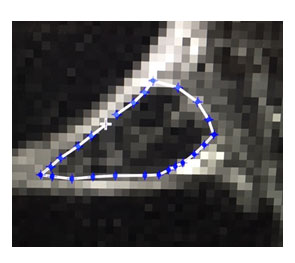
54 patients were included and divided in three groups, based on their radiographic degree of knee OA according to Kellgren-Lawrence (KL): 20 patients with no knee OA (KL grade 0), 18 patients with mild knee OA (KL 2) and 16 patients with moderate knee OA (KL 3). All patients were scanned using DESS (Fig. 1) and a routine clinical knee MRI protocol. DESS echo signals were acquired separately to enable T2 fitting7 and sequence parameters are shown in Table 1. MOAKS was performed by a researcher experienced in musculoskeletal MRI using only the DESS images (with multi-planar reformatting). Mean T2 values of cartilage (femur and tibia, medial and lateral) and meniscus (medial and lateral) were calculated on single slices (Fig 2), using in-house developed post-processing software (Matlab R2011b; The Math-Works, Natick, MA, USA). The T2 values were calculated using the following analytical expression (where a is the flip angle), assuming a T1 of 1200 ms. for cartilage and a T1 of 1000 ms. for meniscus6,7:
$$\frac{S-}{S+}=e^{-\frac{2(\mathrm{TR}-\mathrm{TE})}{T_2}} \sin^2{\left(\frac{\alpha}{2}\right)}\left(\frac{1+e^{-\frac{\mathrm{TR}}{T_1} }}{1-\cos{\alpha} e^{-\frac{\mathrm{TR}}{T_1}}}\right)$$
Statistical testing between KL-groups was performed with one-way ANOVA tests, using an alpha of 0.05. Correlation between T2 values and MOAKS was assessed using a linear regression model.
Results
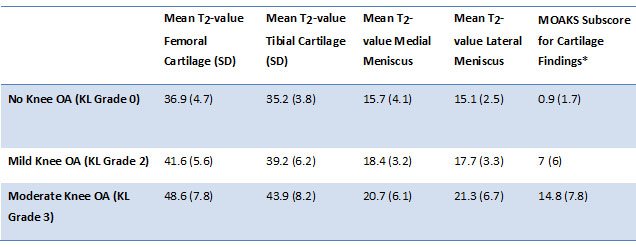
T2 values of cartilage and menisci, as well as MOAKS findings are shown in Table 2. Mean T2 values in cartilage (average of tibia and femur), obtained with DESS, were 36.1 ± 4.2, 40.4 ± 5.9 and 46.3 ± 8 ms for KL0, KL2 and KL3 resp. The between-group differences were statistically significant (p < 0.001). In menisci, mean T2-values (average of medial and lateral) of 15.4 ± 3.3, 18 ± 3.3 and 21 ± 6.4 ms were found for KL0, KL2 and KL3 resp. These between-group differences were statistically significant as well (p < 0.001). MOAKS-subscores for cartilage findings were 0.9 ± 1.7, 7 ± 6 and 14.8 ± 7.8 for KL0, KL2 and KL3 resp. Mean T2-values of cartilage showed a good correlation with corresponding MOAKS cartilage findings (r = 0.61, p = 0.002).Discussion
This study, with a large sample size, shows that T2 values and MOAKS scores of cartilage and menisci, obtained with DESS, agreed well with the corresponding radiographic degree of knee OA. These results indicate that using one single 5-minute DESS scan, both quantitative and semi-quantitative (morphological) assessment of the knee can be performed. Besides beneficial effects to patient comfort and costs, using a single, fast sequence could potential lead to a decrease in problems such as motion artifacts and mismatched resolutions.Conclusion
Simultaneous quantitative T2 and morphological assessment of cartilage and meniscus with a 5-minute DESS-sequence show consistent outcomes with increasing stages of degeneration, making this sequence a useful tool for OA research.Acknowledgements
No acknowledgement found.References
1. Hunter DJ, Guermazi A, Lo GH, et al.: Evolution of semi-quantitative whole joint assessment of knee OA: MOAKS (MRI Osteoarthritis Knee Score). Osteoarthr Cartil 2011; 19:990–1002
2. Zarins ZA, Bolbos RI, Pialat JB, et al.: Cartilage and meniscus assessment using T1rho and T2 measurements in healthy subjects and patients with osteoarthritis. Osteoarthr Cartil 2010; 18:1408–1416.
3. Rauscher I, Stahl R, Cheng J, et al.: Meniscal measurements of T1rho and T2 at MR imaging in healthy subjects and patients with osteoarthritis. Radiology 2008; 249:591–600.
4. Baum T, Joseph GB, Karampinos DC, Jungmann PM, Link TM, Bauer JS: Cartilage and meniscal T2 relaxation time as non-invasive biomarker for knee osteoarthritis and cartilage repair procedures. Osteoarthr Cartil 2013; 21:1474–84.
5. Peterfy CG, Schneider E, Nevitt M: The osteoarthritis initiative: report on the design rationale for the magnetic resonance imaging protocol for the knee. Osteoarthr Cartil 2008; 16:1433–1441.
6. Chaudhari, Akshay S., Black, Marianne S. Eijgenraam, Susanne, Wirth, Wolfgang, Maschek, Susanne, Sveinsson, Bragi, Eckstein, Felix, Oei, Edwin H. G., Gold, Garry E., Hargreaves, Brian A. 5-Minute Knee MRI for Simultaneous Morphometry and T2 Relaxometry of Cartilage and Meniscus and for Semi-Quantitative Radiological Assessment using Double-Echo in Steady-State at 3T. J Magn Reson Imaging 2017; (Early View)
7. Sveinsson B, Chaudhari A, Gold G, Hargreaves B: A simple analytic method for estimating T2 in the knee from DESS. Magn Reson Imaging 2017; 38:63–70.
Figures