5045
A comparative study of diffusion kurtosis imaging and T2* mapping in quantitative evalutation of lumbar intervertebral disc degeneration1Radiology, Renmin Hospital of Wuhan University, Wuhan, China, 2GE Healthcare China, Beijing, China
Synopsis
The purpose of this study is to compare the diagnostic value of diffusion kurtosis imaging (DKI) and T2* mapping in assessing lumbar intervertebral disc degeneration. DKI related parameters, such as mean kurtosis (MK), mean diffusivity (MD), fractional anisotropy (FA), FA of Kurtosis (FAK) and T2* values of nucleus pulposus (NP), anterior annulus fibrosus (AAF) and posterior annulus fibrosus (PAF) were measured and correlated with Pfirrmann grades, disc level, gender and age. It was found that DKI related parameters and T2* values had significantly correlation with Pfirrmann grades, disc leveland, age, but had no significantly correlation with gender. In addition, DKI was more sensitive than T2* mapping in quantitative detection of early lumbar intervertebral disc degeneration.
Introduction
Intervertebral disk degeneration (IVDD) is a leading cause of lumbar spine related low back pain. Multiple factors, such as cell aging, dystrophia, biomechanical changes, may lead to intervertebral disc proteoglycan degradation and loss of collagen and water, which finally resulting in degeneration. The alteration of water moleculare diffusion process is regard as a mark of early lumbar intervertebral disc degeneration [1]. Recently, diffusion kurtosis imaging (Non-Gaussian DKI) was found to becan sensitivelybly reflect the non-Gaussian properties of water moleculare diffusion and the complexity of tissue microstructures [2]. Previous study of rat tail intervertebral disc model has demonstrated the feasibility of detecting early intervertebral disc degeneration with DKI [3]. In addition, current studies had determined the relationship between T2* value and lumbar intervertebral disc degeneration [4]. It shows the potential of detecting early intervertebral disc degeneration using T2* mapping. The purpose of this study is to compare the diagnostic value of DKI and T2* mapping in quantitative evaluation of IVDD.Method
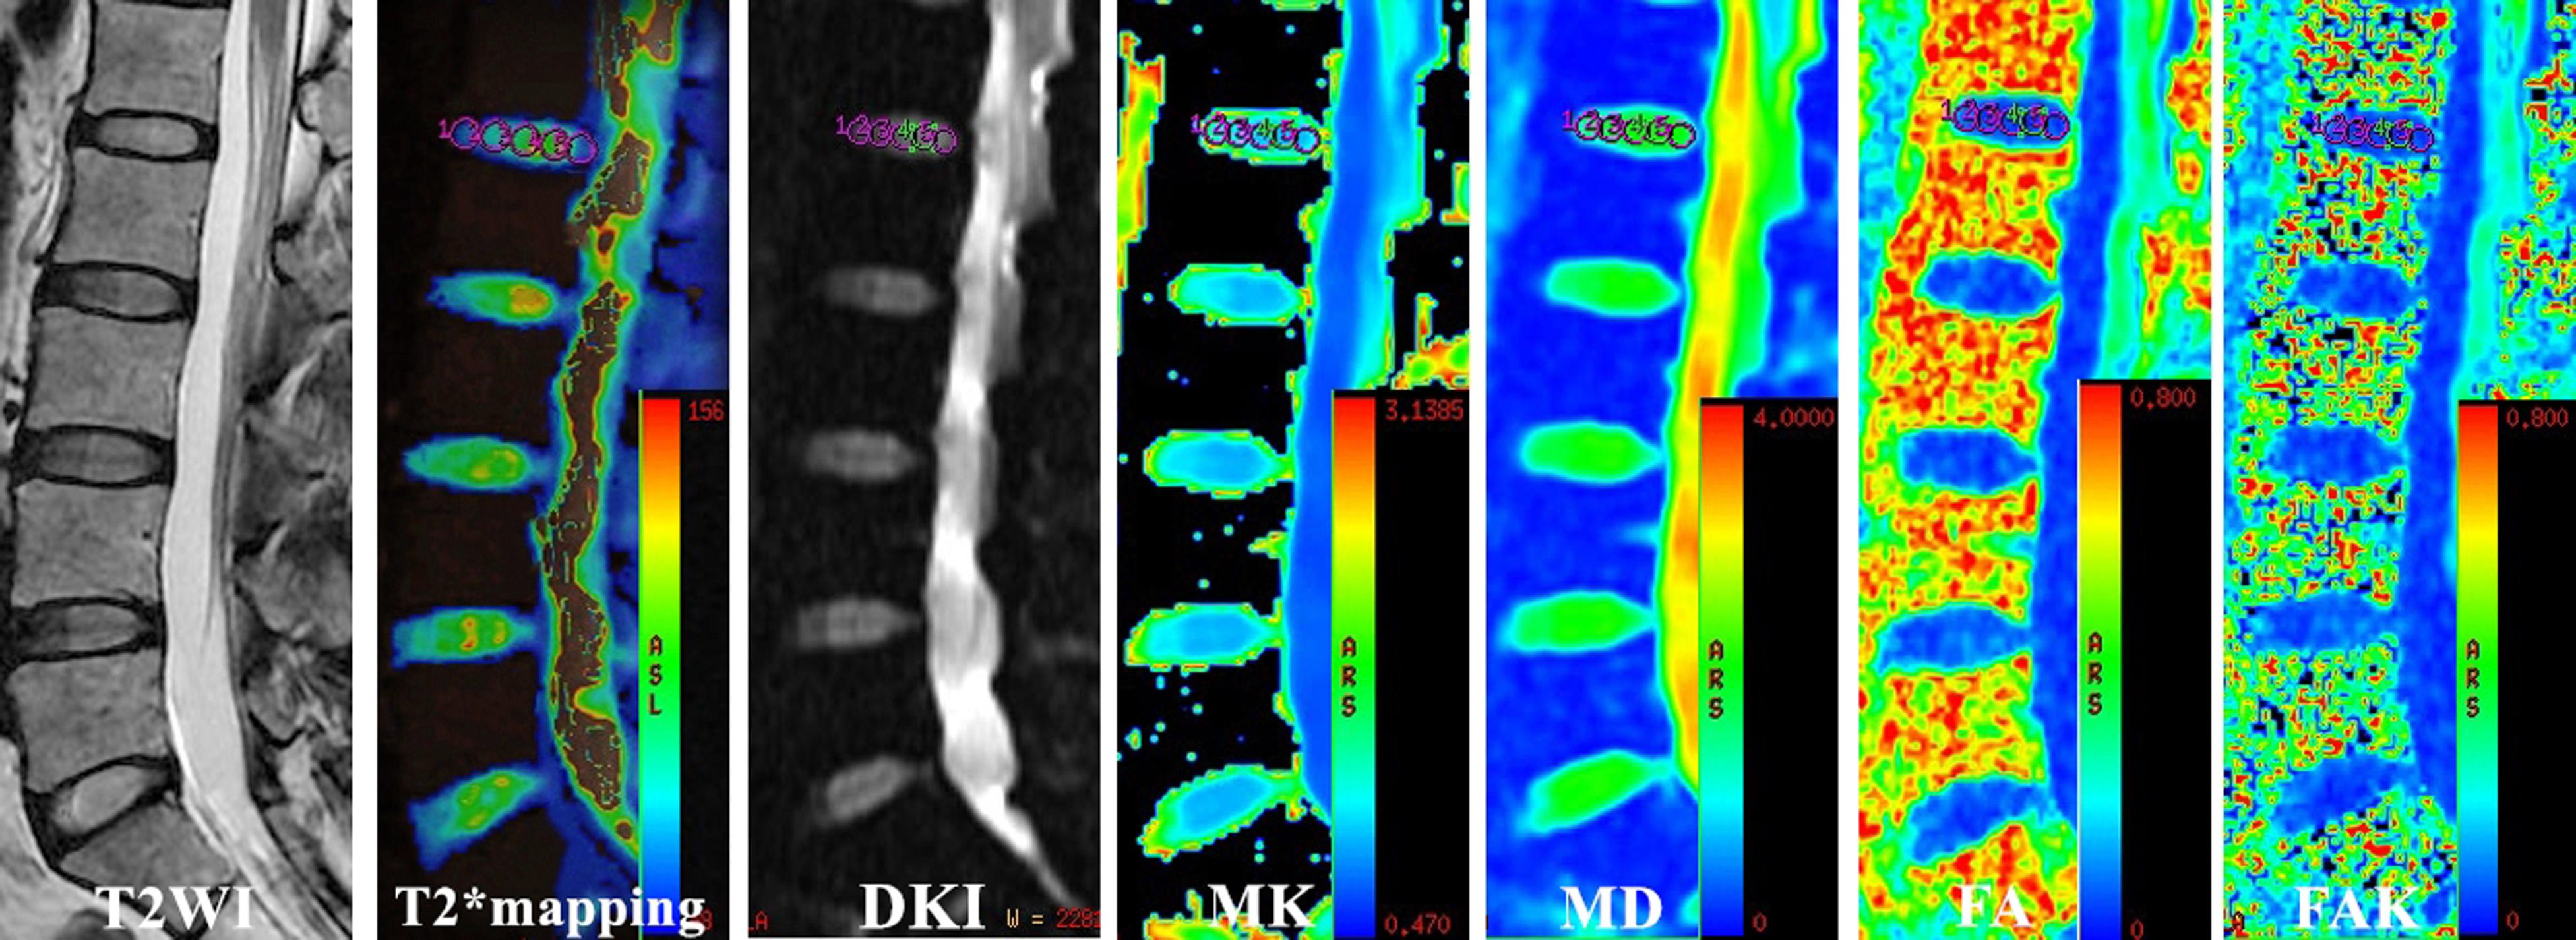
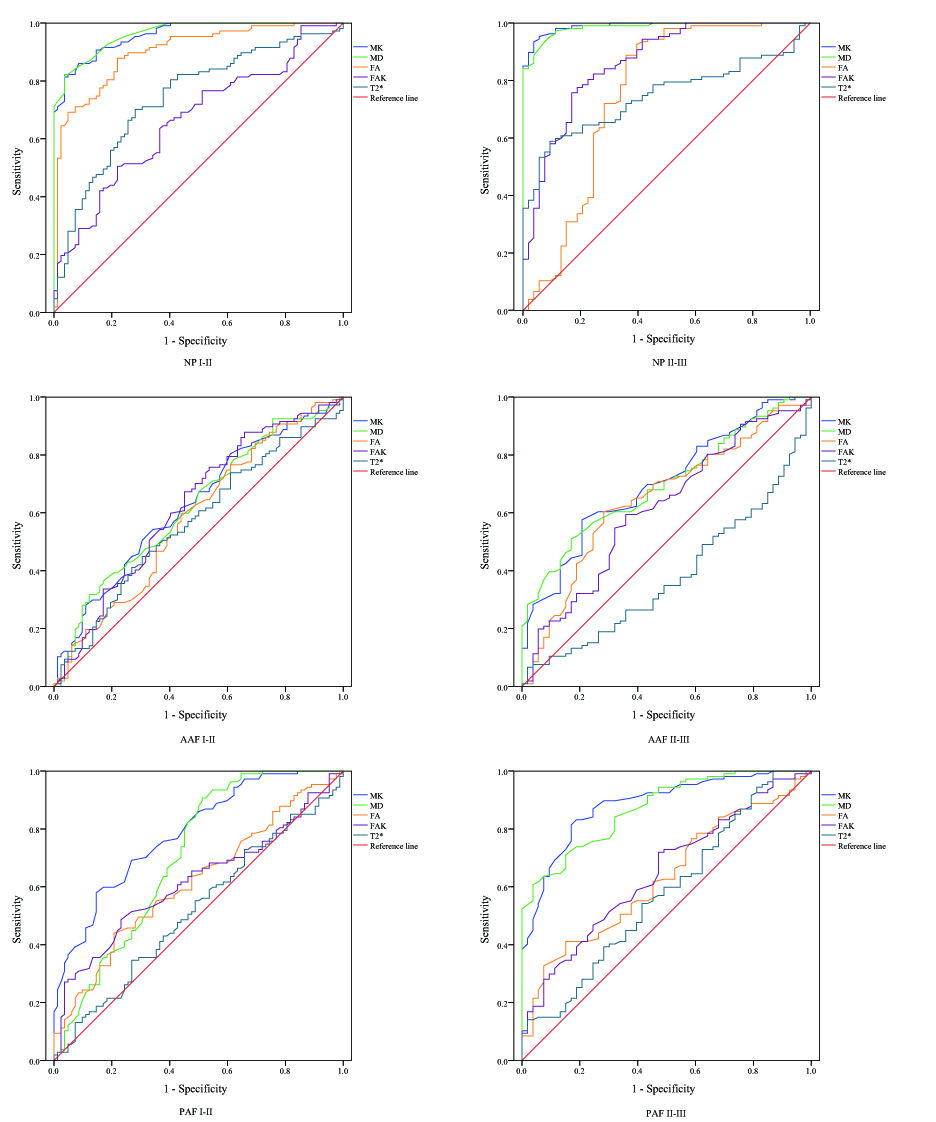
In all, 80 patients (42 female, 38 male,mean age 39.6±14.6years) with low back pain or sciatica were recruited in this study. All the participants underwent MR exams including sagittal T2WI as well as T2* mapping and DKI imaging on a 3.0 T MR scanner (Discovery MR750, GE Healthcare). The lumbar discs were classified into five grades according to the conventional Pfirrmann grade system [5] by two experienced radiologists. T2* map and DKI metrics were then processed using the Omni Kinetics software (GE life science, USA) vendor offered functool software. For each disc, five consecutive ROIs (see Fig. 1)were placed on the MK, MD, FA, FAK and T2*parametric maps to represent five parts of the disc of every disc., Tthe ROI1 and ROI5 averaged measurements respectively represented of AAF and PAF, respectively. And the ROI2, ROI3 and ROI4 represented NP. The average value of ROI1 to ROI5 was treated as the averaged measurements of a whole disc. Spearman rank correlation and Pearson correlation were respectively performed to investigate the relationship between values of each computed parameter and Pfirrmann grade, age. And the Mann-Whitney U test and Dunnett's T3 test were used to examine statistical differences of parameters between genders and intervertebral disc level, respectively. Receiver operation characteristic curves (ROC)were generated for each parameter to assess the area under the receiver operating characteristic curve (AUC) among Pfirrmann grade Ⅰ-Ⅱ and Ⅱ-Ⅲ.Results
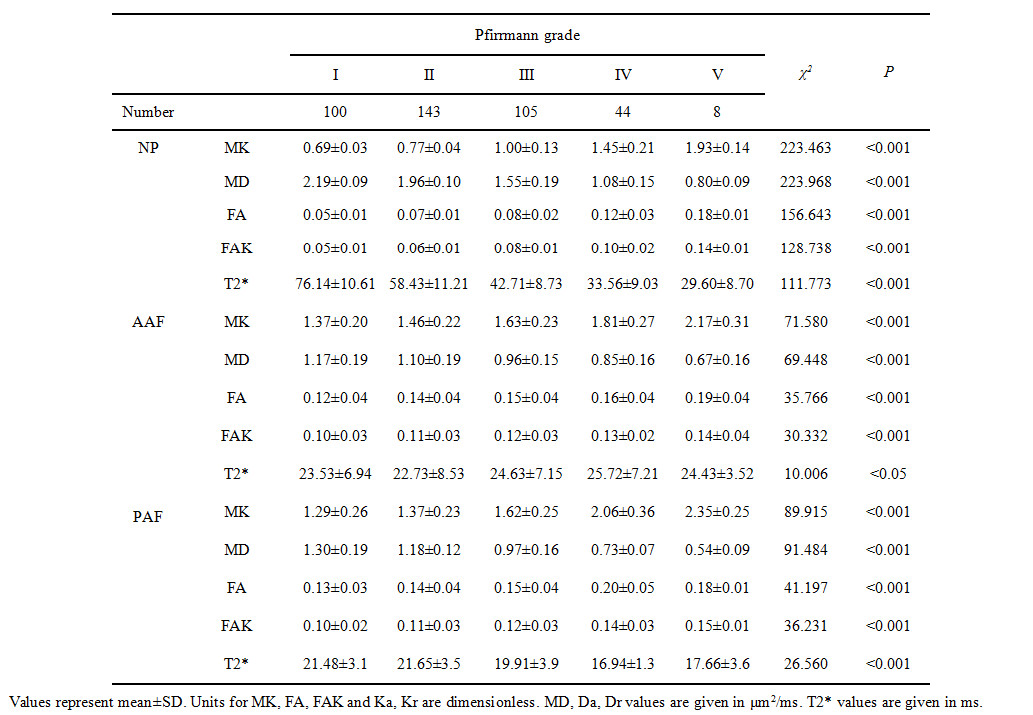
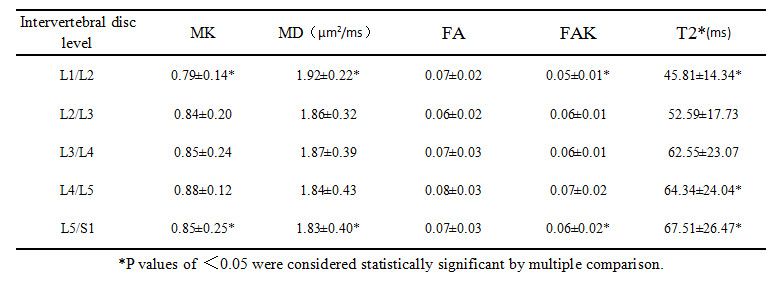
Parametric maps and ROI placement of a typical subject were shown in Fig 1. The mean values of each parameter for each Pfirrmann grade were shown in Table 1. Spearman correlation analysis showed a strong association between Pfirrmann grade and MK, MD, FA, FAK and T2* values for all ROIs (Table 2). The Pearson’s correlation coefficient between comoputed parameters and age were 0.560, -0.625, 0.497, 0.498, -0.403, respectively (all p<0.001). No significance difference between parameters and gender was found. The mean values for each intervertebral disc level were listed in Table 3. The result showed that L5/S1 level’s MK and FAK values were higher than L1/L2 level’s, L5/S1 level’s MD value was lower than L1/L2 level’s and L5/S1 levels’ T2* values were higher than L1/L2 level’s( p<0.05). ROC analysis demonstrated that the AUC value of DKI parameters-MK and is higher than that of T2* value in NP, AAF and PAF.Discussion
DKI is a natural extension of diffusion tensor imaging (DTI). DKI can provide more accurate information about water diffusion and tissue microstructure than conventional diffusion weighted imaging (DWI) and DTI. In this study, our results showed that DKI related parameters and T2* values had significantly association with Pfirrmann grade, which demonstrated that the arrangement of collagenous fiber in intervertebral disc changed from orderd mode to disordered mode with the loss of collagen and water. These two quantitative technologies revealed the process of intervertebral disc degeneration. Current studies have confirmed that age is related to intervertebral disc degeneration. Previous study demonstrated that caudal discs suffered higher stress than caudal discs and were more likely to degenerate [6]. Our finding was in accordance with the research. ROC analysis demonstrated that DKI parameters had significantly greater diagnostic properties than T2* values in early lumbar intervertebral disc degeneration, especially in NP and PAF.Conclusion
DKI related parameters and T2* values had significantly correlation with Pfirrmann grades, disc level and age, but had no significantly correlation with gender. DKI was more sensitive than T2* mapping in quantitative detection of early lumbar intervertebral disc degeneration.Acknowledgements
I would like to thank my supervisor Professor Yunfei Zha for his guidance and Yang Fan from GE Healthcare for his technical assistance.References
[1] Cui YZ, Yang XH , Liu PF,et al.Preliminary study on diagnosis of lumbar disc degeneration with magnetic resonanceT1ρ, T2 mapping and DWI quantitative detection technologies[J].Eur Rev Med Pharmacol Sci,2016,20(16):3344-3350.
[2] Jensen JH, Helpern JA, Ramani A, et al. Diffusional kurtosis imaging:the quantification of non-gaussian water diffusion by means of magnetic resonance imaging[J]. Magn Reson Med, 2005, 53(6):1432-1440.
[3] Li L, Zhu WZ, Chen WW, et al. The study of the intervertebral disc microstructure in matured rats with diffusion kurtosis imaging[J]. Magnetic Resonance Imaging, 2017, 42:101-106.
[4] Ellingson AM, Mehta H, Polly DW, et al. Disc degeneration assessed by quantitative T2* (T2 star) correlated with functional lumbar mechanics[J]. Spine, 2013, 38(24):1533-1540.
[5] Pfirrmann CW, Metzdorf A, Zanetti M, et al. Magnetic resonance classification of lumbar intervertebral disc degeneration[J]. Spine, 2001, 26(17): 1873-1878.[6] Zhang W, Ma XH, Wang Y, et al. Assessment of apparent diffusion coefficient in lumbar intervertebral disc degeneration[J]. Eur Spine J, 2014(23): 1830-1836.
Figures