5044
MR Evaluation of Disco-Vertebral Junction: Effects of Sequence and Parameters on SNR and CNR1Department of Radiology, University of California, San Diego, La Jolla, CA, United States, 2Department of Radiology, Siriraj Hospital, Bangkok, Thailand, 3Institute of Diagnostic and Interventional Radiology, University of Zurich, Zurich, Switzerland, 4Canyon Crest Academy, San Diego, CA, United States, 5General Electric Healthcare, La Jolla, CA, United States, 6Department of Radiology, VA San Diego Healthcare System, San Diego, CA, United States
Synopsis
The disco-vertebral junction of lumbar spine contains thin structures with short T2 values, including cartilaginous endplate (CEP) sandwiched between the bony vertebral endplate (VEP) and nucleus pulposus (NP). We have demonstrated that ultrashort echo time MRI is able to capture signal from cartilaginous endplate, and we sought to further refine the technique by characterizing contrast-to-noise ratio of these tissues when varying echo times are used. Optimal contrast between CEP and VEP was achieved with UTE source image at the shortest TE, while a balanced contrast between all tissues was achieved by Cones Subtraction imaging at a long 2nd TE.
Introduction:
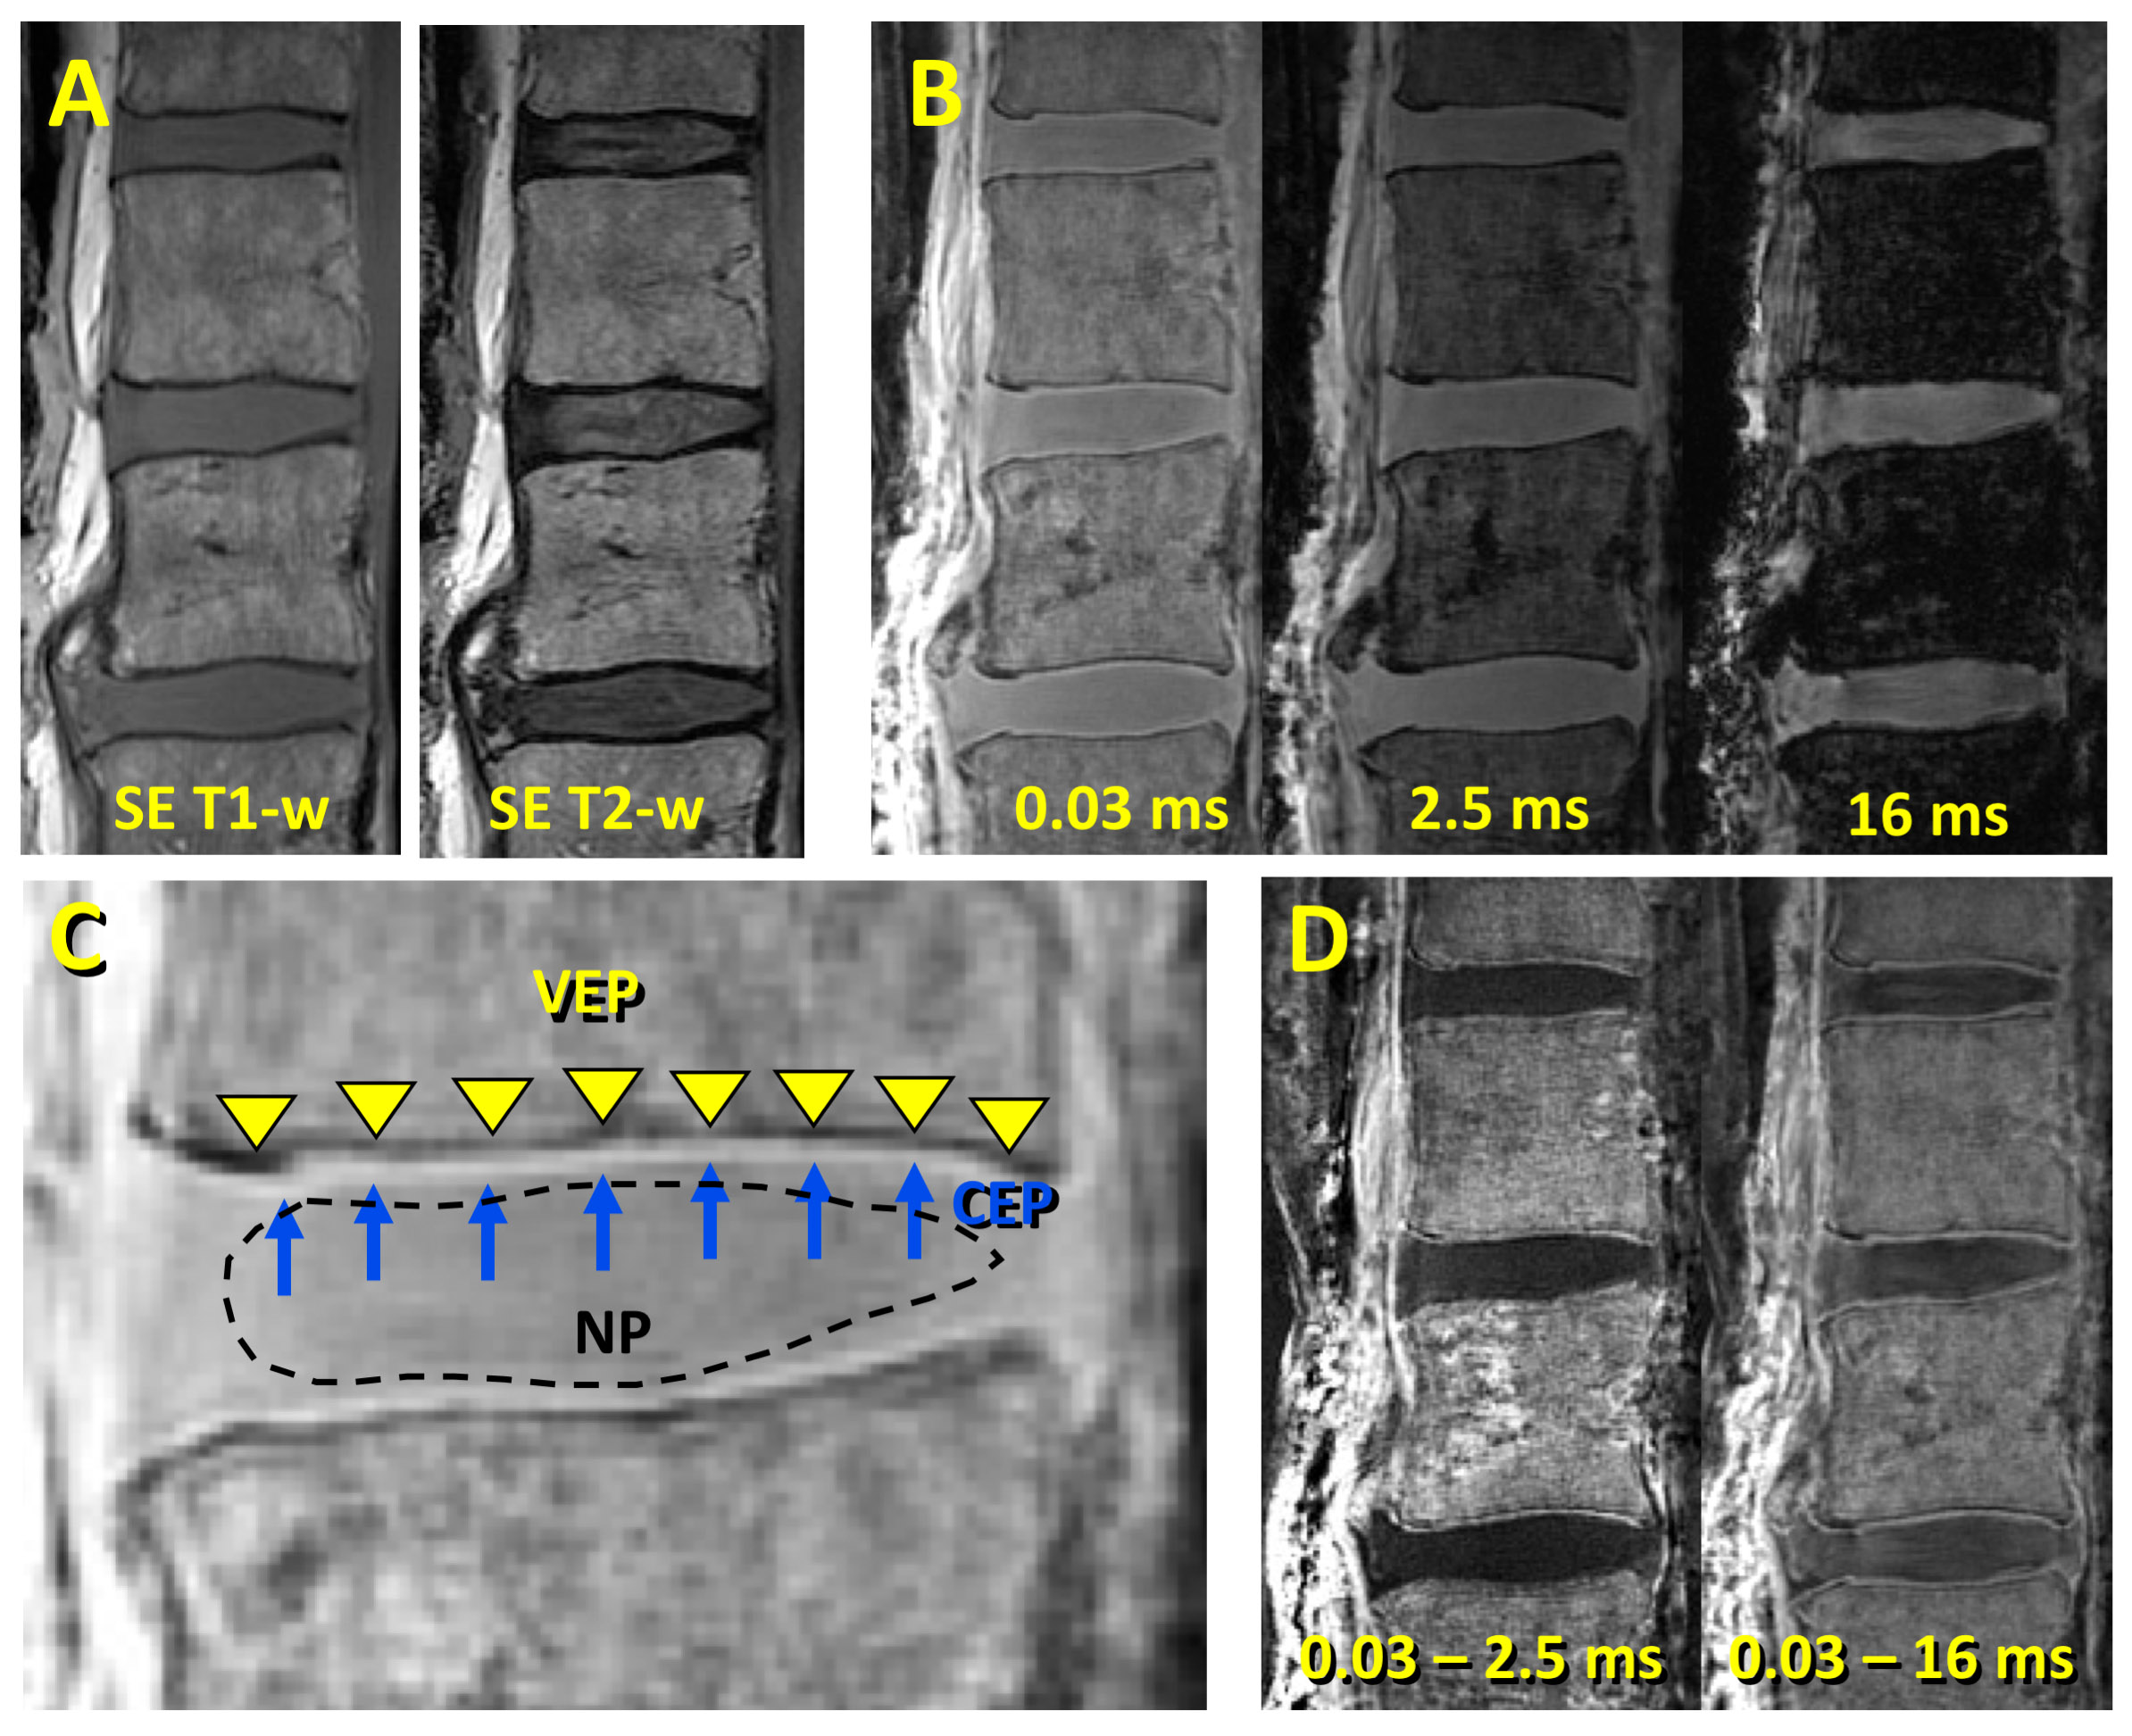
The disco-vertebral junction (DVJ) of human lumbar spine (Figure 1) contains layers of tissues, including cartilaginous endplate (CEP) sandwiched between the bony vertebral endplate (VEP) and nucleus pulposus (NP) of the intervertebral disc.1 The junction serves as a mechanical support and a pathway for nutrient supply2 to the adjacent disc. In a recent study,3 we have demonstrated that ultrashort time-to-echo (UTE) sequences can provide direct imaging of the CEP, unlike conventional spin echo sequences. We further seek to modulate tissue contrast at the DVJ, using UTE sequences along with subtraction technique to accentuate short T2 tissues. Goal of this study is characterizing signal-to-noise ratio (SNR) and contrast-to-noise ratio (CNR) of the CEP, NP, and VEP as a function of MR technique and echo time (TE).Methods:
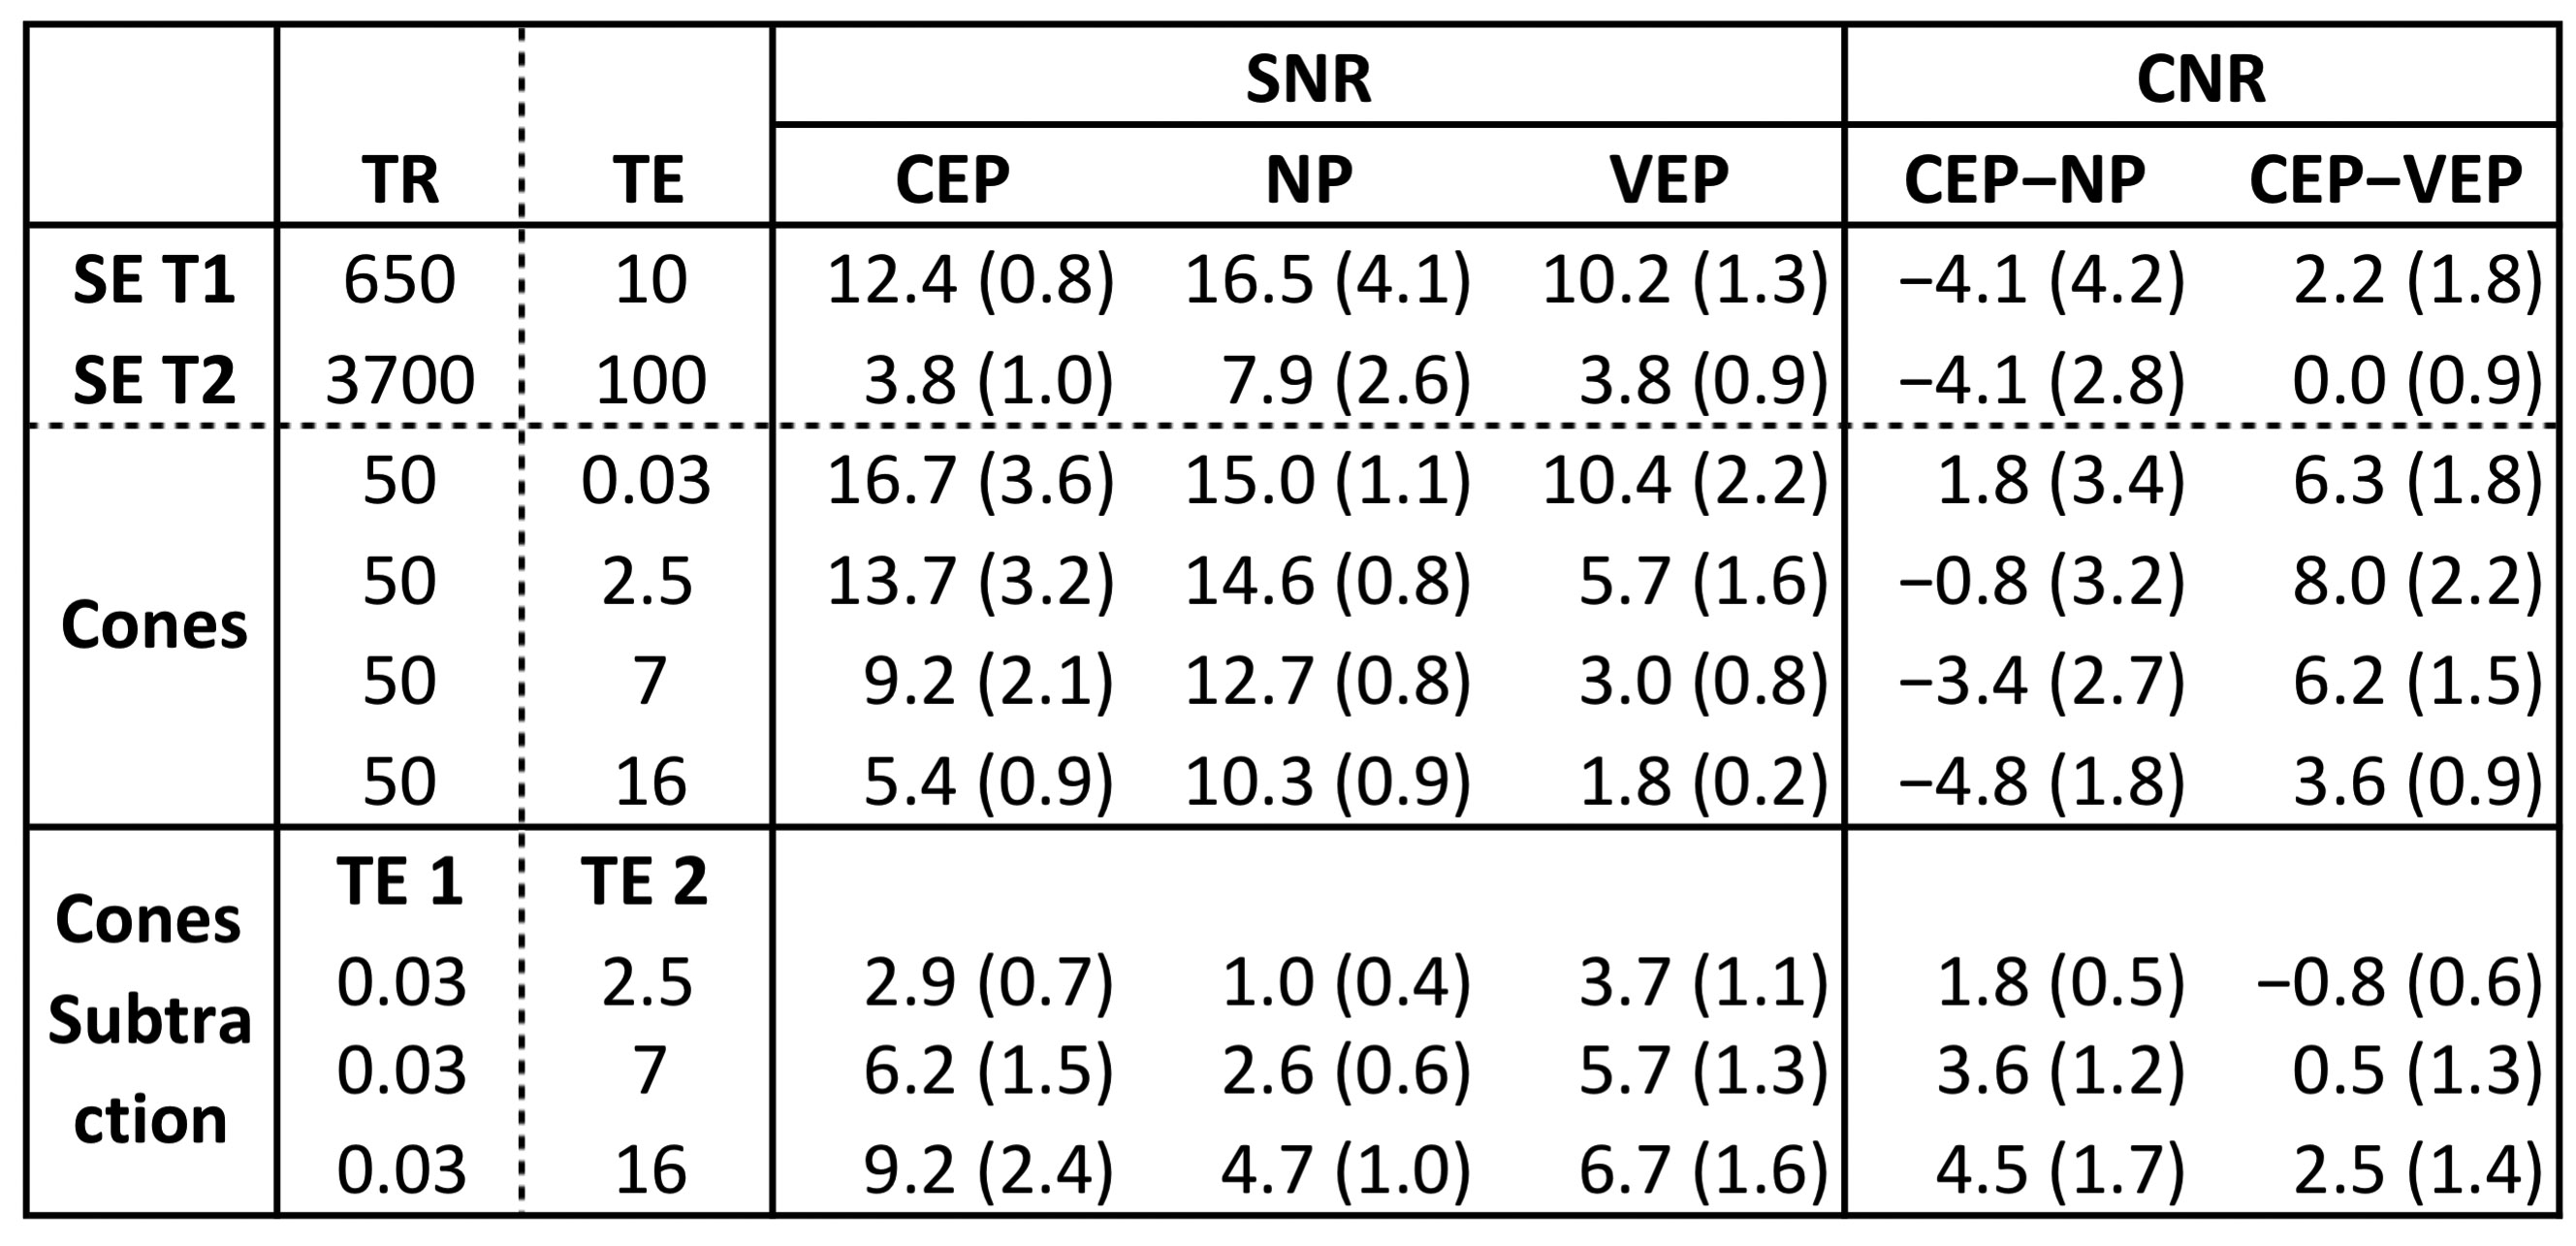
MRI. Cadaveric lumbar spines from 4 donors (3 female, ages 42 to 79) were imaged sagittally at 3-T using: (1) T1-weighted spin echo (TR= 650 ms, TE=10 ms, FOV=20 cm, ph x fr = 384 x 384, slice=2.5 mm), (2) T2-weighted spin echo (Figure 1B: TR=3700 ms, TE=100 ms), and (3) 3D Cones (a UTE sequence) (TR=50, 9 TEs between 0.03 to 16 ms). Cones images were post-processed to create digital Subtraction images (image from TE=0.03 ms minus image from subsequent TEs), which is unknown to accentuate the CEP, but has not been studied systematically. Analysis. On both source (Figure 1A: T1-w and T2-w; Figure 1B: Cones) and Cones subtraction (Figure 1D) images, regions of interest (ROI) were drawn to segment (Figure 1C) VEP, CEP, NP, and air, to obtain average SNR of each tissue. In addition, CNR values for CEP minus NP (CEP-NP) and CEP minus VEP (CEP-VEP) were determined. Effect of sequence (T1-w, T2-w, Cones at TE=0.03) on CNR values were compared using ANOVA. Effect of TE (of the subtracted image) on CNR values were assessed using repeated measure ANOVA.Results:
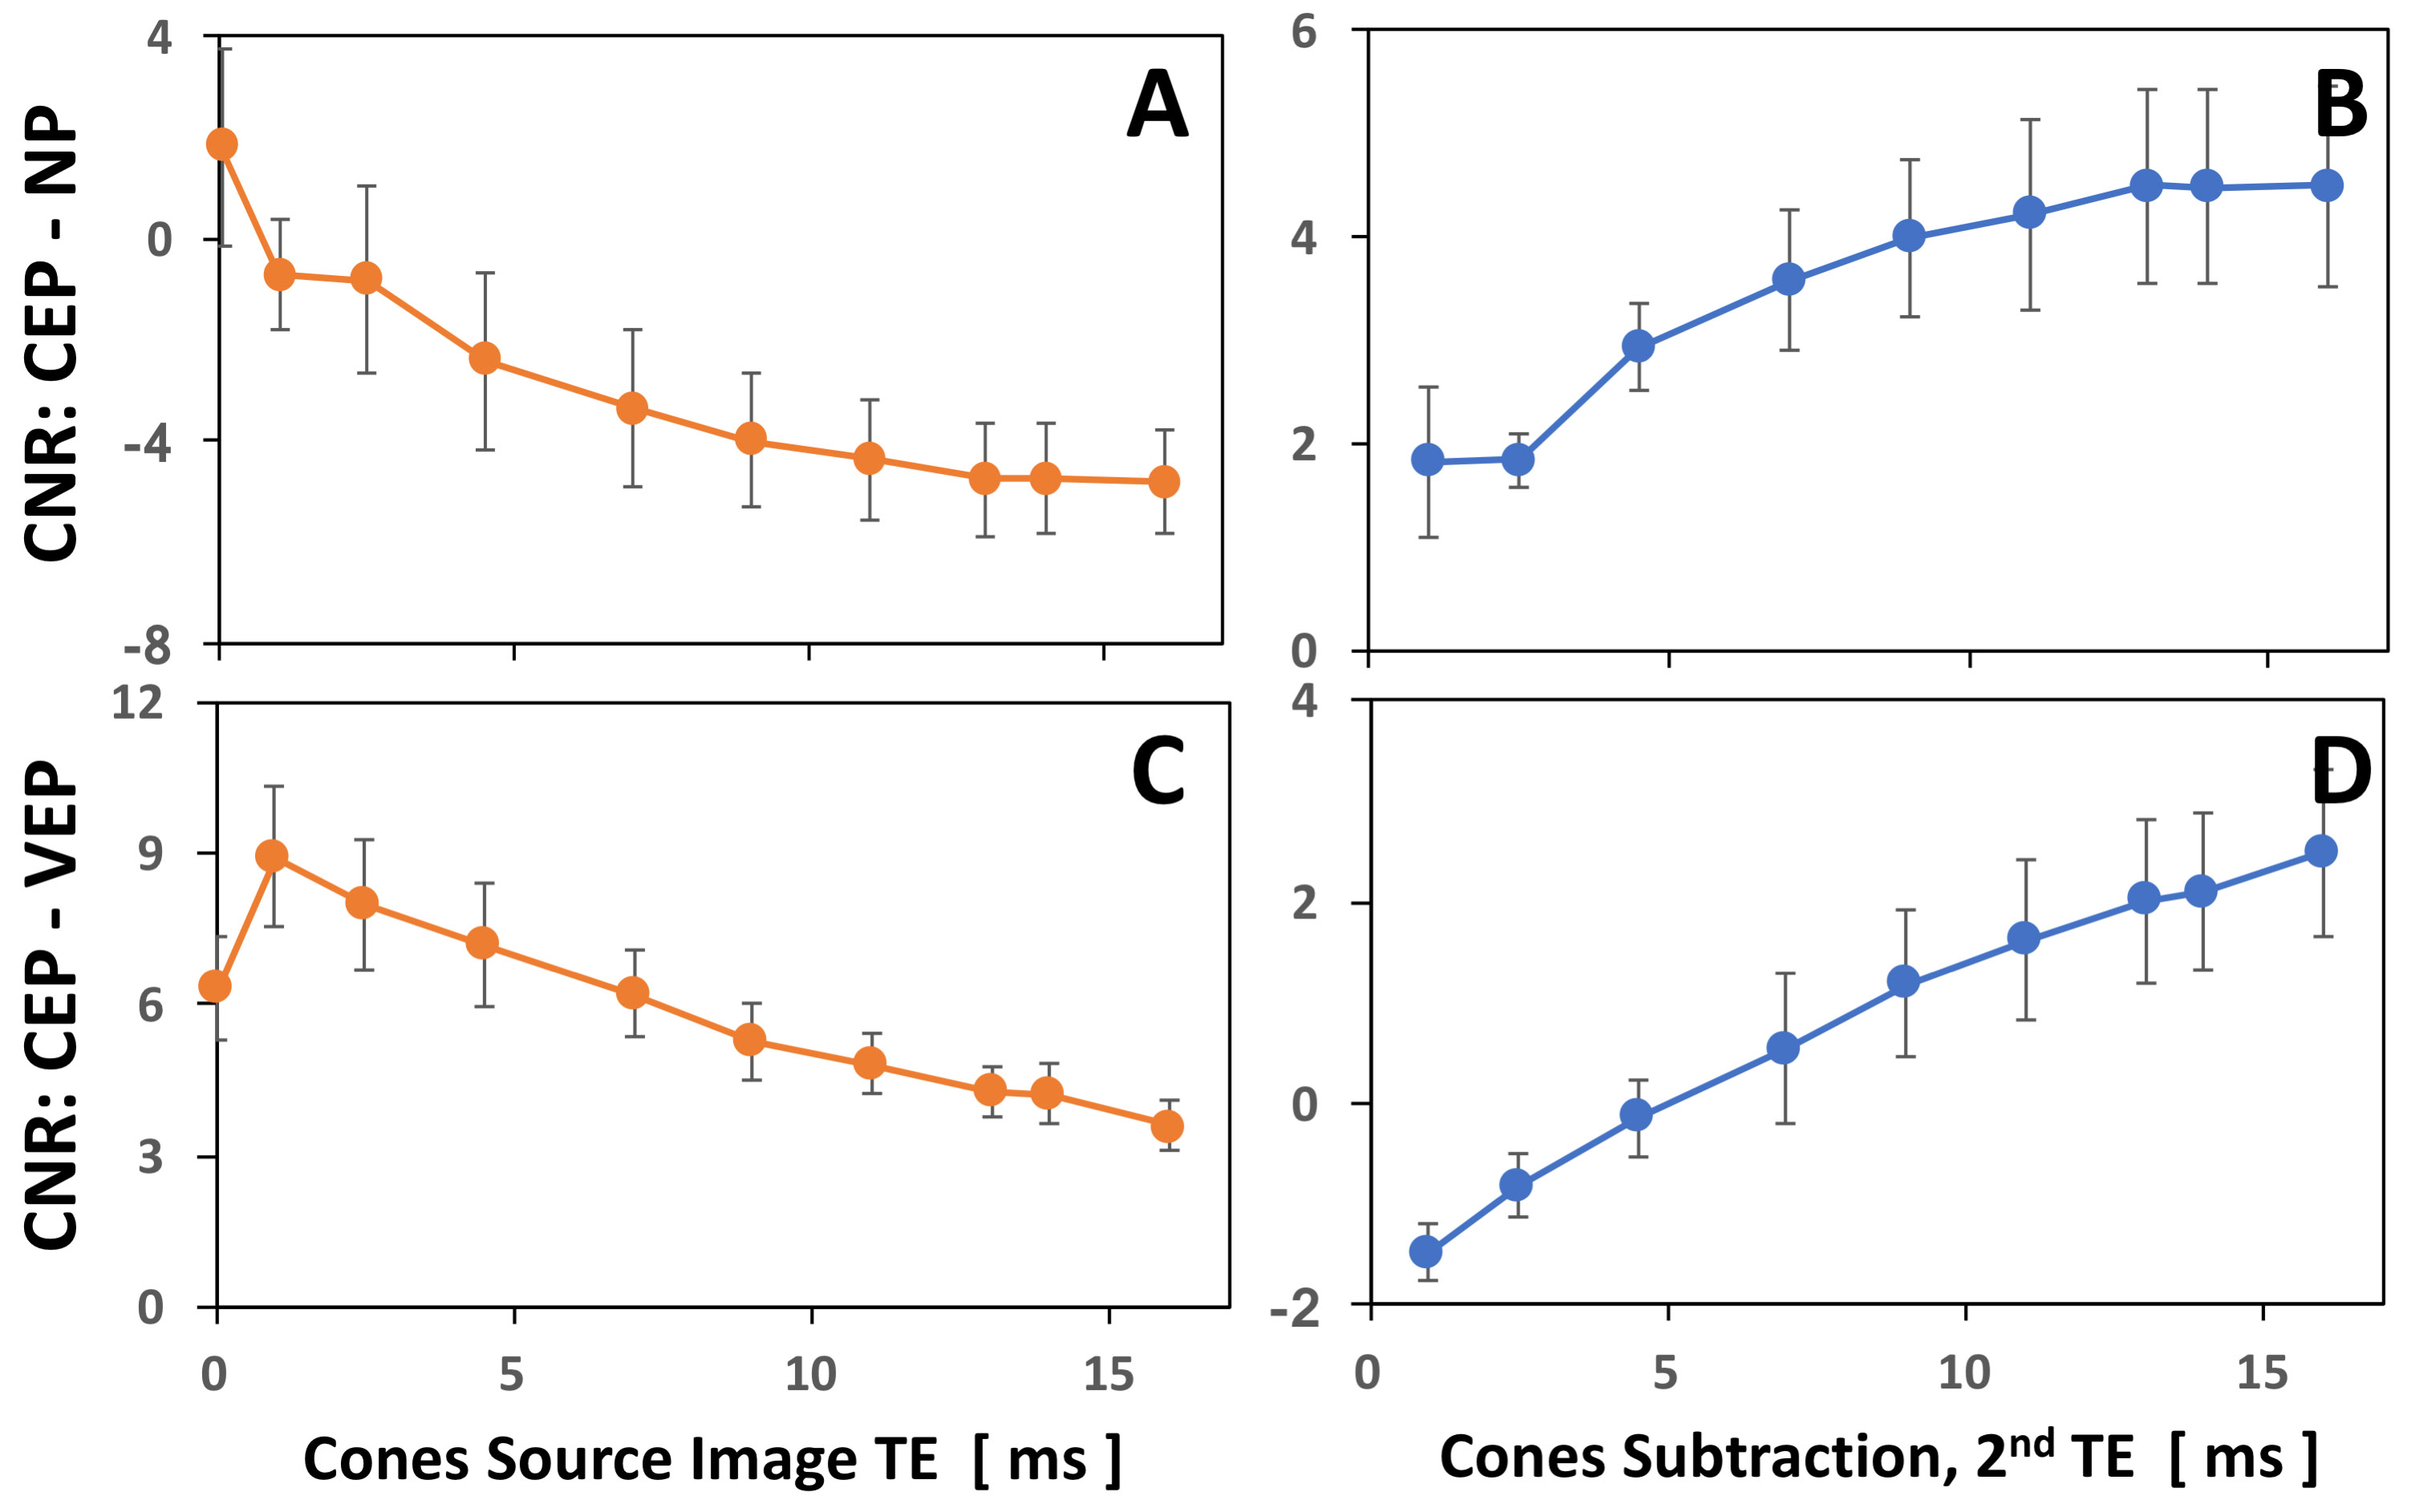
Qualitatively, in spin echo T1-w and T2-w images (Figure 1A), it was difficult to distinguish CEP from the VEP (both had low signal intensity). In Cones source images (Figure 1B), the contrast between CEP vs. VEP, and CEP vs. NP, depended on TE of the image, and the best contrast between all 3 tissues were seen at the shortest TE of 0.03 ms. In Cones Subtraction images (Figure 1D), contrast between DVJ tissues also depended on the TE of the subtracted image. Average SNR and CNR measurements (Figure 2) confirmed these observations quantitatively. In T1-w and T2-w images, CNR of CEP-NP were approximately -4.1 (i.e., lower signal intensity of the CEP than NP), while CNR of CEP-VEP was 2.2 in T1-w, and 0.0 in T2-w images, suggesting very moderate-to-low contrast between the two tissues. In contrast, in Cones source image at the shortest TE, CNR of CEP-NP and CEP-VEP were 1.8 and 6.3, respectively, suggesting a moderate contrast between CEP vs NP but high contrast between CEP vs. VEP (Figure 1B, TE=0.03 ms). These CNR values from Cones source images were markedly different (p=0.1 or lower) than those from T1-w and T2-w images. In Cones Subtraction image at 2nd TE of 16 ms, CNR values were 4.5 and 2.5, respectively, suggesting a higher contrast of CEP vs. NP, but lower contrast of CEP vs. VEP (Figure 1D, right). CNR vs. TE plots (Figure 3) suggested significantly greater CNR values at high TE values of ~10 ms or greater (each p<0.05). The plot also illustrated different combination of image contrasts attainable with varying TE times.Discussion:
This study quantitatively demonstrated different image contrasts that can be generated using Cones images, with and without subtraction, at varying TEs. Parameters can be optimized for CEP-VEP contrast (for bone evaluation) by using Cones source image at the shortest TE, or for a balanced contrast (for CEP evaluation) by using Cones Subtraction image at a long 2nd TE.Conclusion:
3D Cones enables imaging of the DVJ with great contrast between CEP, VEP, and NP, which can be modulated using Subtraction technique and varying 2nd TE.Acknowledgements
This work was supported by grant funding from NIH NIAMS (AR066622) as well as in-kind support from GE Healthcare.References
1. Inoue H. Three-dimensional architecture of lumbar intervertebral discs. Spine 6: 139-146, 1981.
2. Crock HV, Goldwasser M. Anatomic studies of the circulation in the region of the vertebral end-plate in adult Greyhound dogs. Spine (Phila Pa 1976) 9: 702-706, 1984.
3. Bae WC, Statum S, Zhang Z, Yamaguchi T, Wolfson T, Gamst AC, Du J, Bydder GM, Masuda K, Chung CB. Morphology of the Cartilaginous Endplates in Human Intervertebral Disks with Ultrashort Echo Time MR Imaging. Radiology 266: 564-574, 2013.
Figures