5042
Simplified method for estimating chemical exchange rate in human knee cartilage from R1rho dispersion1Radiology and Radiological Sciences, Vanderbilt University Institute of Imaging Science, Nashville, TN, United States
Synopsis
Chemical exchange between water and exchangeable protons in macromolecules in knee cartilage can be quantified by fitting R1ρ dispersion data to a model. However, acquiring the entire dispersion curve is time consuming, which therefore hampers the application in clinical practice. We propose a simple three-point method for R1ρ dispersion data to estimate exchange rate. The method requires data acquired at three selected spin-locking frequencies instead of acquiring a full dispersion curve. The results show good agreement between the proposed method and measurements from the full dispersion data.
Introduction
R1ρ dispersion measurements can assess chemical exchange in knee cartilage, 1 and chemical exchange rates can be estimated either from fitting the dispersion data to a theoretical model, typically the Chopra model, 2 or from the inflection point of the dispersion curve. 3 However, acquiring an entire dispersion curve is time consuming which often hampers its application in clinical practice. In this study, we propose a simple method whereby acquiring data at three selected spin-locking frequencies can be used to estimate chemical exchange rate. The results show good agreement between the proposed and the full dispersion methods.Methods
According to Chopra 2 the chemical exchange contribution to R1ρ dispersion can be described as,
R1ρex = ΔR1ρ = (k·Δw02)/(Δw02 + w12 + k2), [1]
where k is the exchange rate, Δw0 is the chemical shift term, and w1 the spin-locking amplitude. When w1 = 0,
R1ρex = ΔR1ρ0 = (k·Δw02)/(Δw02 + k2). [2]
Previously work from our laboratory has developed an approach that the inflection point of the dispersion curve can be used to estimate the chemical exchange rate. 3 At the inflection point,
3w12 = k2 + Δw02. [3]
Substituting Eq. [3] into Eq. [1], and combining with Eq. [2], we have
R1ρex = ΔR1ρ = 3/4·(k·Δw02)/(Δw02 + k2) = 3/4·ΔR1ρ0. [4]
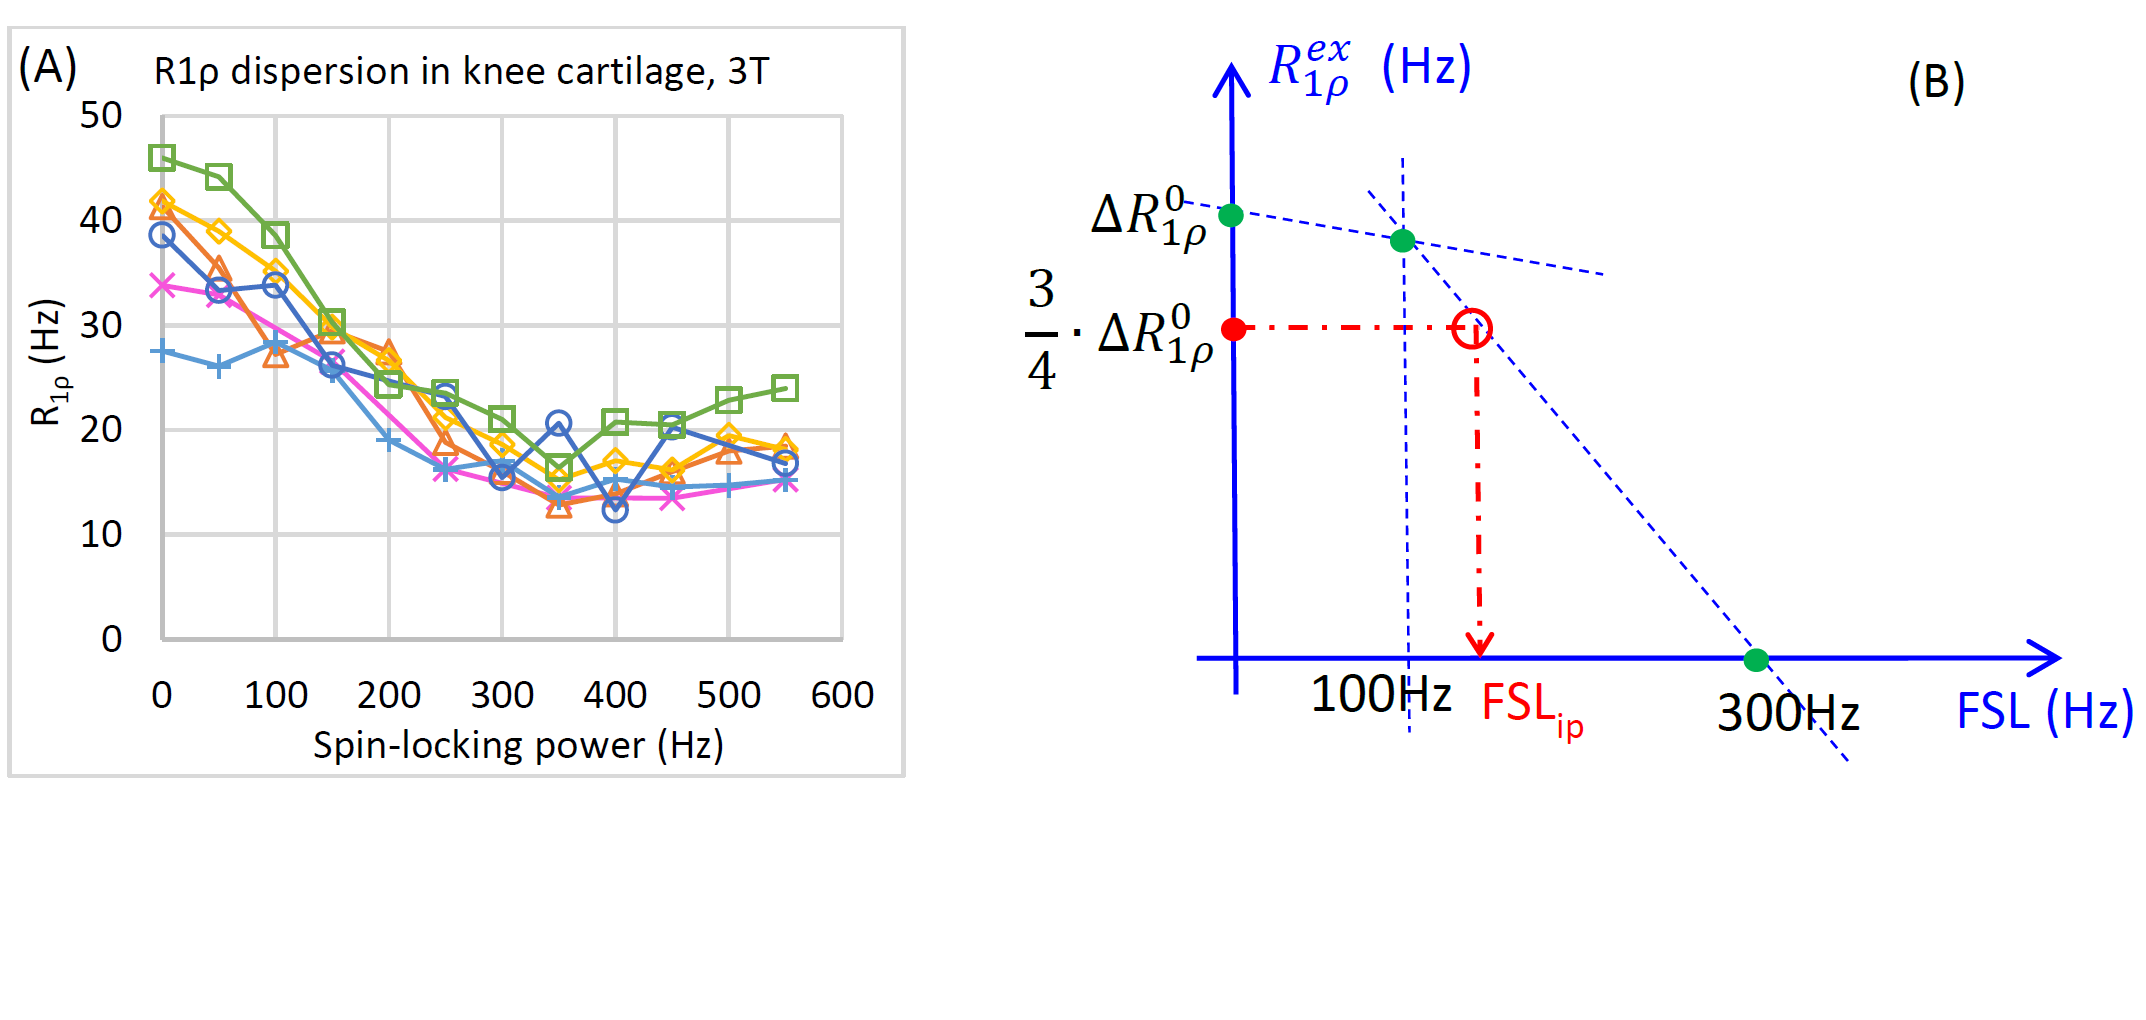
Eq. [4] implies that once ΔR1ρ0 is known, the inflection point of the dispersion curve can be found at ¾ of ΔR1ρ0. Based on our published data in articular cartilage (Figure 1(A)) 1, ΔR1ρ0 may be calculated from the differences at spin-locking frequencies (FSL) between 0Hz and 300Hz. If we acquire another point at, for instance, FSL = 100Hz, the inflection point can be approximately discovered as described in Figure 1(B). The chemical exchange rate is then calculated as:
k = sqrt( 3·w1,ip2 - Δw02 ) = sqrt( 3·(2π·FSLip)2 - Δw02), [5]
where FSLip is the spin-locking frequency at the inflection point. For articular cartilage, the primary exchangeable protons are hydroxyls with a chemical shift of ~1.0ppm, so at 3T Δw0 =2π × 127 × 1.0 (Hz).
All data were acquired on a 3T Philips Achieva scanner. Each subject underwent R1ρ measurements at FSL=[0, 50, 100, 150, 200, 250, 300, 350, 400, 450, 500, 550]Hz for a full dispersion curve, in which the exchange rate can be calculated by finding the inflection point of the dispersion curve (the minimum of the first derivative of the dispersion curve, or the zero-crossing point of the second derivative). In addition, data at FSL= [50, 100, 300]Hz were selected for the three-point method. Finally the exchange rates calculated from the two methods were compared.
Results
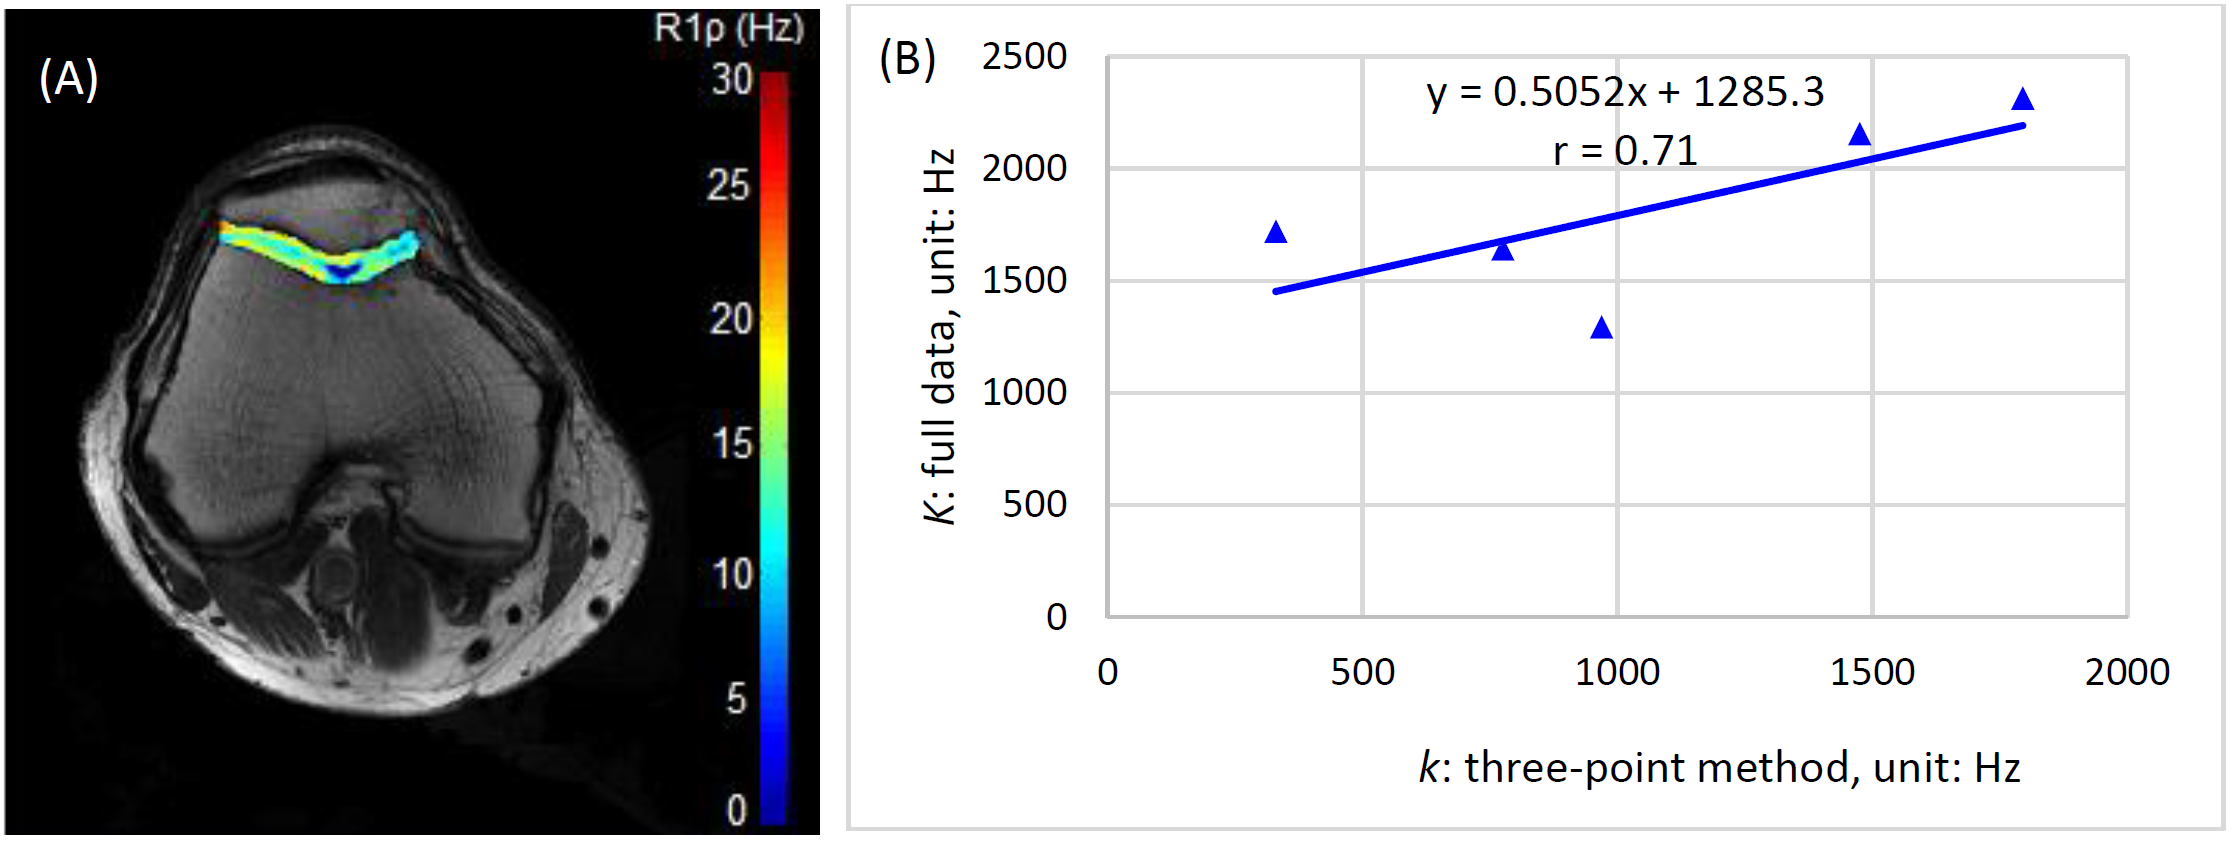
Figure 2(A) shows an example of the R1ρ map of a healthy volunteer, and Figure 2(B) is the correlation of chemical exchange rate k calculated from the proposed three-point method and from the full dispersion data.Discussion
In this study, we propose a three-point R1ρ dispersion method to estimate chemical exchange rate in human knee cartilage. This method is an approximate approach but requires less data so is particularly useful in practical applications. The results from the approximate method are smaller in value but relative values are reliable, which is because for the selected frequencies in the approximate method, the polygon formed by the straight lines is largely inscribed in the dispersion curve. There are errors between the three-point method and the full curve method: first, inherent errors exist because the dispersion curve is approximated by straight lines in the three-point method; second, R1ρ imaging is sensitive to field inhomogeneities. Cartilage has short T1 so a block R1ρ pre-pulse (instead of an adiabatic pulse) is preferred for its short duration but which often leads to some degree of image artifacts. Therefore, a careful calibration of the RF pulse and shimming should be considered in studying dispersion in cartilage.Acknowledgements
No acknowledgement found.References
1. Wang P, Block J, Gore JC. Chemical Exchange in Knee Cartilage Assessed by R1ρ (1/T1ρ) Dispersion at 3T. MRI. 2015; 33(1): 38–42.
2. Chopra SMR, Jordan RB. Rotating-frame relaxation rates of solvent molecules in solutions of paramagnetic ions undergoing solvent exchange. J Magn Reson. 1984; 59:361–372.
3. Cobb JG, Xie J, Gore JC. Contributions of chemical exchange to T1rho dispersion in a tissue model. Magn Reson Med 2011; 66:1563–1571.
Figures