5041
Prediction of the mechanical properties of articular cartilage with QSM and T2* in equine post traumatic osteoarthritis model1Department of Applied Physics, University of Eastern Finland, Kuopio, Finland, 2Research Unit of Medical Imaging, Physics and Technology, University of Oulu, Oulu, Finland, 3Diagnostic Imaging Center, Kuopio University Hospital, Kuopio, Finland, 4Department of Equine Sciences, Faculty of Veterinary Medicine, Utrecht University, Utrecht, Netherlands, 5Department of Orthopaedics, University Medical Center Utrecht, Utrecht, Netherlands
Synopsis
In this study, we investigated the potential of quantitative susceptibility mapping (QSM) and T2* mapping to predict the mechanical properties of equine articular cartilage. To assess the potential of these parameters, they were used to predict the biomechanical properties of cartilage using artificial neural network (ANN) modelling of the 235 mechanical testing points in 20 equine samples representing variable tissue properties. The results indicated that both T2* and QSM correlate moderately with biomechanics (r=0.648 and r=0.652, respectively) and combining these parameters improved the correlation slightly (r=0.714). The study highlights the potential of both quantitative MRI and ANN-analysis in cartilage imaging.
Introduction
In this study, we investigated quantitative 3-D gradient echo MRI of equine articular cartilage with post traumatic osteoarthritis (PTOA). The study focused on T2*-relaxation time- and quantitative susceptibility mapping (QSM) as both can be achieved from simple multi-echo gradient echo scan. Recently, interest in QSM of cartilage has gained increasing attention (1-3) and the purpose of this study was to compare its performance with T2* mapping alone and with a combination of both techniques. To study the potential of these parameters in cartilage imaging, both parameters were used to predict the biomechanical properties of cartilage using artificial neural network (ANN) modelling.Methods
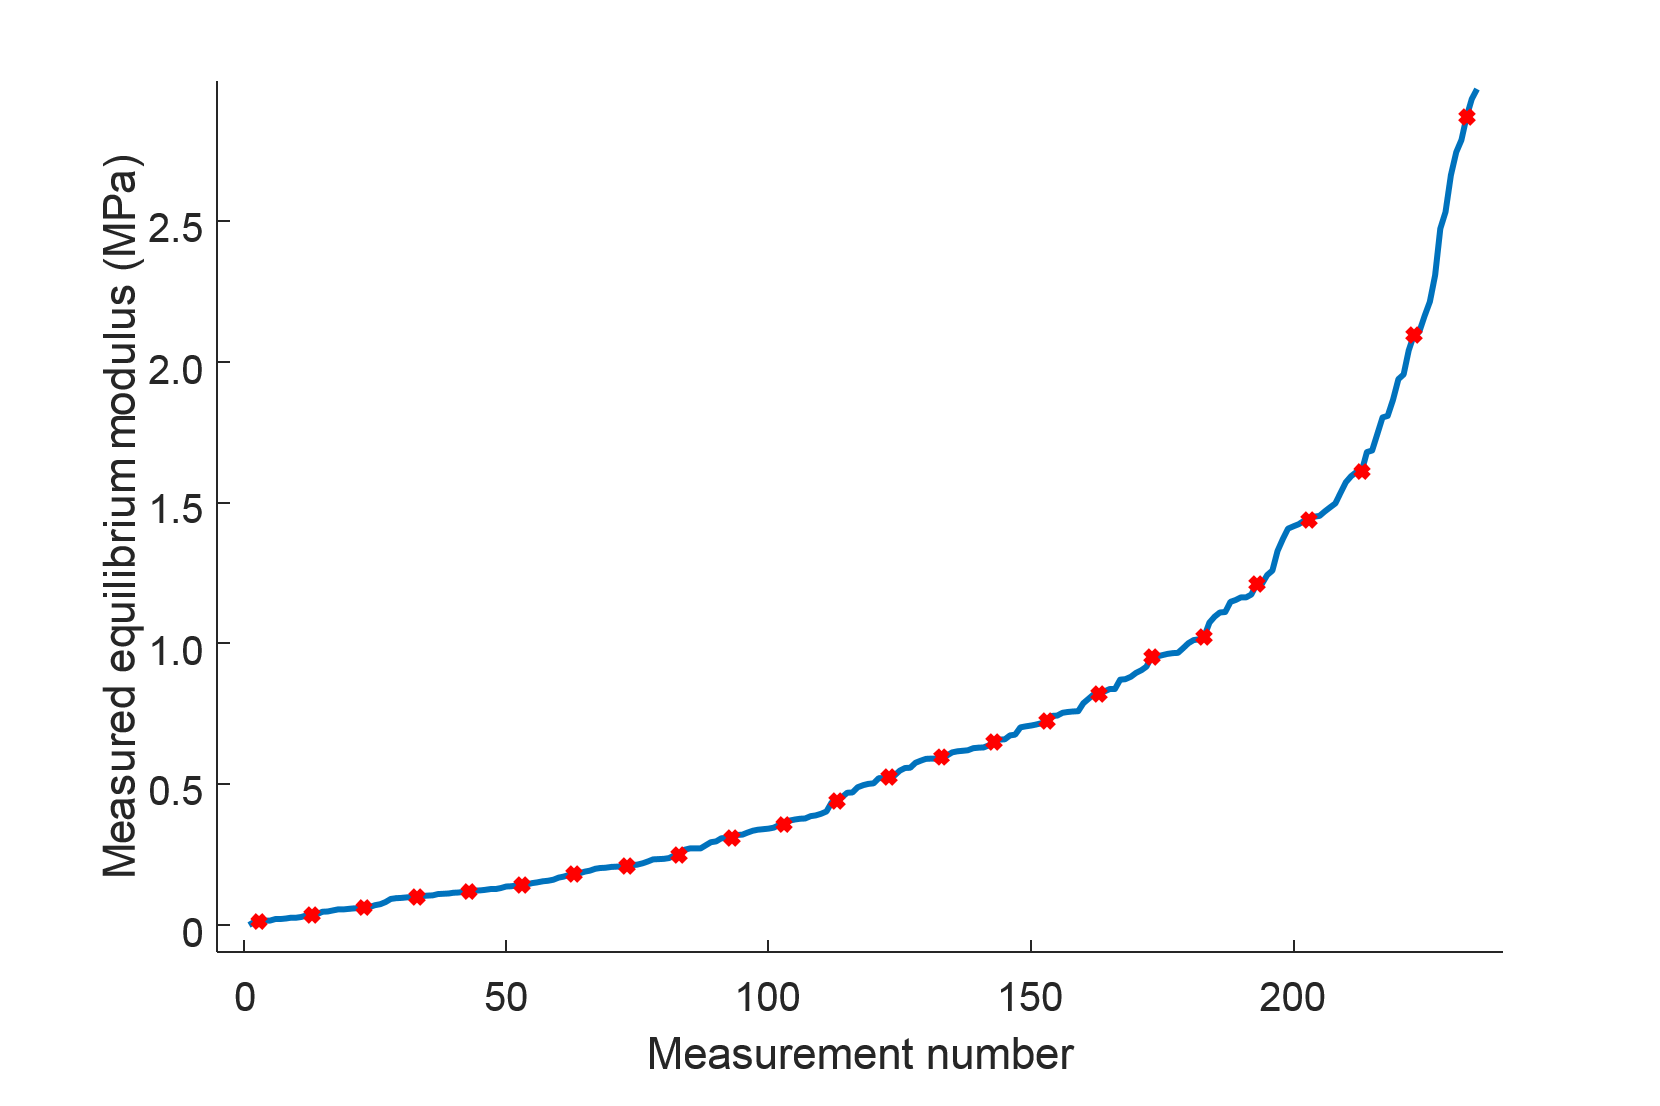
Equine femoral osteochondral samples were acquired from a cartilage repair study (4) (n = 20, 14 PTOA, 6 controls). A total of 235 locations in the samples (with a maximum of 12 locations per sample) underwent biomechanical indentation testing. MRI was performed at 9.4 T using a 19-mm-diameter quadrature RF volume transceiver. The samples were immersed in 1HMRI-signal-free perfluoropolyether inside a thin latex holder. Samples were oriented in such a way that the surface of the cartilage was approximately perpendicular to the main magnetic field of the scanner with extreme care as the orientation-anisotropy has been reported for both T2* and QSM of articular cartilage (2,3,5,6). 3-D-GRE data were acquired at 6 echoes (TE = 2.00-17.25 ms, ΔTE = 3.05 ms, isotropic resolution of 100 µm). T2*-maps were calculated from magnitude data of 3-D-GRE using monoexponential 2-parameter fitting. QSM was performed using total field inversion (7). Both magnitude and phase data were masked with cartilage mask prior to calculations. Depth-wise profiles from the 3-D T2* and QSM maps were calculated using cylindrical 3-D ROIs of 1-mm diameter, carefully matched with the biomechanical testing points. For ANN model training, one hidden layer with two neurons was chosen to avoid overtraining of the model. The Levenberg-Marguardt algorithm was chosen for ANN training. In ANN modelling, data was randomly divided into a training set (90%) and a test set (10%), in such a way that the test set contained a homogenous range of data from the spectrum of biomechanical properties (Fig. 1). Moreover, the modelling was performed multiple times (N=500) to improve network generalization. On each iteration the training dataset was randomly divided to training (80%) and validation (20%) sets. Each trained network was tested with the pre-defined test set to predict test set equilibrium moduli for each individual network. Finally, these test set predictions were averaged and averaged test set prediction was used to calculate correlations. ANN modelling was conducted in MATLAB (Matlab R2016b, MathWorks Inc., Natick, MA, USA) using the neural network toolbox (Version 9.1).Results
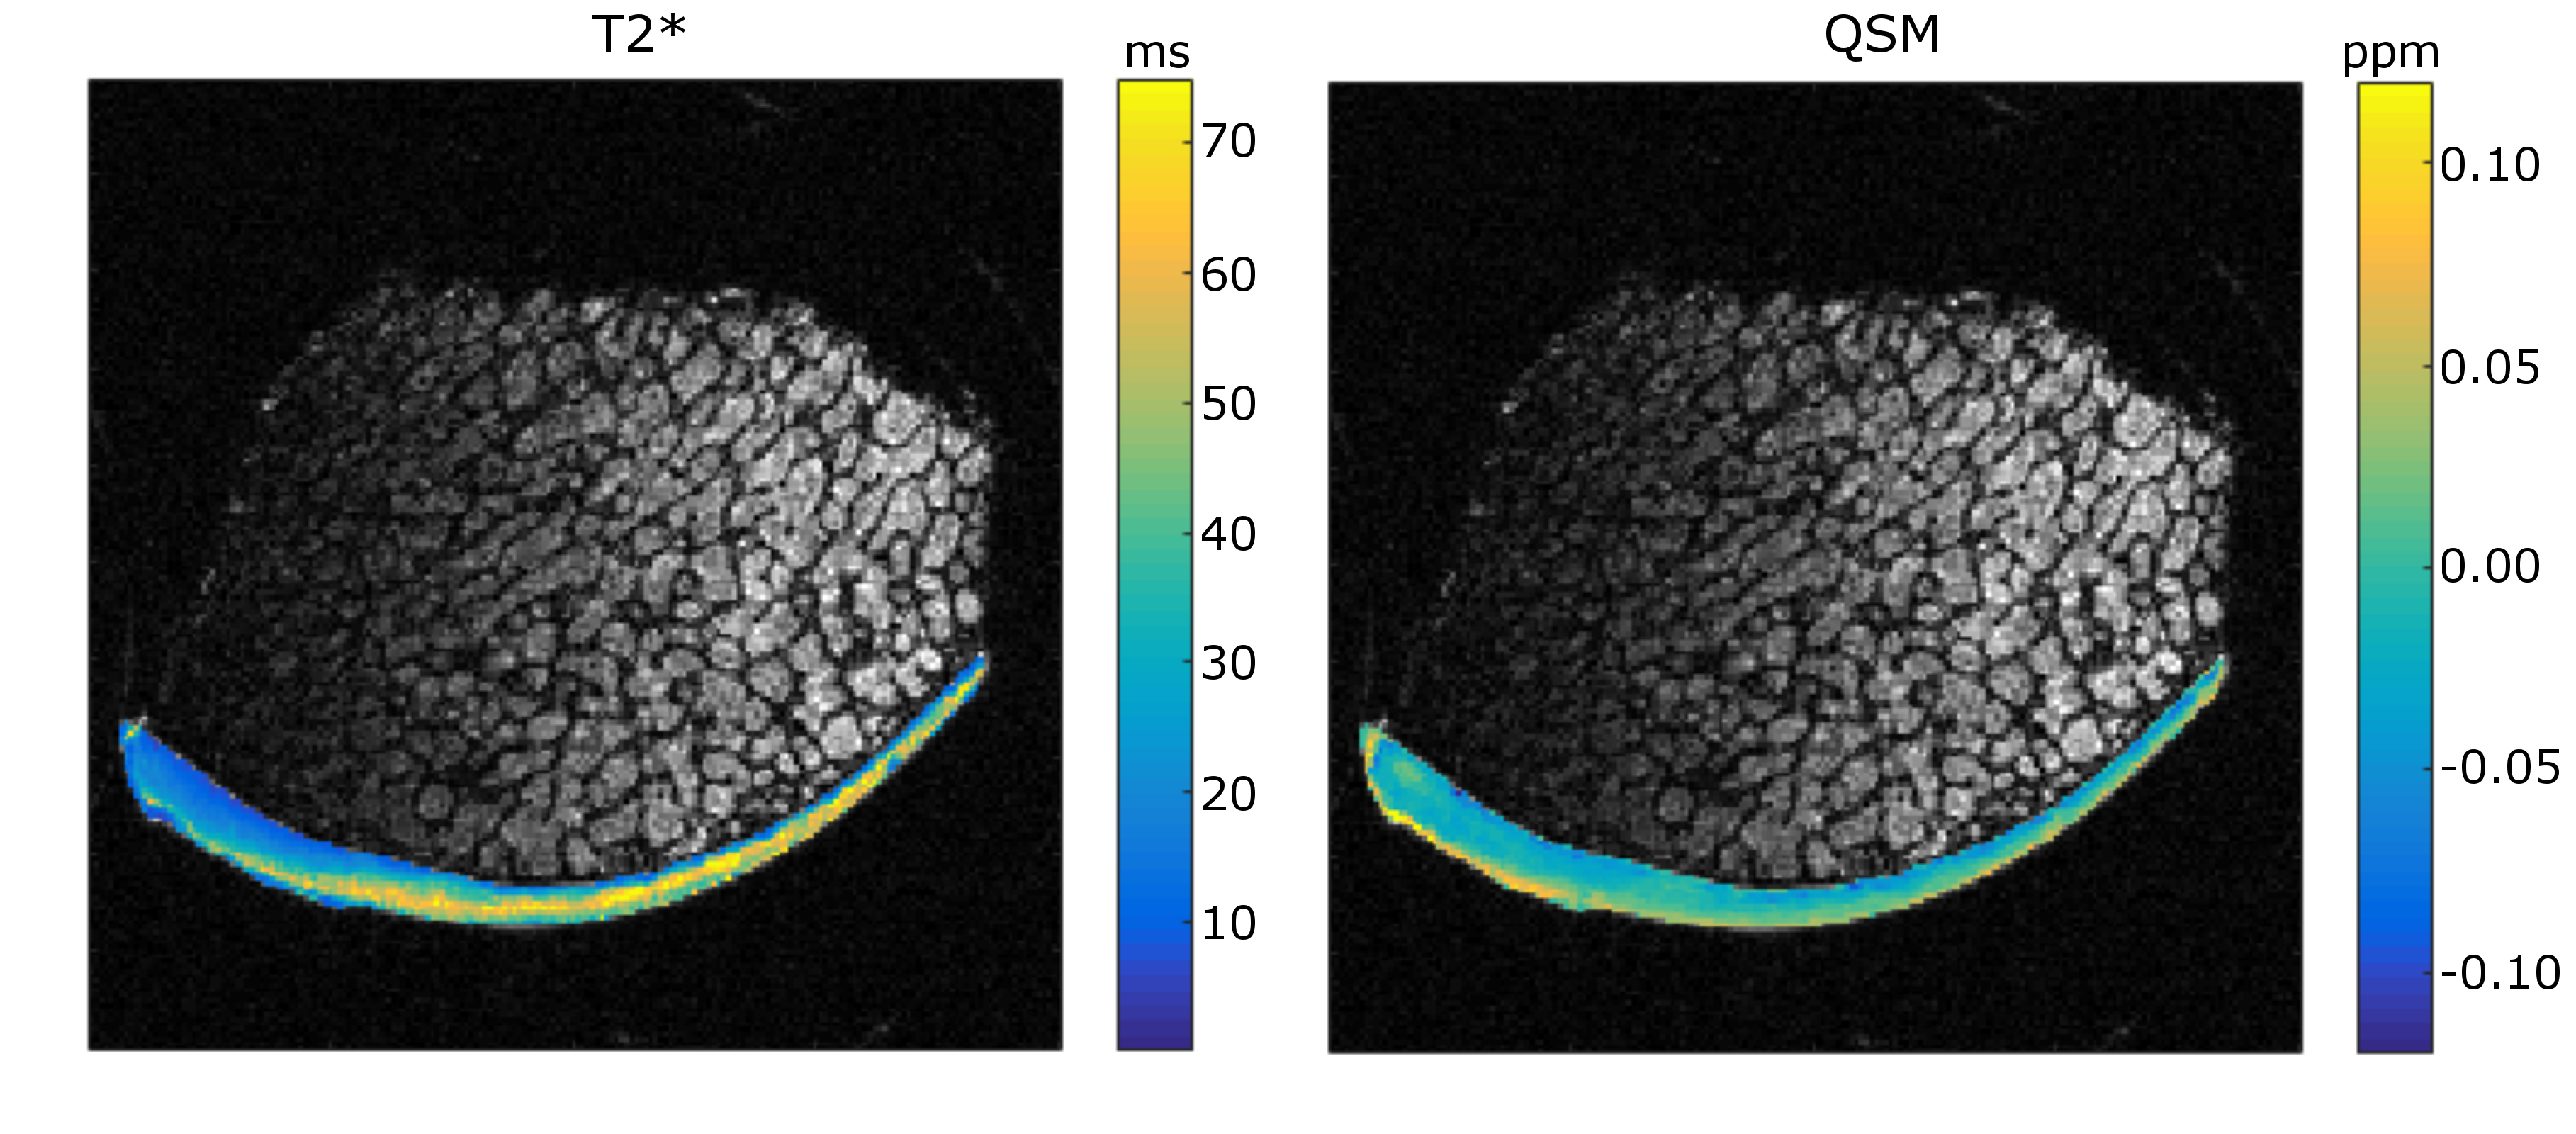
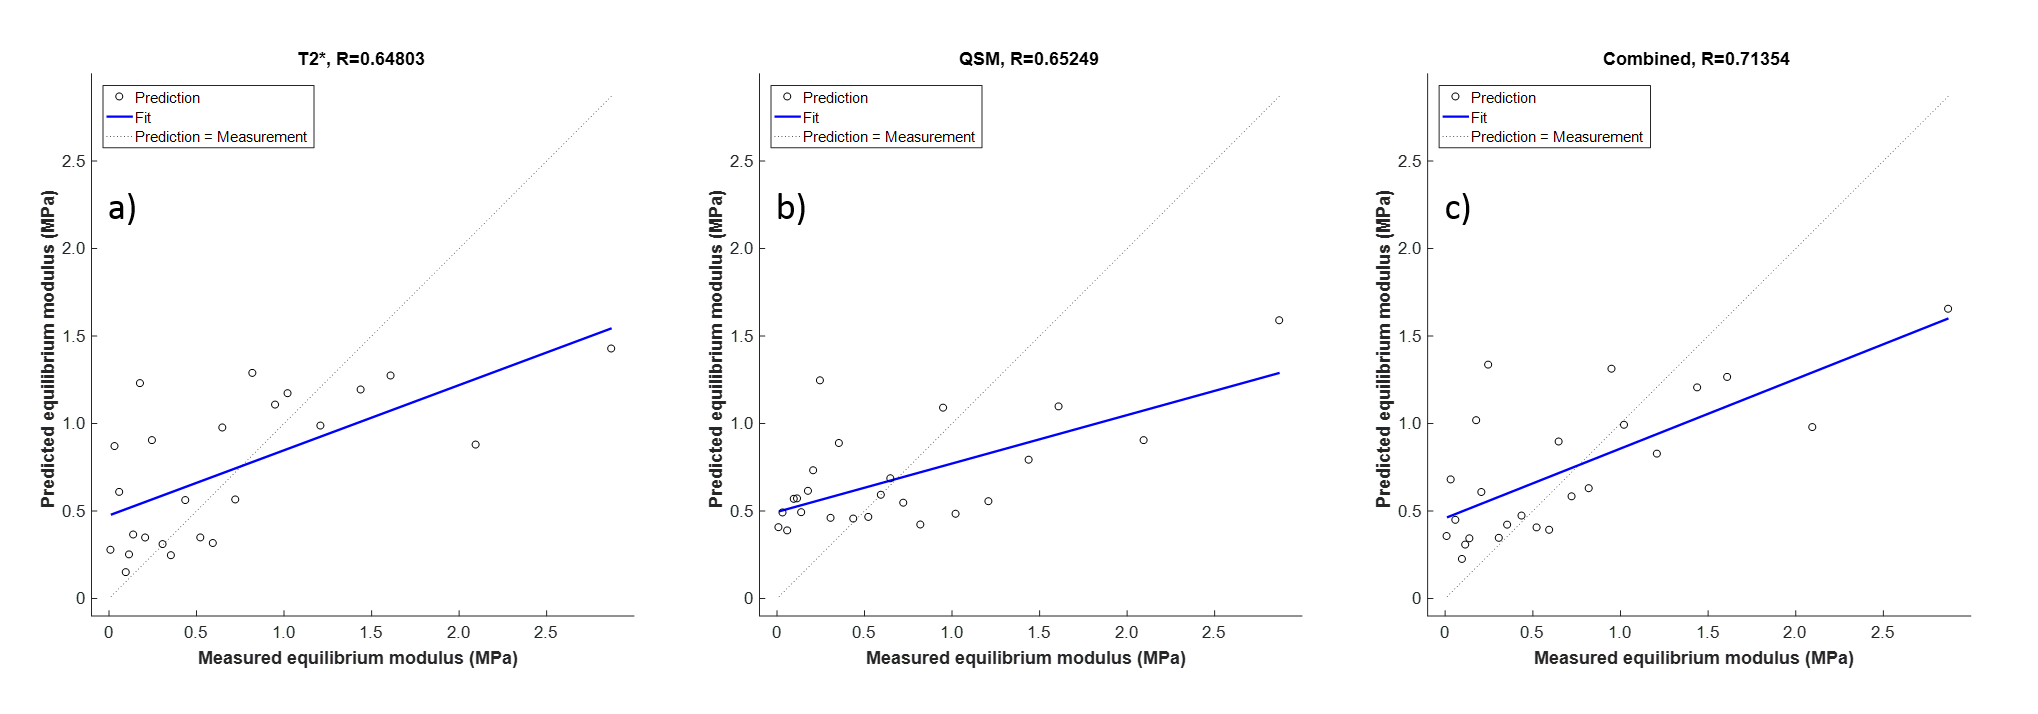
Both QS- and T2* maps displayed characteristics that have been shown for cartilage earlier; T2* map displayed the typical trilaminar structure and QSM values declined from cartilage surface towards cartilage-bone interface (Fig. 2). The averaged test set prediction of the ANN-modelling using T2* had a correlation of 0.648 with the equilibrium modulus from biomechanical testing (Fig. 3a), and a correlation of 0.652 was found between the equilibrium modulus and the test set prediction using QSM in ANN-modelling (Fig. 3b). Combining T2* and QSM gave a correlation of 0.714 (Fig 3c).Disscussion and conclusion
ANN-modelling between quantitative 3-D-GRE MRI and biomechanics was found to be feasible and revealed moderate correlations between MRI and biomechanical properties of articular cartilage. T2* relaxation time and QSM had similar correlations with the biomechanical properties of the tissue. Furthermore, combining these two parameters improved the prediction, as the correlation coefficient between the MRI findings and the equilibrium modulus of cartilage was increased. A limitation of this study was, while carefully controlled, the slightly varying angle between the main magnetic field and the cartilage which may affect the estimates of both parameters. Another limitation is the relatively small number of samples, which only allowed the use of simple networks in modelling. However, this study demonstrates that easily accessible 3-D quantitative MRI may provide valuable information about the mechanical properties of articular cartilage.Acknowledgements
Support from the Academy of Finland (grants #285909 and #293970) is gratefully acknowledged. Dutch Arthritis Foundation (LLP-12 and LLP-22).References
1. Nissi MJ, Toth F, Wang L, Carlson CS, Ellermann JM. Improved Visualization of Cartilage Canals Using Quantitative Susceptibility Mapping. PLoS One 2015;10(7):e0132167. doi: 10.1371/journal.pone.0132167.
2. Wei H, Dibb R, Decker K, Wang N, Zhang Y, Zong X, Lin W, Nissman DB, Liu C. Investigating magnetic susceptibility of human knee joint at 7 tesla. Magnetic Resonance in Medicine 2017.
3. Wei H, Gibbs E, Zhao P, Wang N, Cofer GP, Zhang Y, Johnson GA, Liu C. Susceptibility tensor imaging and tractography of collagen fibrils in the articular cartilage. Magnetic Resonance in Medicine 2017.
4. Mancini IAD, Braganca FM, Brommer H, Visser J, Malda J, Weeren Rv. Objective gait analysis as a tool to improve longitudinal monitoring of long-term large animal studies into cartilage repair. 2016; Sorrento, Italy.
5. Nykänen O, Töyräs J, Kolehmainen V, Rieppo L, Saarakkala S, Shmueli K, Nissi MJ. Quantitative susceptibility mapping of articular cartilage. 2016; Graz, Austria.
6. Hänninen N, Rautiainen J, Rieppo L, Saarakkala S, Nissi MJ. Orientation anisotropy of quantitative MRI relaxation parameters in ordered tissue. Scientific Reports 2017;7.
7. Liu Z, Kee Y, Zhou D, Wang Y, Spincemaille P. Preconditioned total field inversion (TFI) method for quantitative susceptibility mapping. Magnetic Resonance in Medicine 2016.
Figures