5040
DESS vs T1-FLASH 3D-MRI for Knee Cartilage Segmentation: An Evaluation Using Deep 3D-CNN1Health and Medical Equipment, Samsung R&D Institute India Bangalore Pvt. Ltd., Bangalore, India
Synopsis
Automated knee cartilage segmentation can potentially improve the clinical utility of the MRI assessment of knee osteoarthritis due to the convoluted structure of the knee cartilage in 3D. Recently deep convolutional neural network (CNN) have shown better performance for knee cartilage segmentation. Unlike other segmentation algorithms deep-CNN techniques learn the model parameters from the data itself. Therefore, this abstract proposed that deep 3D-CNN techniques can be used to determine the optimal MRI sequence for knee cartilage segmentation and demonstrated that 3D-DESS MRI have statistically better segmentation performance as compared to 3D-T1-FLASH MRI.
Introduction
Knee Osteoarthritis (OA) is most common type of OA. It is the leading cause of the global disability1. Biochemical changes in the knee cartilage leading to mechanical wear and tear are the primary prognosis of the knee OA2. Quantitative MRI such as T1ρ and T2 can access the early biochemical changes in the knee cartilage3. Fat saturated/water-excited 3D-DESS and 3D-T1-FLASH MRI are most common MRI imaging sequences to access the mechanical wear and tear of knee cartilage and track it over time4. However these assessments are limited due to the convoluted structure of the knee cartilage in a 3D volume. Knee cartilage segmentation can potentially improve the clinical utility of the MRI assessment of the knee cartilage. Manual segmentation of the knee cartilage is laborious requiring 118-156 min per subject by experienced radiologists5. Therefore several automated techniques have been developed and compared for segmentation6. Recently deep convolutional neural network (CNN) based deep learning techniques have shown better performance for knee cartilage segmentation7, 8. DESS and T1-FLASH 3D-MRI imaging sequences have shown similar performance while tracking the clinical biomarkers over time by manual segmentation. In this abstract, we have proposed that since unlike other segmentation algorithms deep CNN algorithm learn the model parameters from the data itself, deep 3D-CNN trained and tested completely on a given MRI sequence can be used to determine the optimal MRI sequence for knee cartilage assessment.Method
Patient data was obtained from Osteoarthritis initiative (OAI)9. 88 patients with one baseline and one 12 month follow-up MRI scan was used with labels (femoral cartilage, patellar cartilage, left and right tibial cartilage and left and right menisci) annotated over sagittal 3D-DESS MRI (160 slices, 0.7mm slice thickness, water excitation, FOV of 140mmX140mm, in-plane resolution 0.365mmX0.456mm, TR/TE=16.3ms/4.7ms, flip angle = 25o). Labels were transferred from Sagittal 3D-DESS MRI to Coronal 3D-T1-FLASH MRI (80 slices, 1.5mm slice thickness, water excitation, FOV of 160mmX160mm, in-plane resolution 0.3125mmX0.3125mm, TR/TE=20ms/7.57ms, flip angle = 12o).
Deep 3D-CNN network called µ -Net8 (Figure 1) was used to independently train and test on sagittal-DESS and Coronal T1-FLASH MRI. µ-Net is motivated by 3D U-Net10 and 3D-V-Net11. In addition µ-Net has, Short-skip and long-skip connections to carry out the flow of information within the network, Element wise addition instead of concatenation operation is used in skip connection to reduce memory footprint on the GPU, Input is fed at multiple-resolution in the analysis path to minimize the information lost during down-sampling and an Auxiliary loss layer is added at each step in the synthesis part of the network, to provide a form of deep supervision. Various error metrics (Dice Score (DSC), Volume Overlap Error (VOE), Volume Difference (VD) and Hausdorff Distance of surfaces (ED)) were adopted for comparison of the predicted segmentation results (S) with the reference ground truth segmentation (R),
$$DSC =\frac{2\left |S\cap R \right |}{\left |S\right |+\left |R\right |}$$,
$$VOE =\frac{1-\left |S\cap R\right |}{\left |S\cup R \right |}$$,
$$VD =\frac{\left |S\right |-\left |R\right |}{\left |R\right |}$$
for femoral cartilage, patellar cartilage, left and right tibial cartilage and left and right menisci. Five-fold cross validation with 140 training and 36 test datasets was used to compute the 95% confidence interval (CI) of the measured error metrics. No overlap between the 95% CI was used as a measure for statistically significant difference with p-value of 0.05 between segmentation obtained from DESS and T1-FLASH 3D-MRI.
Results and Discussion
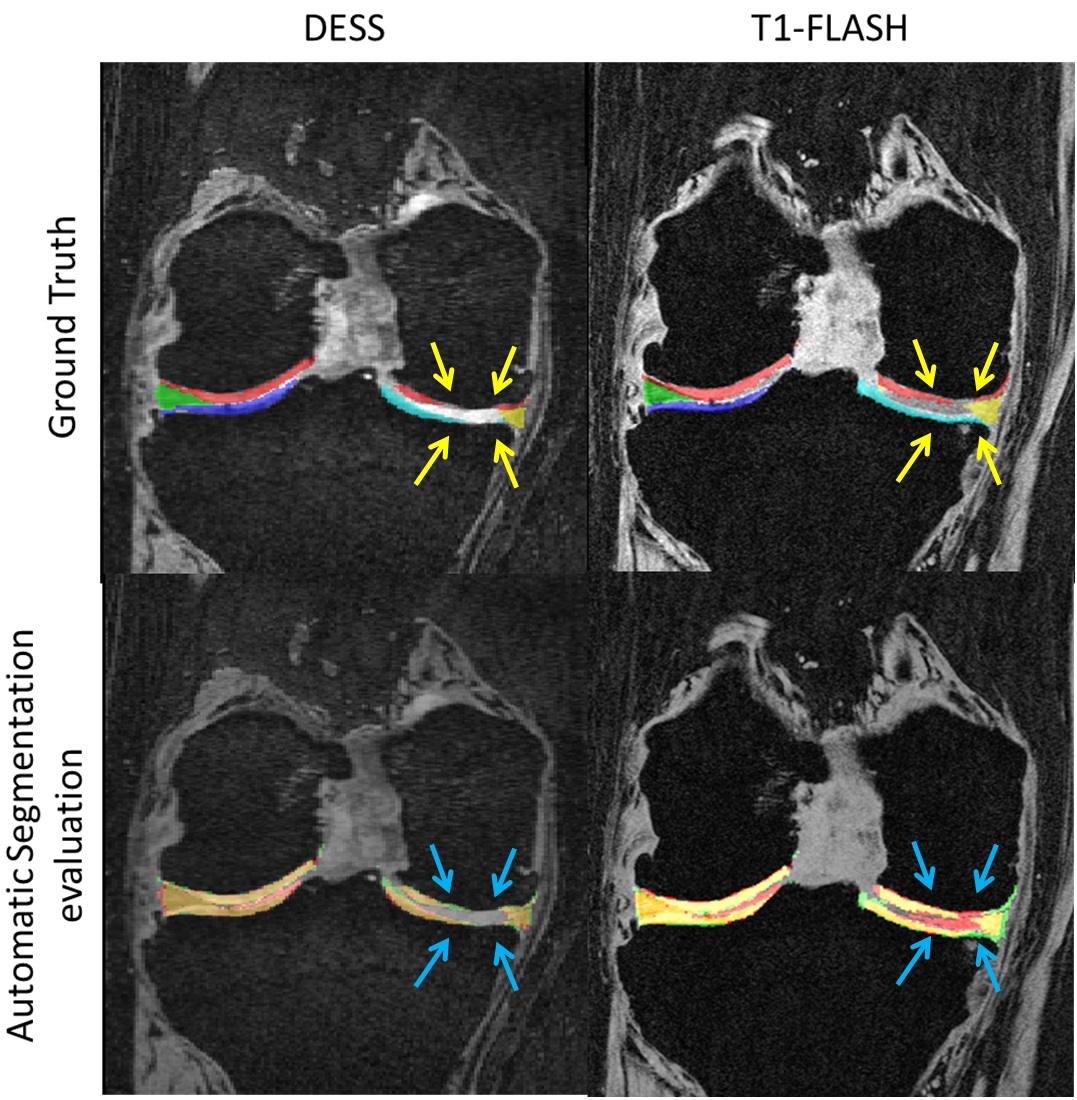
The Error metrics with 95% CI is shown in Table 1 with statistical significant difference highlighted in green. 3D-DESS has shown better performance than 3D-T1-FLASH in terms of DICE scores, VOE and Avg HD, while difference is not statistically significant for VD. Overall, 3D-DESS has smaller 95% CI range as compared to 3D-T1-FLASH suggesting more robust automated cartilage segmentation on 3D-DESS datasets. Figure 2 shows an example comparison of reformatted mid-coronal slice of the 3D-DESS and mid-coronal slice of 3D-T1-FLASH of the same patient highlighting better segmentation performance of the 3D-DESS. Synovial fluid (yellow arrow in ground truth) is incorrectly segmented as menisci in the 3D-T1-FLASH (red arrow) due to improved image contrast between synovial fluid and adjacent tissue.Conclusion
In this abstract we have demonstrated that 3D-CNN based deep learning techniques can be used to determine the optimal sequence for knee cartilage segmentation. 3D-DESS MRI is shown to have statistically better performance for automated knee cartilage segmentation as compared to 3D-T1-FLASH MRI. However, no statistically difference in volume computed from the segmentation was found between the two MRI pulse sequences. Further assessment is required to determine if the difference in segmentation is clinically significant.Acknowledgements
No acknowledgement found.References
[1] Cross, M., Smith, E., Hoy, D., et. al., The global burden of hip and knee osteoarthritis: estimates from the global burden of disease 2010 study, Annals of the rheumatic diseases, 2014.
[2] Gray, M.L., Eckstein, F., Peterfy, C et. al., Toward imaging biomarkers for osteoarthritis, Clinical orthopaedics and related research. 2004; S175-S181.
[3] Eckstein, F., Burstein, D. and Link, T.M., Quantitative MRI of cartilage and bone: degenerative changes in osteoarthritis. NMR in Biomedicine. 2006; 19(7): 822-854.
[4] Eckstein, F., Hudelmaier, M., Wirth, W. et. al. Double echo steady state magnetic resonance imaging of knee articular cartilage at 3 Tesla: a pilot study for the Osteoarthritis Initiative. Annals of the rheumatic diseases. 2006; 65(4): 433-441.
[5] Shim, H., Chang, S., Tao, C. et. al., Knee Cartilage: Efficient and Reproducible Segmentation on High-Spatial-Resolution MR Images with the Semiautomated Graph-Cut Algorithm Method, Radiology : 2009, 251(2); 548-556.
[6] Heimann, T., Morrison, B.J., Styner, M.A. et al., Segmentation of knee images: A grand challenge. Proc. MICCAI Workshop on Medical Image Analysis for the Clinic. 2010 : 207-214.
[7] Prasoon, A., Petersen, K., Igel, C. et al., Deep feature learning for knee cartilage segmentation using a triplanar convolutional neural network. MICCAI, 2013 : 246-253
[8] Raj A., Ajani B., Krishnan K., et. al., 3D Deep Learning Based Cartilage Segmentation for Visualization and Analysis of Quantitative MRI for Osteoarthritis. Proc. of 10th ISMRM Workshop on Osteoarthritis Imaging, 2017.
[9] Peterfy, C.G., Schneider, E. and Nevitt, M., The osteoarthritis initiative: report on the design rationale for the magnetic resonance imaging protocol for the knee. Osteoarthritis and cartilage, 2008 (16.12): 1433-1441.
[10] Çiçek, Ö., Abdulkadir, A., Lienkamp, S.S. et al., 3D U-Net: learning dense volumetric segmentation from sparse annotation. International Conference on MICCAI, 2016:424-432.
[11] Milletari, F., Navab, N. and Ahmadi, S.A., V-net: Fully convolutional neural networks for volumetric medical image segmentation, 3D Vision (3DV), 2016 Fourth International Conference on. IEEE, 2016 : 565-571.
Figures