5039
A composite metric R2-R1ρ measures an incomplete anisotropic R2 of human femoral cartilage at 3T1Radiology, University of Michigan, Ann Arbor, MI, United States, 2Orthopedic Surgery, University of Michigan, Ann Arbor, MI, United States, 3School of Kinesiology, University of Michigan, Ann Arbor, MI, United States
Synopsis
The composite relaxation metric R2-R1ρ, a potential MR imaging biomarker for detecting early cartilage degeneration, was shown as an incomplete orientation-dependent R2 at 3T. Both R2 and R1ρ mappings of femoral cartilage were performed on two subjects, and the constructed composite metrics were compared to the anisotropic R2 values that were extracted from a single 3D T2W dataset using a newly developed method. The preliminary results demonstrated that the orientation-dependent information derived from two completely different methods was comparable, implying that the diagnostically most relevant information in knee or other joint cartilage could be easily and efficiently obtained.
Introduction
A composite metric $$$R_2-R_1\rho$$$ was recently proposed as a potential MR imaging biomarker for detecting early cartilage degeneration1. However, this new metric necessitates lengthy data acquisitions and subsequent involved image post-processing. In this work, we show that the proposed metric basically measured an incomplete anisotropic $$$R_2$$$, and compare the measured $$$R_2-R_1\rho$$$ to anisotropic $$$R_2$$$ of femoral cartilage in two subjects, where the latter was derived using an efficient and a simple method that was recently developed2.Theory and Method
Free water proton longitudinal relaxation rate in the rotating frame $$$R_1\rho$$$ reduces to transverse relaxation rate $$$R_2$$$ when molecular rotational correlation time $$$\tau_c$$$ is in the range of picoseconds (ps)3. In ordered tissues like cartilage, some water molecules are restricted to preferential orientations, resulting in an increased $$$\tau_c$$$ to a range of micro- to milliseconds ($$$\mu$$$s-ms)4. In this slow rotation scenario, $$$R_1\rho$$$ could be truncated to $$$R_2/(1+4\omega_1^2\tau_c^2)$$$ by neglecting insignificant contributions from high-frequency dipolar interactions, where $$$\omega_1$$$ is the spin-lock RF amplitude.
Non-zero averaging dipolar interaction was revealed as the dominant relaxation mechanism in cartilage at 3T5. Given fast exchange between free and bound water, $$$R_2$$$ could be ascribed to an isotropic ($$$R_2^i$$$) and an anisotropic ($$$R(\theta)_2^a=R_2^a*((1-3cos^2\theta)/2)^2$$$) contributions6. Likewise, $$$R_1\rho$$$ can be characterized with $$$R_2^i$$$ and $$$R(\theta)_2^a/(1+4\omega_1^2\tau_c^2)$$$ , assuming that $$$R_2^i$$$ and $$$R(\theta)_2^a$$$ are, respectively, induced by ps and µs-ms time-scale dynamics. Hence, $$$R_2-R_1\rho$$$ can be written as $$$R(\theta)_2^a(4\omega_1^2\tau_c^2/(1+4\omega_1^2\tau_c^2))$$$ or $$$R(\theta)_2^a$$$ when $$$\omega_1\tau_c>>1$$$.
$$$R_2$$$ mapping was acquired using an interleaved multi-slice multi-echo TSE sequence using TE of n*6.1 ms, n=1 to 8. The reconstructed voxel size was 0.24*0.24*3.00 mm3. TR was 2.5 s and total scan time was 9 minutes. $$$R_1\rho$$$ mapping was collected using a T1-enhanced 3D TFE sequence with a segmented k-space scheme. A spin-lock RF strength ($$$\omega_1/2\pi$$$) was 500 Hz with duration of 0, 10, 20, 30 and 40 ms, respectively. Scan time was 11 minutes with TR/TE of 12.0/6.1 ms, turbo factor of 64, number of TFE shots of 83, shot interval of 2 s.
$$$R_2$$$ and $$$R_1\rho$$$ maps were created by pixel-wise curve-fittings to an exponential decay model with two parameters, and $$$R(\theta)_2^a$$$ map was extracted from a single 3D T2W dataset (TE=48.8 ms)2. Public and in-house software was used for image co-registration and whole cartilage manual or automatic angular-radial segmentation2. Left or right knee on two subjects was collected in the sagittal plane using a Philips 3T MR scanner. All image visualization and data analysis were performed using a software developed in IDL 8.5 (Exelis Visual Information Solutions, Boulder, CO).
Results and Discussions
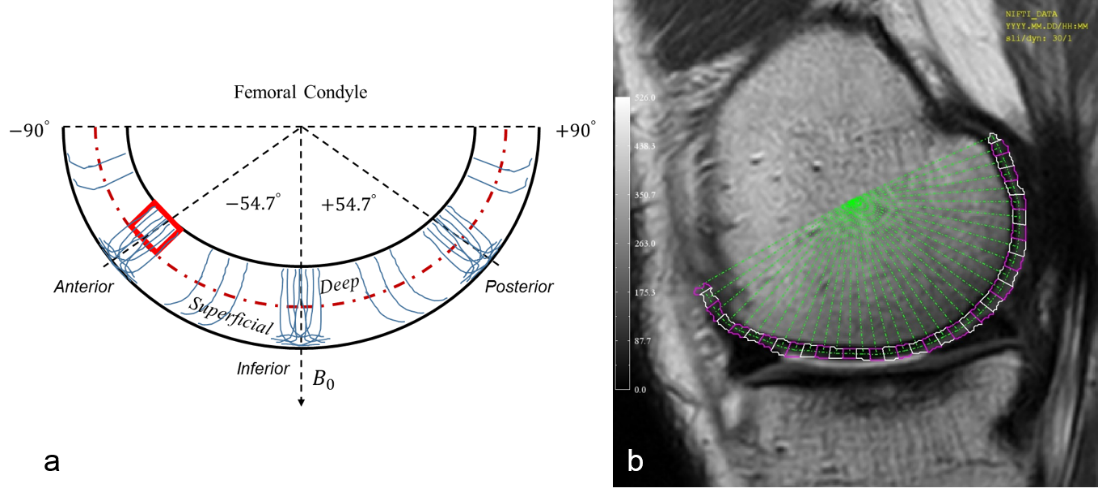
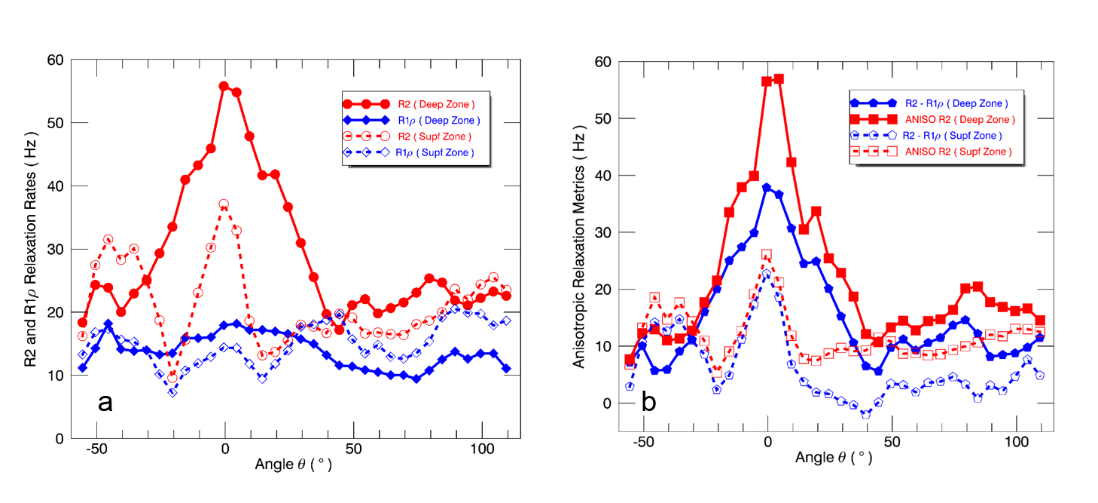
A schematic drawing is shown in Figure 1a to denote femoral cartilage spatial orientations and angular-radial ROI segmentations. Figure 1b presents a representative medial side T2W image from left knee with ROI segmentations. $$$R_2$$$ and $$$R_1\rho$$$ values from these segmented ROIs in the deep and superficial zones are plotted in Fig. 2a, highlighting the reduced and less orientation-dependent $$$R_1\rho$$$. As predicted, $$$R_2-R_1\rho$$$ was predominantly smaller than $$$R(\theta)_2^a$$$ as shown in Fig. 2b that resulted from the restricted spin-lock RF strength (500 Hz) used in clinical scans. Previous investigations demonstrated that cartilage $$$R_1\rho$$$ anisotropy could be completely removed when using $$$\omega_1/2\pi$$$ > 2000 Hz7,8.
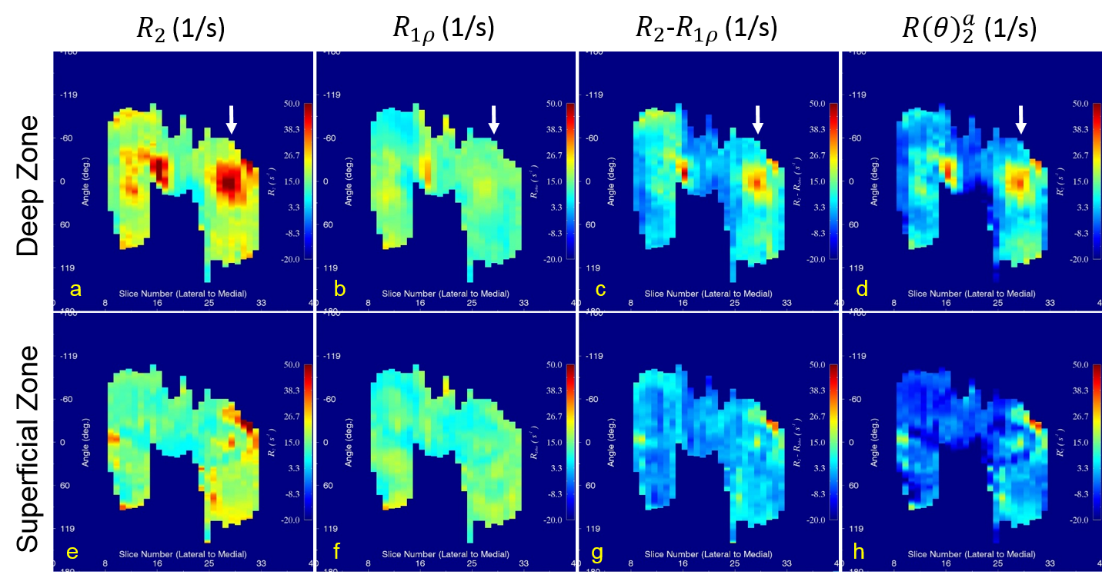
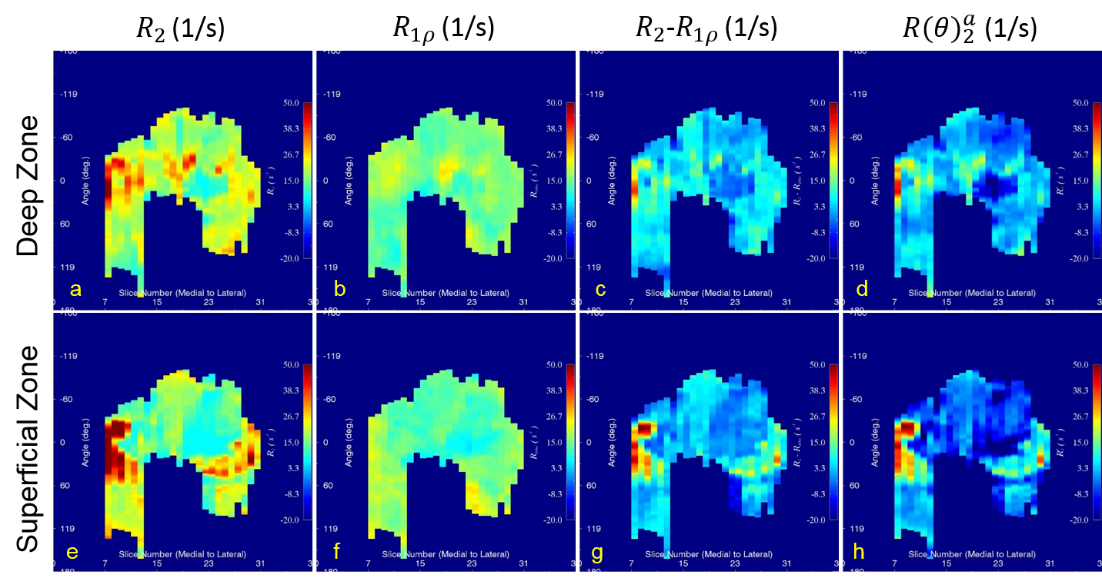
Original $$$R_2$$$ (a, e) and $$$R_1\rho$$$ (b, f), along with composite $$$R_2-R_1\rho$$$ (c, g) and derived $$$R(\theta)_2^a$$$ (d, h) parametric maps from both the deep (a-d) and superficial (e-h) zones are shown in Figure 3 and Figure 4 for left and right knee, respectively. The white arrows in Figure 3 indicate the spatial location for the image shown in Fig, 1b. Compared with $$$R_2$$$ maps, $$$R_1\rho$$$ had comparable values in both zones that were largely determined by the orientation-independent contributions.
An isotropic chemical exchange ($$$R_{ex}$$$) effect hardly contributes to $$$R_2$$$ and $$$R_1\rho$$$ at 3T5, consistent with the simulated result of 0.056 [1/s] (see ref. fig.5 caption)9. This conclusion was further supported by a recent study showing that $$$R_2$$$ and $$$R_1\rho$$$ had very similar values for human normal knees measured at 3T and 7T10.
Consistent with the theoretical predication, the orientation-dependent information derived from $$$R_2-R_1\rho$$$ and $$$R(\theta)_2^a$$$ was almost indistinguishable especially in the deep zone for two subjects, suggesting that the diagnostically most relevant information in cartilage8 could be easily and efficiently obtained with a minimum cost to clinical MR scan times2.
Conclusion
A composite metric $$$R_2-R_1\rho$$$ was shown as an incomplete anisotropic $$$R(\theta)_2^a$$$, and preliminary comparable results supported the theoretical treatments on both $$$R_2$$$ and $$$R_1\rho$$$. The potential to significantly reduce clinical MR scan times in deriving diagnostically most relevant information in cartilage warrants further evaluations and validations for the newly developed method in large clinical studies.Acknowledgements
No acknowledgement found.References
[1]. Pedoia V, et al. J Magn Reson Imaging 2017.; [2]. Pang Y, et al. ISMRM 2018 submitted abstract.; [3]. Jones GP. PH YSI CAL REVIEW 1966;148(1):332-335.; [4]. Woessner DE. Mol Phys 1977;34(4):899-920.; [5]. Mlynarik V, et al. J Magn Reson 2004;169(2):300-307.; [6]. Momot KI, et al. NMR Biomed 2010;23(3):313-324.; [7]. Akella SV, et al. Magn Reson Med 2004;52(5):1103-1109.; [8]. Hanninen N, et al. Sci Rep 2017;7(1):9606-9616.; [9]. Wyatt C, et al. J Orthop Transl 2015;3(4):197-204.; [10]. Singh A, et al. Magn Reson Med 2012;68(2):588-594.Figures